Instructor's Note. You should read over this page and the first two links provided (read the other links on this page if you are interested). This brings together many of the topics we have discussed on the global warming issue. Several exam questions may be taken from this material.
The Coming Climate
Taken from Scientific American, May 1997 (Good summary for Global Warming)
Meteorological
records and computer
models permit insights into some of the broad
weather patterns of a warmer world
Human beings have in recent years discovered that they may have succeeded in
achieving a momentous but rather unwanted accomplishment. Because of our
numbers and our technology, it now seems likely that we have begun altering the
climate of our planet.
Climatologists are confident that over the past century, the global average temperature
has increased by about half a degree Celsius.
This warming is thought to be at least partly the result of human activity, such as the
burning of fossil fuels in electric power plants and automobiles.
Based on studies of how the Earth's climate has changed over the past
century as global temperatures edged upward, as well as on sophisticated
computer models of climate, it now seems probable that warming will accompany
changes in regional weather.
For example, longer and more intense heat waves--a likely consequence of an
increase in either the mean temperature or in the variability of daily
temperatures--would result in public health threats and even unprecedented
levels of mortality, as well as in such costly inconveniences as road buckling
and high cooling loads, the latter possibly leading to electrical brownouts or
blackouts.
Climate change would also affect the patterns of rainfall and other
precipitation, with some areas getting more and others less, changing global
patterns and occurrences of droughts and floods.
Two Prongs
Researchers have two main--and complementary--methods of investigating these
climate changes.
Detailed meteorological records go back about a century, which coincides
with the period during which the global average temperature increased by half a
degree.
By examining these measurements and records, climatologists are beginning to
get a picture of how and where extremes of weather and climate have occurred.
It is the relation between these extremes and the overall temperature
increase that really interests scientists.
This is where another critical research tool-- global ocean-atmosphere
climate models -- comes in. These high-performance computer programs simulate
the important processes of the atmosphere and oceans, giving researchers
insights into the links between human activities and major weather and climate
events.
|
|
|
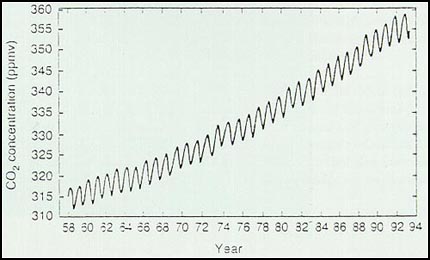
Carbon dioxide concentrations measured at Mauna Loa, Hawaii since 1958 showing trends and seasonal cycle. |
Of all the human-caused (anthropogenic) greenhouse gases, carbon dioxide has
by far the greatest impact on the global heat budget (calculated as the amount
of heat absorbed by the planet less the amount radiated back into space).
The second most influential human-caused effect on the earth's radiation
budget is probably that of aerosols, which are minute solid particles,
sometimes covered by a liquid film, finely dispersed in the atmosphere.
By blocking or reflecting light, aerosols tend to mitigate global warming on
regional and global scales.
By taking increases in greenhouse gases into account, global
ocean-atmosphere climate models can provide some general indications of what we
might anticipate regarding changes in weather events and extremes.
Unfortunately, however, the capabilities of even the fastest computers and
our limited understanding of the linkages among various atmospheric, climatic,
terrestrial and oceanic phenomena limit our ability to model important details
on the scales at which they occur.
How Hot, and How Often?
The deficiencies in computer models become rather apparent in efforts to
reproduce or predict the frequency of climate and weather
extremes of all kinds.
|
|
|
SMALL SHIFTS in the most common daily temperature cause disproportionate increases in the number of extremely hot days. The reason is that temperature distributions are roughly Gaussian. So when the highest point in the Gaussian "bell" curve moves to the right, the result is a relatively large increase (yellow area) in the probability of exceeding extremely high temperature thresholds. A greater probability of high temperature increases the likelihood of heat wave. |
![[Small Shifts graph]](0597karl1.gif)
One of the reasons temperature extremes are so difficult to model is that
they are particularly sensitive to unusual circulation patterns and air masses,
which can occasionally cause them to follow a trend in the direction opposite
that of the mean temperature.
Because of their effects on agriculture, increases in the minimum are quite
significant.
Observations over land areas during the latter half of this century indicate
that the minimum temperature has increased at a rate more than 50 percent
greater than that of the maximum.
This increase has lengthened the frost-free season in many parts of the
U.S.; in the Northeast, for example, the frost-free season now begins an
average of 11 days earlier than it did during the 1950s.
A longer frost-free season can be beneficial for many crops grown in places
where frost is not very common, but it also affects the growth and development
of perennial plants and pests.
The reasons minimum temperatures are going up so much more rapidly than
maximums remain somewhat elusive.
One possible explanation revolves around cloud cover and evaporative
cooling, which have increased in many areas. Clouds tend to keep the days
cooler by reflecting sunlight and the nights warmer by inhibiting loss of heat
from the surface.
Greater amounts of moisture in the soil from additional precipitation and
cloudiness inhibit daytime temperature increases because part of the solar
energy goes into evaporating this moisture.
More Precipitation
The relation between storms and temperature patterns is one of the reasons
it is so difficult to simulate climate changes.
The major aspects of climate--temperature, precipitation and storms--are so
interrelated that it is impossible to understand one independently of the
others.
In the global climate system, for example, the familiar cycle of evaporation
and precipitation transfers not only water from one place to another but also
heat.
Precipitation will not increase everywhere and throughout the year, however.
The distribution of precipitation is determined not only by local processes but
also by the rates of evaporation and the atmospheric circulations that
transport moisture.
On a larger scale, most models predict an increase in average precipitation
in winter at high latitudes because of greater poleward transport of moisture
derived from increased evaporation at low latitudes.
In northernmost North America (north of 55 degrees) and Eurasia, where
conditions are normally far below freezing for much of the year, the amount of
snowfall has increased over the past several decades.
Besides the overall amounts of precipitation, scientists are particularly
interested in the frequency of heavy downpours or rapid accumulations because
of the major practical implications.
Intense precipitation can result in flooding, soil erosion and even loss of
life. What change do we expect in this frequency?
Whether precipitation occurs is largely determined by the relative humidity,
which is the ratio of the concentration of water vapor to its maximum
saturation value. Computer models suggest that the distribution of relative
humidity will not change much as the climate changes.
Various analyses already support the notion of increased intensity. In the
U.S., for example, an average of about 10 percent of the total annual
precipitation that falls does so during very heavy downpours in which at least
50 millimeters falls in a single day. This proportion was less than 8 percent
at the beginning of this century.
Stormy Weather
Great as they are, the costs of droughts and heat waves are less obvious
than those of another kind of weather extreme: tropical cyclones.
These storms, known as hurricanes in the Atlantic and as typhoons in the
western North Pacific, can do enormous damage to coastal areas and tropical
islands.
As the climate warms, scientists anticipate changes in tropical cyclone
activity that would vary by region.
Not all the consequences would be negative; in some rather arid regions the
contribution of tropical cyclones to rainfall is crucial. In northwest
Australia, for example, 20 to 50 percent of the annual rainfall is associated
with tropical cyclones. Yet the damage done by a single powerful cyclone can be
truly spectacular.
Early discussions of the possible impacts of an enhanced greenhouse effect
often suggested more frequent and more intense tropical cyclones.
Because these storms depend on a warm surface with unlimited moisture supply,
they form only over oceans with a surface temperature of at least 26 degrees C.
Therefore, the reasoning goes, global warming will lead to increased ocean
temperatures and, presumably, more tropical cyclones.
Yet recent work with climate models and historical data suggests that this
scenario is overly simplistic. Other factors, such as atmospheric buoyancy,
instabilities in the wind flow, and the differences in wind speed at various
heights (vertical wind shear), also play a role in the storms' development.
The historical data are only slightly more useful because they, too, are
imperfect. It has been impossible to establish a reliable global record of
variability of tropical cyclones through the 20th century because of changes in
observing systems (such as the introduction of satellites in the late 1960s)
and population changes in tropical areas.
Nevertheless, there are good records of cyclone activity in the North
Atlantic, where weather aircraft have reconnoitered since the 1940s. Christopher W. Landsea
of the NOAA Atlantic Oceanographic and Meteorological Laboratory has documented
a decrease in the intensity of hurricanes, and the total number of hurricanes
has also followed suit.
The years 1991 through 1994 were extremely quiet in terms of the frequency
of storms, hurricanes and strong hurricanes; even the unusually intense 1995
season was not enough to reverse this downward trend. It should be noted, too,
that the number of typhoons in the northwestern Pacific appears to have gone
up.
Instructor's Note. This article is rather old. There has actually been an
increase in the number and intensity of Atlantic hurricanes after 1995. Some
researchers attribute the increase to global warming. Other research groups
attribute this recent increase to natural 30 year fluctuations in Atlantic
hurricanes and not any recent global warming. However, other scientists
conclude that while the total number of hurricanes around the world has not
changed, the hurricanes that do form are more intense today compared to a few
decades ago. Other researchers even dispute that there has been any significant
increase in intensity. The answer remains uncertain at this time and is the
subject of spirited debate among experts.
The Future
Although these kinds of gaps mean that our understanding of the climate
system is incomplete, the balance of evidence suggests that human activities
have already had a discernible influence on global climate.
In the future, to reduce the uncertainty regarding anthropogenic climate
change, especially on the small scales, it will be necessary to improve our
computer modeling capabilities, while continuing to make detailed climatic
observations.
New initiatives, such as the Global Climate Observing System,
and detailed studies of various important climatic processes will help, as will
increasingly powerful supercomputers.
But the climate system is complex, and the chance always remains that
surprises will come about. North Atlantic currents could suddenly change, for
example, causing fairly rapid climate change in Europe and eastern North
America.
Among the factors affecting our predictions of anthropogenic climate change,
and one of our greatest uncertainties, is the amount of future global emissions
of greenhouse gases, aerosols and other relevant agents. Determining these
emissions is much more than a task for scientists: it is a matter of choice for
humankind.