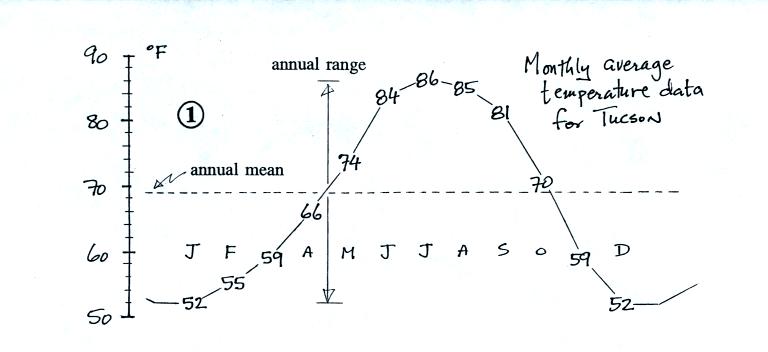
Average Monthly Temperature and Precipitation data for Tucson

Average
Monthly Temp
Month 
Average
Max Temp
Average
Min Temp
Difference
Precipitation
52
Jan
64
39
25
0.99
55
Feb
68
42
26
0.88
59
Mar
73
45
28
0.81
66
Apr
82
50
32
0.28 (see note 2)
74
May
90
59
31
0.24
84
Jun
100
68
32
0.24
86
Jul
100
73
27
2.07 (see note 3)
85
Aug
97
72
25
2.30
81
Sep
94
68
26
1.45
70
Oct
84
57
27
1.21
59
Nov
72
45
27
0.67
52
Dec
65
39
26
1.07 (see note 4)

Notes
1.   Monthly average temperatures are plotted here.  To determine the annual mean temperature add the twelve monthly average temperatures and divide by 12.  You can get a pretty good estimate of the annual mean temperature by adding the highest and lowest average monthly temperature and dividing by 2.

2.   April, May, and June is generally the driest time of year in Tucson.  This is reflected in the low montly average precipitation values.  It is fairly common to go a month or more without rain at this time of year.

      Because the air is dry and the skies are cloud free, there is generally a large difference between daytime high and nighttime low temperatures. 

3.   The summer thunderstorm season usually begins in early July.  The summer monsoon officially begins when the daily average dew point temperature is 54 F or above for three days in a row.  July, Aug, and Sept. are usually the wettest months of the year in Tucson.  Tucson gets nearly half its annual rainfall during the summer thunderstorm season. 

      Note how the difference between daytime high and nighttime low temperatures decreases once the summer thunderstorm season gets underway.  This is due to the increase in humidity and cloud cover.

4.   During the winter, middle latitude storms will occasionally drop far enough south to bring precipitation to southern Arizona.  Sometimes these storms will pull up moisture from the tropics and rainfall amounts can be significant.