Monday Mar. 24, 2008
Welcome back, I hope your Spring Break was enjoyable.
Quiz #2, the Expt. #1 revised reports, one or two optional assignments,
and the 1S1P Topic 4 reports were returned in class today. A
short "mid-term" grade summary was also handed out. Please check
to be sure all of the grade information has been entered into the
computer correctly. If you are concerned about your overall grade
I would suggest you come by my office for a short visit. There is
still enough work left this semester for you to raise your overall
average significantly. But you need to start to take corrective
action now, well before the next quiz.
The Expt. #2 report revisions are due on Wednesday, Mar. 26.
The Expt. #3 reports are due next Monday, Mar. 31. You should
collect your data, and return your materials this week so that you can
pick up the supplementary information handout.
The Expt. #4 reports are due Monday, Apr. 7.
The
following is an
introduction to an important new topic: humidity (moisture in the
air). The
beginning of
Chapter 4 can be a little overwhelming and confusing. This is one
of those rare situations where I would suggest you not read the
beginning of Chapter 4. Instead,
study these online notes and the notes you take in class. We will
work a number of humidity example problems on Wednesday and you should
fairly
quickly grasp the basic concepts.
We will be mainly interested in 4 variables, what they are
and what can cause their values to change. The variables are :
mixing ratio, saturation
mixing ratio, relative humidity, and dew point. You will find
most of what follows on pps 83-85 in the photocopied class notes.
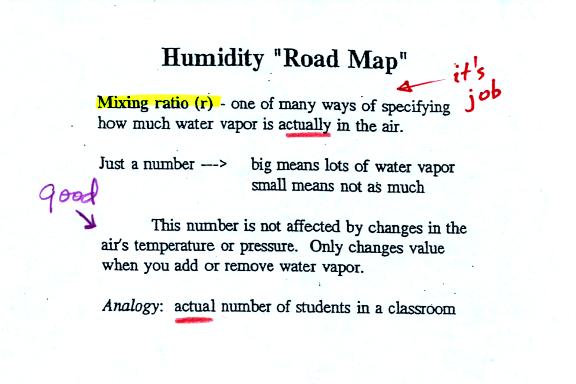
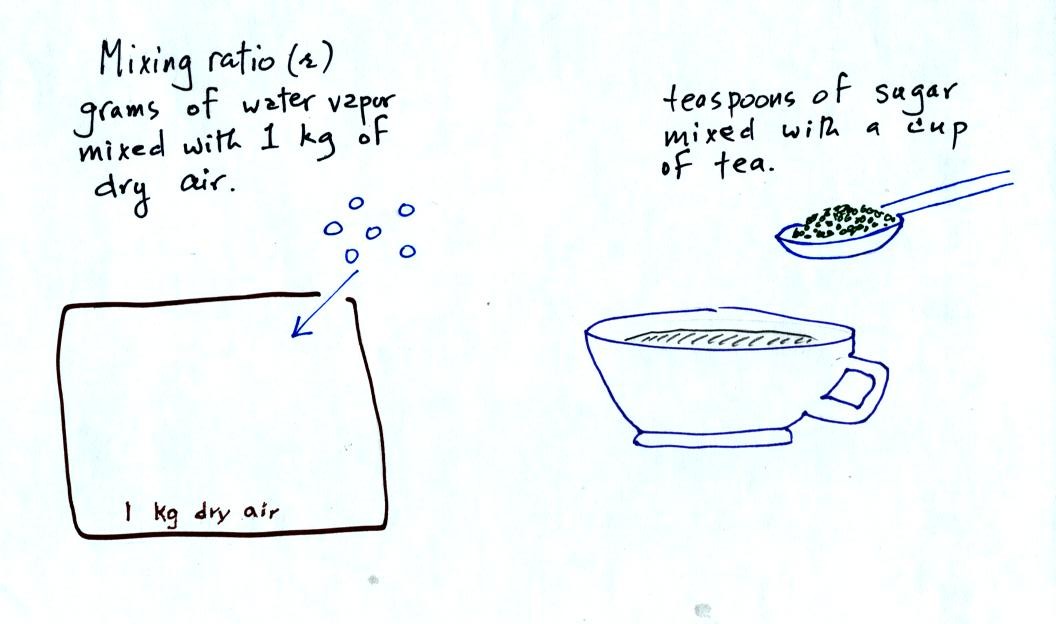
Mixing ratio tells you how much water vapor is actually in
the
air. Mixing ratio has units of grams of water vapor per kilogram
of dry air (the amount of water vapor in grams mixed with a
kilogram
of dry air). It is basically the same idea as teaspoons of sugar
mixed in a cup of tea. Here are answers to the In class Optional
Assignment that was collected at the end of class on Monday by the
way.
The value of the mixing ratio won't change unless you add
water
vapor to or remove water vapor from the air. Warming the air
won't
change the mixing ratio. Cooling the air won't change the mixing
ratio
(unless the air is cooled below its dew point temperature and water
vapor starts to condense).
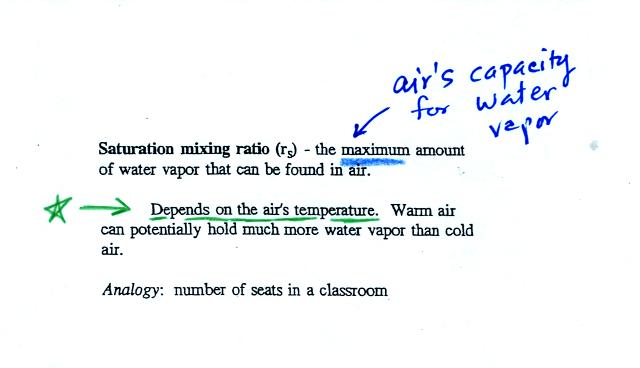
Saturation mixing ratio is just an upper limit to how much
water vapor
can be found in air, the air's capacity for water
vapor. It's a
property of air, it doesn't say anything about how much water
vapor is actually in the air (that's the mixing ratio's job).
Warm air can potentially hold more water vapor than cold air.
This variable has the same units: grams of water vapor per kilogram of
dry air. Saturation mixing ratio values for different air
temperatures are listed and graphed on p. 86 in the photocopied class
notes.
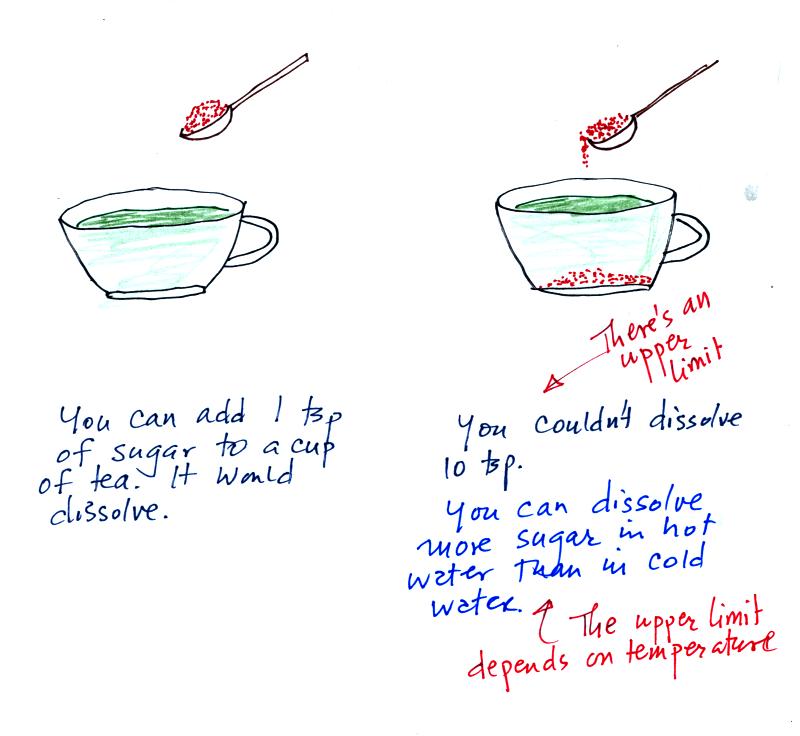
Just as is the case with water vapor in air,
there's a limit to how much sugar can be dissolved in a cup of hot
water. You can dissolve more sugar in hot water than in cold
water.
The dependence of saturation mixing ratio on air temperature is
illustrated below:
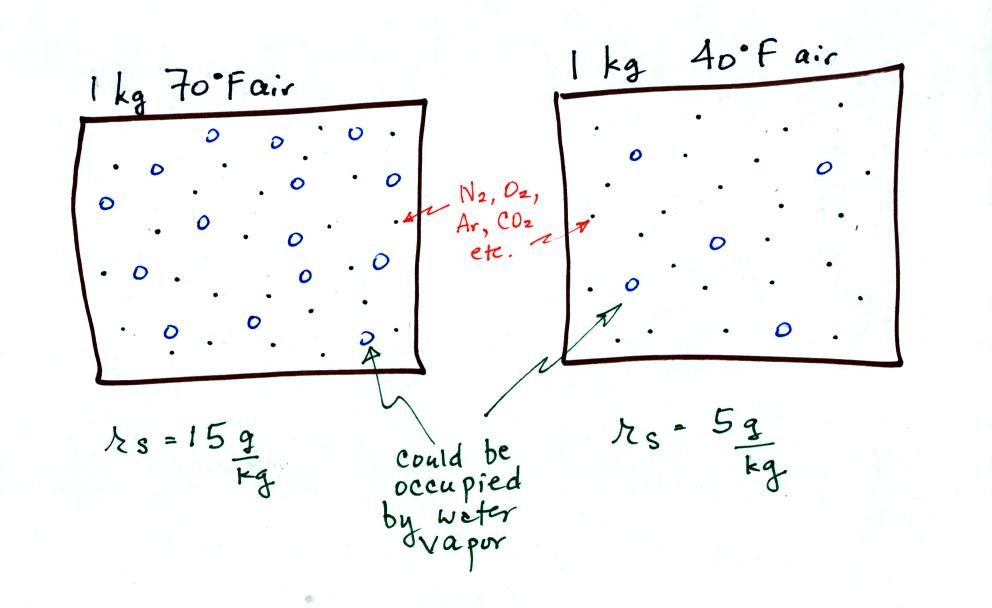
The small specks represent all of the gases in
air except
for the water
vapor. Each of the open circles represents 1 gram of water vapor
that the air could hold. There are 15 open circles drawn in the 1
kg of 70 F air; each 1 kg of 70 F air could hold up to 15 grams of
water vapor. The 40 F air only has 5 open circles; this cooler
air can only hold up to 5 grams of water vapor per kilogram of dry air.
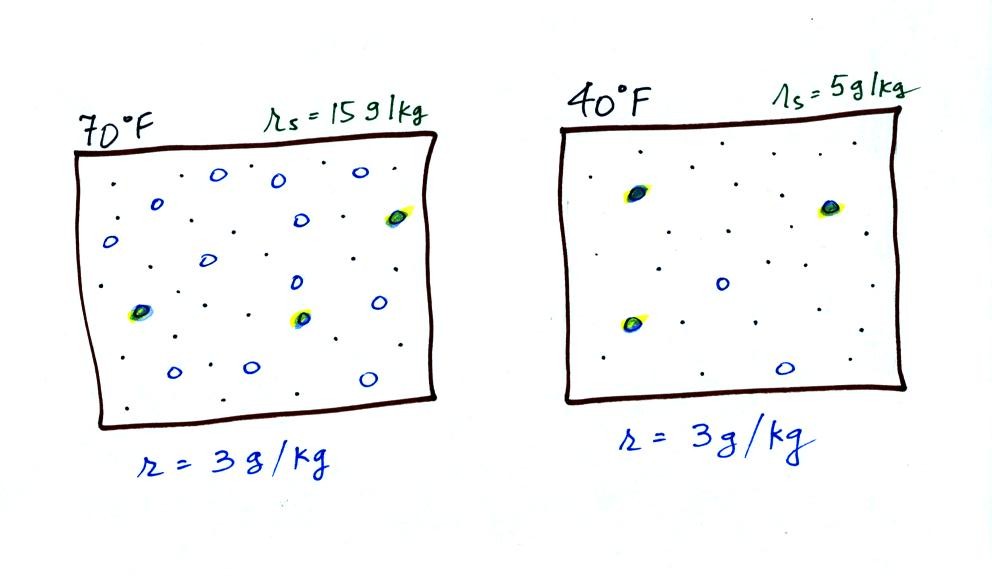
Now we have gone and actually put some water vapor
into the
volumes of
70 F and 40 F air. 3 grams of water vapor have been added to each
volume of air. The mixing ratio, r, is 3 g/kg in both cases.
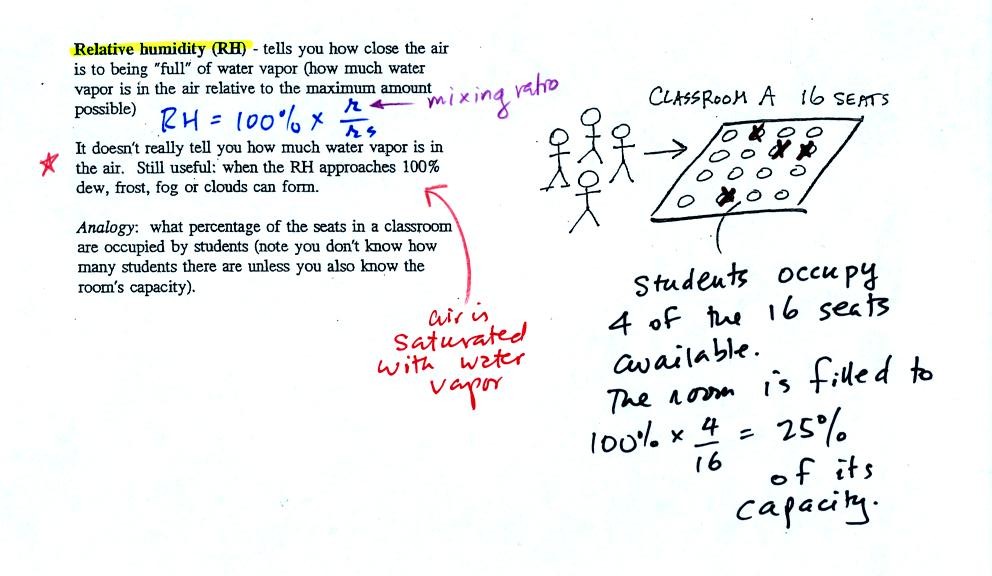
The relative
humidity is the variable most people are familiar with, it tells you
how "full" the air is with water
vapor.
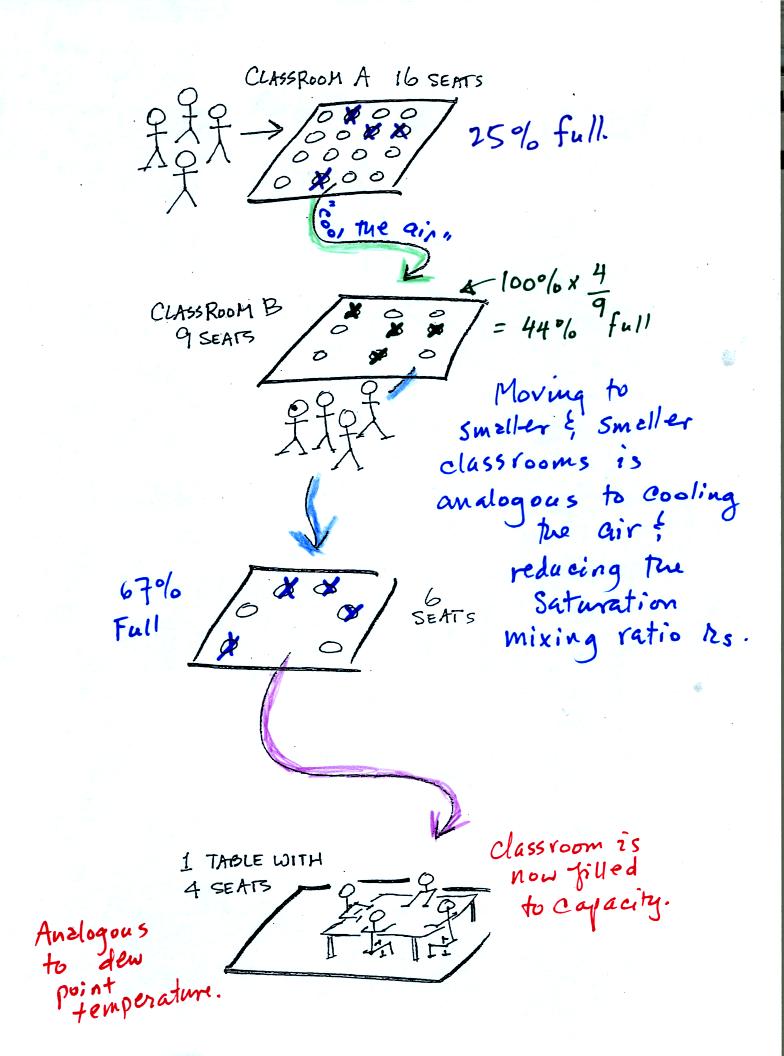
In the analogy (sketched on the right hand side of p. 83 in
the photocopied notes) 4 students wander into Classroom A which has 16
empty
seats. Classroom A is filled to 25% of its capacity.
You can think of 4, the number of students, as being analogous to the
mixing ratio. The classroom capacity is analogous
to the
saturation mixing ratio. The percentage occupancy is analogous to
the relative humidity.
Instead of students and a classroom you
could think of the 70 F and 40 F air that could potentially hold 15
grams or 5 grams, respectively of water vapor.
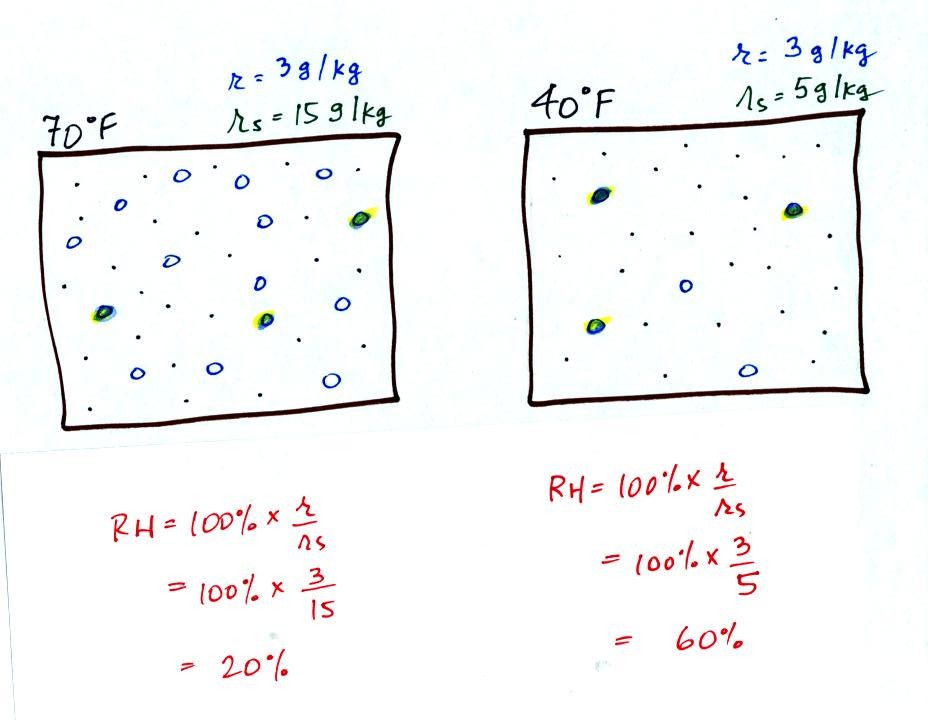
Here are the relative humidities of the 70 F and 40 F air
that each
contain 3 grams of water vapor. The 70 F air has a low RH because
this warm air's saturation mixing ratio is large. The RH in the
40 F is higher even though it has the same actual amount of water vapor
because the 40 F air can't hold as much water vapor and is closer to
being saturated.
Something important to note: RH doesn't really tell you how much water
vapor is
actually in the air. The two volumes of air above contain the
same amount of water vapor (3 grams per kilogram) but have different
relative humidities. You could just as easily have two volumes of
air with the same relative humidities but different actual amounts of
water vapor.
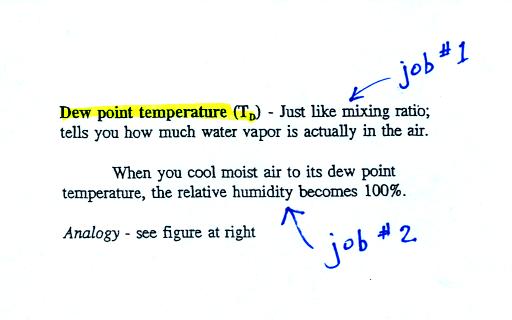
The dew point temperature has two jobs. First it is a
measure of
the actual amount of water vapor in the air. In this respect it
is just like the mixing ratio. If the dew point temperature is
low the air doesn't contain much water vapor. If it is high the
air contains more water vapor.
Second the dew point tells you how much you must cool the air in order
to cause the RH to increase to 100% (at which point a cloud, or dew or
frost, or fog would form).
If we cool the 70 F air or the 40 F air to 30 F we would
find that the
saturation mixing ratio would decrease to 3 grams/kilogram. Since
the air actually contains 3 g/kg, the RH of the 30 F air would become
100%. The 30 F air would be saturated, it would be filled to
capacity with water vapor. 30 F is the dew point temperature for
70 F air that contains 3 grams of water vapor per kilogram of dry
air. It is also the dew point temperature for 40 F air that
contains 3 grams of water vapor per kilogram of dry air.Because
both volumes of air had the same amount of water vapor,
they both also have the same dew point temperature.
Now back to our students and classrooms analogy on the
righthand
side of p. 83. The 4 students
move into classrooms of smaller and smaller capacity. The
decreasing capacity of the classrooms is analogous to the
decrease in saturation mixing ratio that occurs when you cool
air. Eventually the students move into a classroom that they just
fill to capacity. This is analogous to cooling the air to the dew
point temperature, at which point the RH becomes 100% and the air is
filled to capacity, the air is saturated with water vapor.
And
now for something completely different (see pps 81 & 82 in the
photocopied Classnotes)
We have already learned that oceans moderate
climate. A region
next to an ocean or an island surrounded by ocean will have a smaller
annual range of temperature than a location surrounded by land.
Latitude also affects the annual range of temperature. The
smallest seasonal variations are found at the equator because the days
are always 12 hours long and the sun is always high in the sky at
noon. These two factors and a couple of other factors are
discussed in an online
summary of the Controls of Temperature.
Please have a look at that section. You will find a link to an
Optional Assignment that you can download, print out, and
complete. This Controls of Temperature Optional Assignment is due
at the start of class on Monday Mar. 31.
We had a brief look at some climate data from Pohnpei Island in the
Federated States of Micronesia. You'll find some information
about Pohnpei and other nearby islands on pps 81 and 82 in the
photocopied Class Notes.
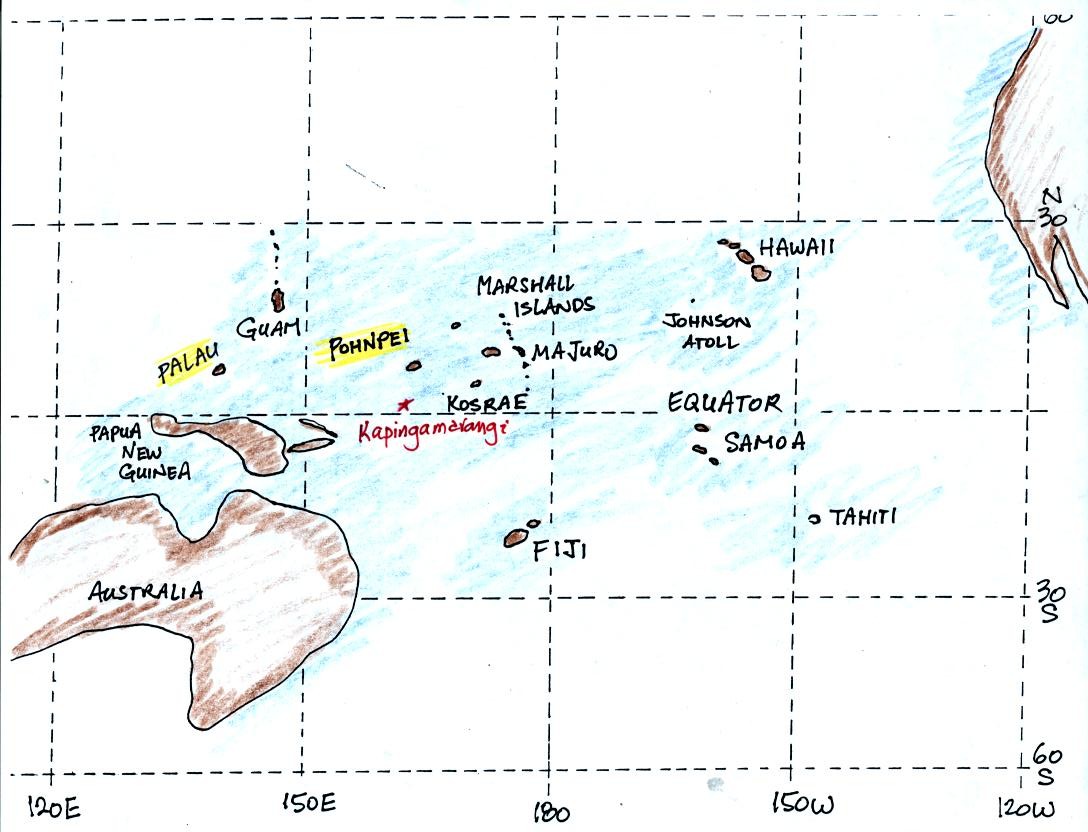
Pohnpei island is located to the east of Guam. The
current Survivor series was filmed in Palau. Kapingamarangi
Atoll in the Federated States of Micronesia is located at 1 N
latitude. Kapingamarangi Atoll is too small to have a weather
station. There is a weather station and an airport on Pohnpei
Island, however.
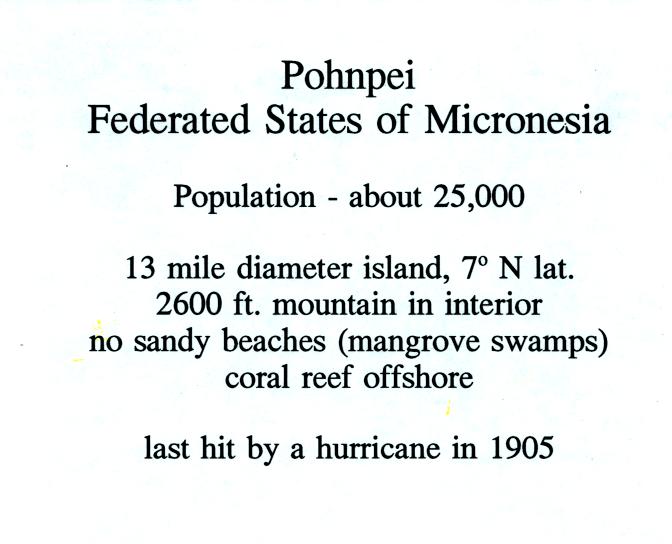
Pohnpei is a fairly large island and is a popular snorkeling and scuba
diving destination. Pohnpei has a weather station that is
operated by the US National Atmospheric and Oceanic Administration.
Because of its low latitude and
the fact that it is surrounded by water you would expect a small annual
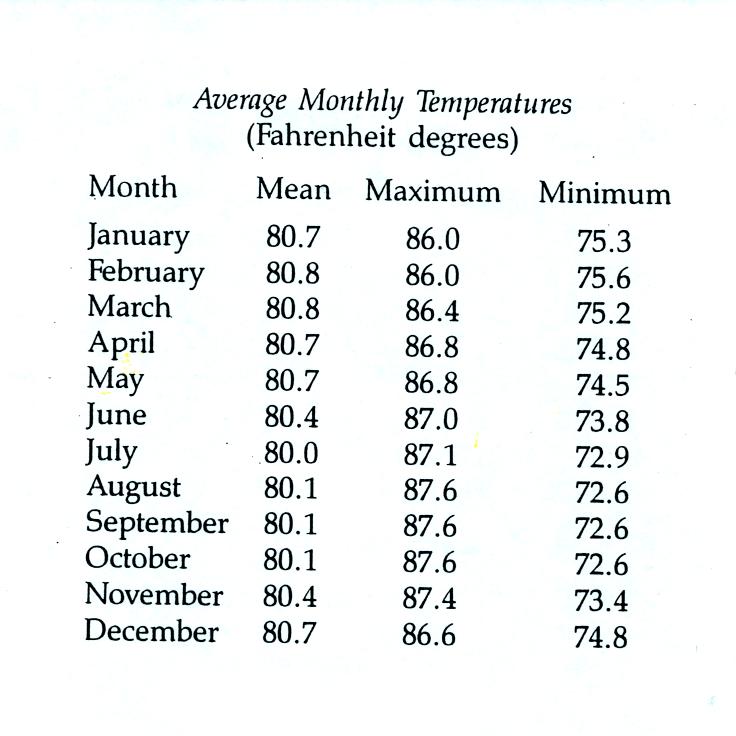
range of temperature at Pohnpei. You can see in the
table above just how small the annual range is: the average monthly
temperatures in Pohnpei range from 80.8 F in February and March to 80.0
F in July. The annual range is less than 1 F. By
comparison, the annual range in Tucson is about 34 F (52 F in December
and January to 86 F
in July). The temperature on Pohnpei has never dropped below 66
F.
The following precipitation data show that Pohnpei is also one of the
rainiest locations on earth
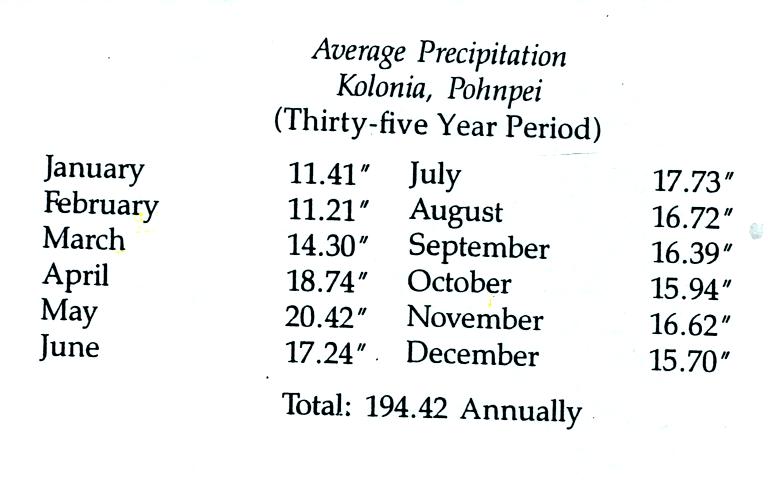
The rainiest location on earth is in Hawaii with about 460 inches
of
rain per year.