Quiz
#1 Study Guide (preliminary)
(click here
to download this study guide in Microsoft
WORD format)
Questions
on Quiz #1 will come
from topics on this study guide together with material on the Practice
Quiz Study Guide .
***
Chap. 1 (pps 13-22), Chap. 6 (pps 142-149), Appendix C (pps 441-442)
***
Station model notation.
How and where are the following weather variables plotted: cloud cover,
temperature, dew point temperature (typical values for
Tucson), wind direction and speed, common weather symbols (rain, snow,
fog, rain shower, thunderstorm, tropical storm and hurricane),
pressure. Units. After pressure is measured, what important
adjustment
is made before the pressure is plotted on the surface map? Why is that
necessary? Average and typical range of sea-level pressure values.
Surface weather maps.
A new map is prepared hourly. What
time zone or time reference is used? 24-hour clock (what time is it
when it is 17:30 MST in Tucson). Isobars and isotherms. Small
horizontal
differences in pressure cause the wind to blow. Air motions around high
and low pressure centers (northern hemisphere). Strong and weak
pressure gradients. Convergence and divergence. Rising and sinking air
motions. How do wind motions around highs and low affect the
temperature pattern? Cold fronts and warm fronts (where is the warm and
cold air, what direction are the fronts moving).
Upper level charts pt 1
Ridges
(warm air below) and troughs (cold air below). Winds blow parallel to
contour lines and from west to east.
How can upper level convergence
or divergence affect surface pressure to increase or
decrease?
Is upper level convergence or divergence needed to cause a hurricane to
intensify?
Upper level charts pt 2
(see pps
115-119 in the photocopied notes).
Pressure
decreases with increasing altitude in the
atmosphere. Does pressure decrease more quickly in warm or cold air,
in high or low density air? Are upper level conditions normally
displayed on constant altitude or constant pressure charts?
How does the pressure at point A in the
crossectional figure (right figure below) compare with the pressure at
Point
B? Is pressure
decreasing most rapidly with increasing altitude on the right or left
side of the figure? Is the coldest air
found on the right or left hand side of the figure?
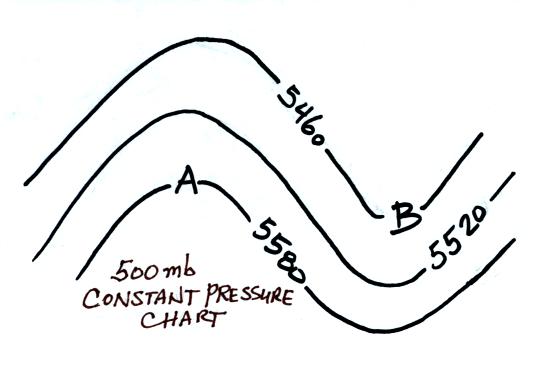
What do the numbers on the contour lines on the constant pressure
(isobaric) map (left figure above) represent? Is the
coldest air
found in the north or
south? Is the air below Point A warmer or colder than
the air below Point B. Is Point A in a ridge or a trough?
Is the pressure at Point A on the map higher, lower,
or the same as the pressure at Point B? How do the altitudes at the
two points compare?
Sample questions (from the Fall 2000 Quiz Packet)
Practice Quiz: 2,10,11,14,19
Quiz #1: 6,7,8,9,10,11
Quiz #4: 7,14 Final
Exam: 3,7,10,17,26,34,52
***
Chapter 12 (pps 334-336, 337) ***
Stratospheric ozone,
ozone hole.
Natural production and destruction of stratospheric ozone.
Man-caused destruction of ozone. What are some of the hazards due
to increased exposure to UV light caused by thinning of the ozone
layer? Where does the ozone hole form? When? What
unusual conditions lead to its formation?
Reviews
Mon.,
Feb. 18
Tue., Feb. 19
Wed., Feb. 20
|
4-5 pm
4-5 pm
4-5 pm
|
FCS 225
FCS 225
FCS 225
|