Tuesday Feb. 19, 2008
The first Optional Assignment
was returned in class today. If you
don't have a grade marked on your paper, you received full credit (0.5
pts to be added to your overall average at the end of the semester,
before the final exam). It would be a good idea to compare your
answers to the answers online even if
there aren't any questions marked wrong on your paper.
The 2nd Optional Assignment was
collected in class today. A handout with answers to the questions
was distributed in class.
The Experiment #1 reports have been graded
and were returned. You now have two weeks to revise your report
if you wish to. Revised reports are due on Tue., Mar. 4.
Please return your original report with your revised report. You
only need to rewrite sections where you want to earn additional credit.
The 1S1P Topic #1 reports were returned today. Topic #2 reports
are starting to come back from the Teaching Assistants so they should
be returned soon.
The first real quiz of the semester is on Thursday this week.
Reviews are scheduled for Tue. and Wed. afternoons from 4-5 pm in FCS
225. The quiz will cover material from both the Practice
Quiz and the Quiz
#1 Study Guides.
Today we
will look again at upper-level charts.

Hopefully you still remember (1) the trough (u-shape)
and ridge (n-shape)
features, (2) the fact that cold air is found under an upper level
trough
and warm air below a ridge, and (3) that the upper level winds blow
parallel to the contour lines and from west to east.
By the end of today's class you should understand (a) what the title
"850
mb Chart" on the upper level map above refers to. You should also
understand (b) what the numbers on the contour lines represent and what
their units are. Note (c) that the values on the contours
decrease as
you move from the equator toward higher latitude. You
should understand why that happens (temperature also decreases as you
move toward higher latitude, maybe that is the explanation). You
should understand why troughs and ridges are associated with cold and
warm air, respectively.

You really only need to remember two things from earlier in the
semester (you'll find the figure above at the bottom of p. 115 in the
photocopied Classnotes): (1) pressure decreases with increasing
altitude, and
(2) pressure decreases more rapidly in high-density air than it
does in low density air. We yet haven't learned about the
association cold air = high density air and warm air = low density air
(we'll learn about that soon when we get into Chapter 2)
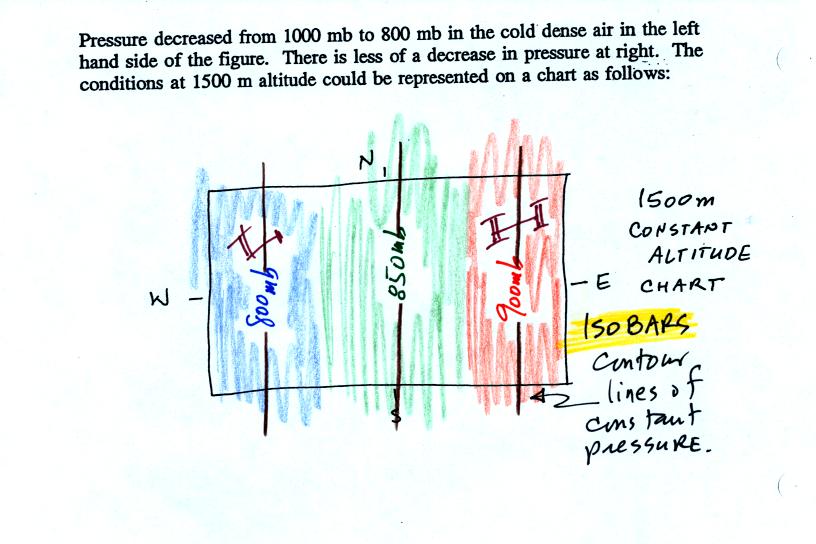
Pressure drops
from 1000 mb to 800 mb when moving upward 1500 meters in the cold
air. It decreases from 1000 mb to 900 mb in the same distance in
the warm low density air.

One way of depicting upper level conditions would be
to measure
pressure values at some fixed altitude above the ground. This
approach is shown above. Pressures range from 800 mb to 900 mb at
1500 meters altitude. The
pressure pattern could then be plotted on a constant altitude chart
using isobars (figure below). Note the lowest pressures are found
in the
cold air, higher pressures would be found in the warm air.
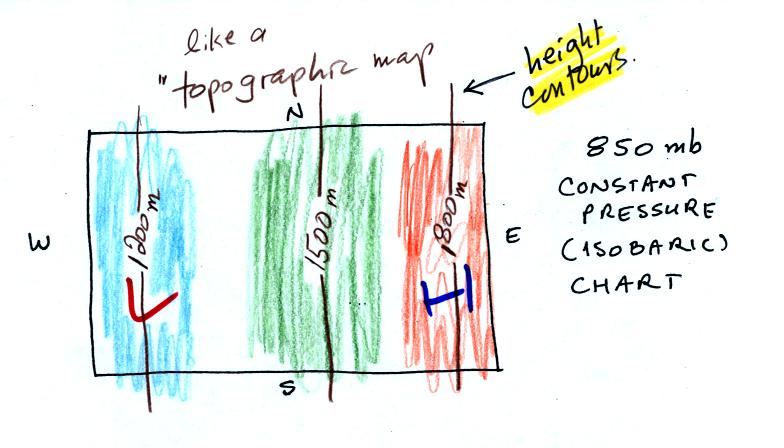
That would
seem to be a logical way of mapping upper level atmospheric
conditions. Unfortunately that isn't how things are done.
Just to make life difficult for NATS 101 students
meterologists do
things differently. Rather than plotting conditions
at a constant altitude
above the
ground, meterologists measure and plot conditions at a particular
reference pressure level above the ground.

In the picture above you start at the ground (where the pressure is
1000 mb) and travel upward until you reach 850 mb pressure. You
make a note of the altitude at which that occurs. In the cold
dense air at the left pressure decreases rapidly so you wouldn't need
to go very
high, only 1200 meters. In the warm air at right pressure
decreases more
slowly, you would have to going higher, to 1800 m.
Every point on the
sloping surface above has the same pressure, 850 mb. The altitude
above the ground is what is changing. You could draw a
topographic map of the sloping constant pressure surface by
drawing contour lines of altitude or height.
The two kinds of charts (constant altitude or constant pressure) are
redrawn below.

The numbers on the
contour lines have been left off in order to clearly see that both
types of maps have
the same overall pattern (they should because they're both depicting
the same
upper level atmospheric conditions).
In the example above temperature changed smoothly from cold to warm as
you move from left to right (west to east).
See if you can figure out what temperature pattern is producing the
wavy 850 mb constant pressure surface below.
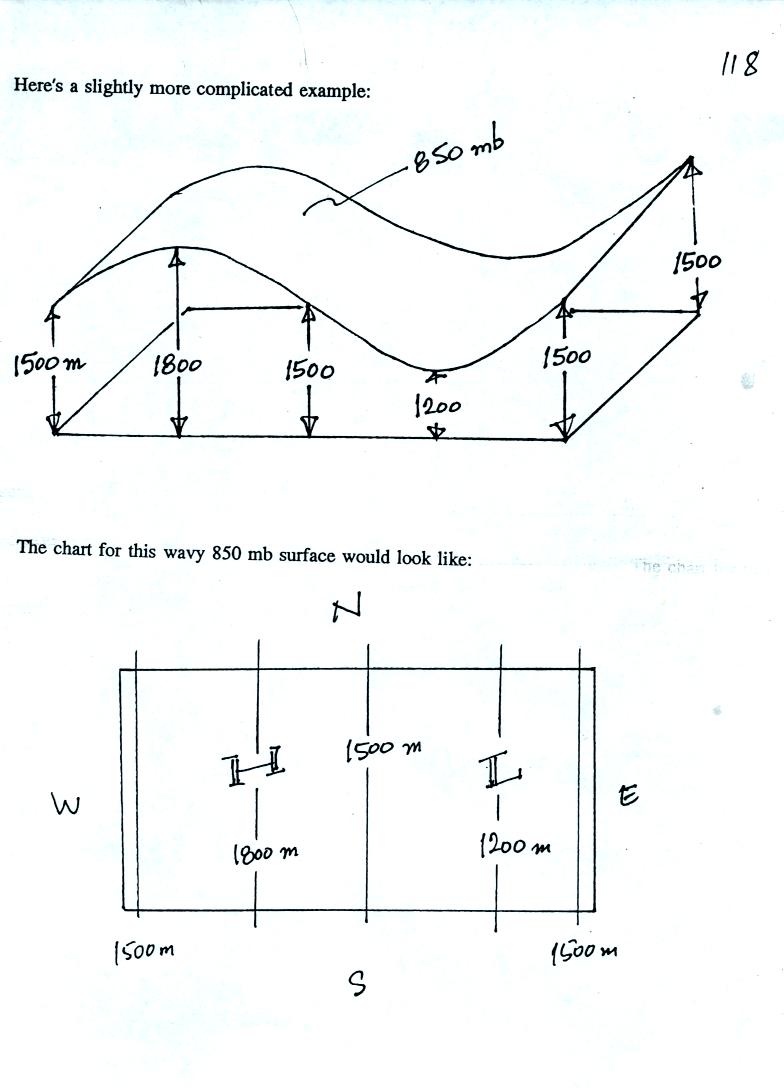
It shouldn't be too hard if you remember that the 850 mb level will be
found at relatively high altitude in the warm air where pressure
decreases slowly with increasing altitude. The 850 mb level will
be found closer to the ground in cold air where pressure decreases
rapidly with increasing altitude. Click here
when you think you
have
it figured out.
In the next figure we are going to add south to north temperature
changes in addition to the west to east temperature gradient.
Here's what the temperature pattern will look like.

Temperature drops as you move from west to east (as it did in the
previous pictures) and now it drops as you move from south to
north. What will the wavy 850 mb constant pressure surface look
like now? Click here
when you think you know (or if you just want to see the answer and
would rather not think about it).
Now let's go back to the figure at the top of p. 115 in the photocopied
Classnotes.
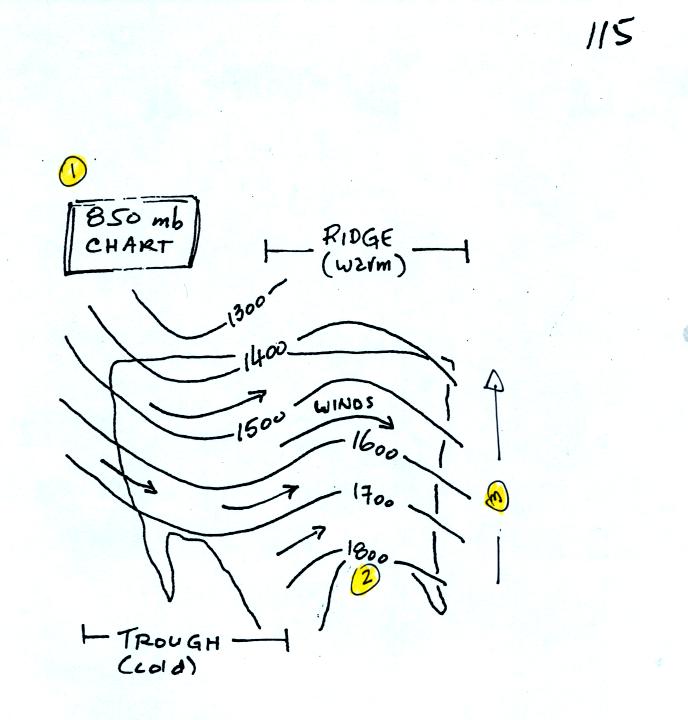
1. The title tells you this is a map depicting the 850 mb constant
pressure level in the atmosphere.
2. The numbers on the contour lines (height contours) are
altitudes (the units are meters)
3. The numbers get smaller as you head north because the air up
north is colder. The 850 mb level is closer to the ground.
Here's
another figure with some questions to test your understanding of this
material (this was mentioned but
not discussed in
class)

This is a 500 mb constant
pressure chart not an 850 mb chart like in the previous examples.
Is the pressure at Point C greater than, less
than, or equal to the pressure at Point D (you can assume that Points C
and D are at the same latitude)? How do the pressures at Points A
and C compare?
Which of the four points is found at the lowest altitude above the
ground, or are all four points found at the same altitude?
The coldest air would probably be found below which of the four
points? Where would the warmest air be found?
What direction would the winds be blowing at Point C?
Click here
for all the
answers.
Finally we
will compare upper level charts in the northern and southern hemisphere
(mentioned briefly in class)

The contour values get smaller as you move toward colder air. The
cold air is in the north in the northern hemisphere and in the south in
the southern hemisphere. The winds blow parallel to the contour
lines and from west to east in both hemispheres. The winds are
something we will look at again when we get to Chapter 6.
We spent
the remainder of the period today covering stratospheric ozone.
Don't spend a lot of time studying this new material. At most
there might only be a part of a question or perhaps an extra credit
question on stratospheric ozone or the ozone hole on this week's
quiz. The figure below is from p. 17 in the photocopied
Classnotes.

Stratospheric ozone forms naturally when UV light splits
oxygen
molecules (O2) into two oxygen atoms
(photodissociation). The O atoms can
then react
with unsplit O2 to make O3 ozone. This is
the reaction we used to make ozone in the photochemical smog
demonstration.
There are also natural processes that destroy ozone. The ozone
molecule is destroyed when it absorbs UV
light and prevents the UV light from reaching the ground. Ozone
can also be destroyed
by reacting with atomic oxygen or with another ozone molecule.
The ozone layer concentration would fluctuate up and down until the
natural processes of production and destruction balance each
other. Once balance occurs the ozone layer concentration would
remain constant. The box at the bottom of the figure above
represents this natural ozone layer concentration. Man is adding
additional processes of destruction. These will have the effect
of lowering the ozone layer concentration (symbolized above by a
smaller orange box drawn within the green box).
Once you understand how stratospheric ozone is formed you can
appreciate why the ozone layer is found not
at the bottom or
top of the atmosphere but at some level in between (at around 25 km),
where there are optimal amounts of oxygen and UV
light, the two ingredients needed to make ozone.

The ozone layer is centered around 25 km in the middle of
the
stratosphere. There is plenty of UV light at higher altitudes,
but not enough oxygen. Oxygen is plentiful at lower altitudes,
but UV light is in short supply.

Stratospheric ozone, the ozone layer, absorbs much (but not
all) of the dangerous high energy ultraviolet light from the sun.
Listed above are some of the serious hazards or problems associated
with exposure to ultraviolet light.

Human activities add substances to the atmosphere that can
potentially
reduce ozone concentration in the ozone layer (which would result in
increased exposure to UV light at the ground).
The first set of reactions above involve nitric oxide, NO. First,
NO reacts with O3 to form NO2 and O2
(ordinary molecular oxygen).
Then notice the NO2 reacts with an oxygen atom (which might
otherwise
react with O2 to make O3) to form NO again and O2.
The NO is available
again to react with and destroy another ozone molecule.
At one time many countries were considering building fleets of
supersonic aircraft that would fly into the stratosphere. The
plans were scrapped partly due to concern that the NO emissions from
these aircraft would damage the ozone layer.
The main threat now comes from chlorofluorocarbons (CFCs). The
reactions involving CFCs have been copied onto the next figure.

CFCs were at one time thought to be an ideal industrial
chemical and had a variety of uses.
CFCs are unreactive, non toxic, and stable. Once they get into
the atmosphere they remain there a long time, as much as 100 years.
CFCs released at ground level [lower left corner in the figure above]
remain in the atmosphere long enough that they can eventually make
their way up into the stratophere. UV light can then break
chlorine
atoms off the CFC molecule [ upper left portion of the figure
above]. The resulting
"free chlorine" can react with and destroy ozone. This is shown
in (1) above. Note how the chlorine atoms reappears at the end of
the two step reaction. A single chlorine atom can destroy 100,000
ozone molecules.
There are ways of removing chlorine from the atmosphere. A couple
of these so called "interference reactions" are shown in (2)
above. The reaction products, reservoir molecules
(because they store chlorine), might serve as
condensation nuclei for cloud droplets (the small water drops that
clouds are composed of) or might dissolve in the
water in clouds. In either event the chlorine containing chemical
is removed from the atmosphere by falling precipitation. Clouds
are probably the most effective way of cleaning the atmosphere.
We didn't have time in class to
discuss the following information about the ozone hole.

The ozone hole that forms above the S. Pole every year in
late
September-early October
was one of the first real indications that CFCs could react with
and destroy stratospheric ozone. The hole is not really a hole in
the ozone layer, just a temporary thinning of the ozone layer above the
S. Pole and the continent of Antarctica. The ozone concentration
decreases to perhaps 30% of its normal value.
It is unusual to find clouds in the stratosphere. It
gets very cold above the S. Pole in the winter and polar stratospheric
clouds do sometimes form (they are made from water and other
materials). This together with an
unusual wind pattern above the S. Pole in the winter are thought to
create the ozone hole when the sun returns in the spring.
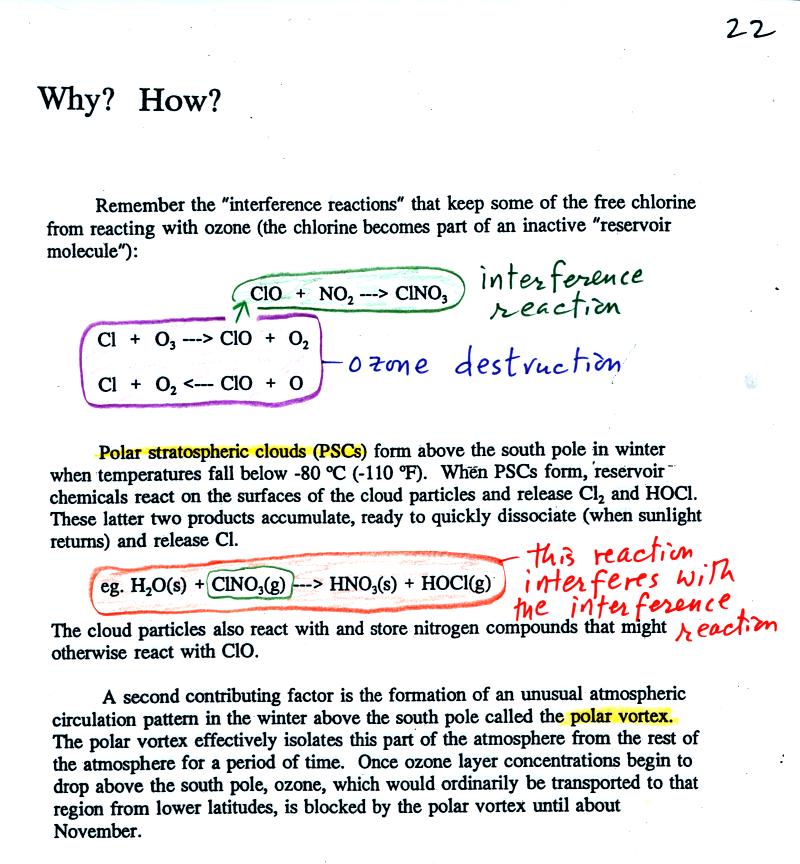
The ozone destruction reactions are shown in purple above. Cl
reacts with O3 to make ClO. This reacts with O to
produce Cl and
O2. The Cl is now available to react again with other
ozone
molecules.
In green are "interference" reactions. ClO reacts with NO2
to
make ClNO3. The Cl in this "reservoir" molecule can't
react with
any more ozone.
Now what happens above the S. Pole in the winter is that the reservoir
molecules react on the surfaces of the polar stratospheric cloud
particles to make some kind of new compound. This reaction is
shown in orange above. The new compound HOCl accumulates in the
air during the winter. When the sun reappears in the spring, the
UV light splits off all the Cl molecules which react with ozone.
A lot of chlorine suddenly becomes available and the ozone
concentration takes a nosedive.