Thu., Jan. 24, 2008
The remaining few sets of Experiment #1
materials were handed out in class today.
Today we will finish the section on air pollutants and will start a
short section on carbon dioxide and global warming. Next week we
will start to cover pressure and the vertical structure of the
atmosphere found in the middle of Chapter 1. The reading assignments page has been
updated.
Here's
some basic information about sulfur dioxide, the last of the 3 major
pollutants that we will cover this semester (you'll find this on p. 11
in the photocopied Classnotes).
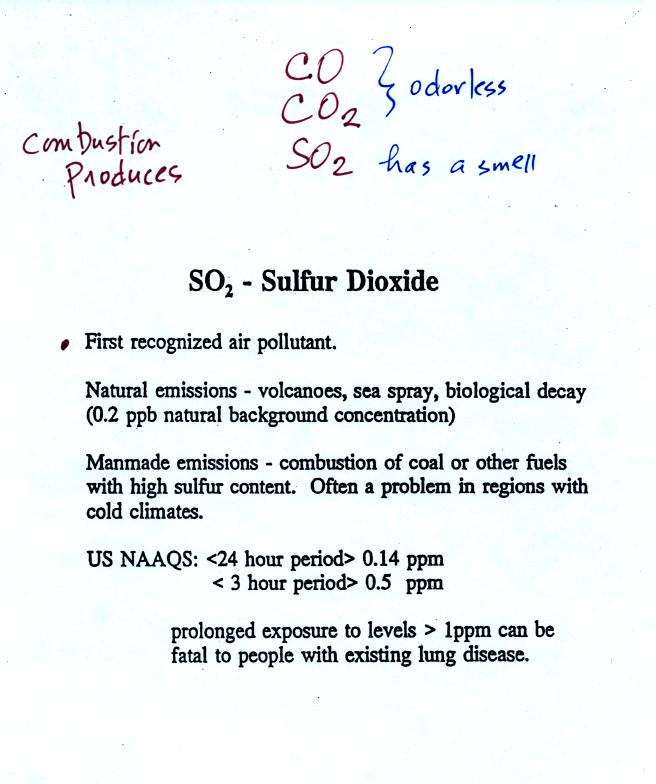
Sulfur dioxide is produced by the combustion of sulfur
containing
fuels such as coal. Combustion of fuel also produces carbon
dioxide and carbon monoxide. People probably first became aware
of sulfur dioxide because it has an unpleasant smell. Carbon
dioxide and carbon monoxide are odorless.
Volcanoes are a natural source of sulfur dioxide.
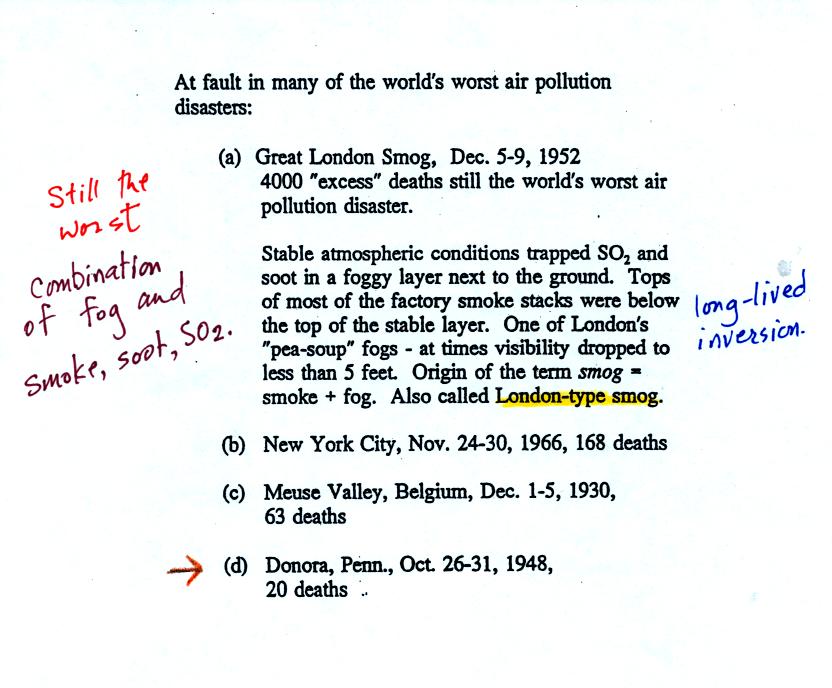
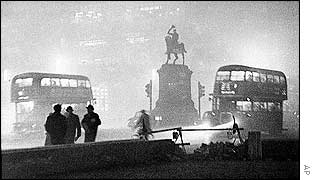
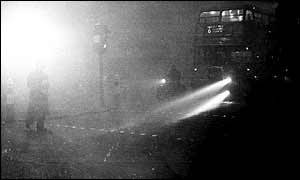
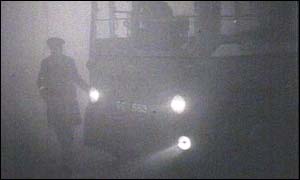
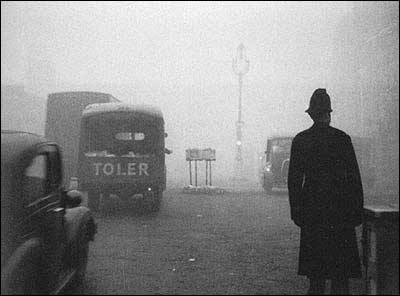
The Great
London smog is still the deadliest air pollution
event in
history. Because the atmosphere was stable, SO2
emitted into air
at ground level couldn't mix with cleaner air above. The SO2
concentration was able to build to dangerous levels. 4000 people
died during this 4 or 5 day period. As many as 8000 additional
people died in the weeks and months following the December event.
Some
of the photographs below come from articles published in 2002 on the
50th anniversary of the event.
The sulfur dioxide didn't
kill people directly. The SO2 aggravated an existing
condition of some kind and hastened their
death. The SO2 probably also made people susceptible to bacterial
infections such as pneumonia. This
link discusses the event and its health effects in more detail.
London type smog which contains sulfur dioxide and is most common
during the winter is very different from photochemical or Los Angeles
type smog. Los Angeles type smog contains ozone and is most
common in the summer.
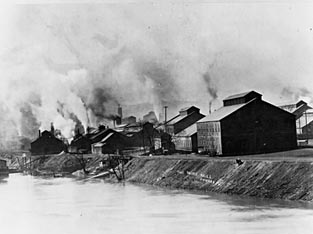
Some other air pollution disasters also involved high SO2
concentrations. The 1948 Donora Pennsylvania event is described
on p.
346 in the textbook.
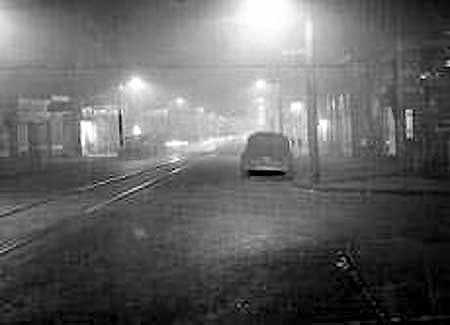
"This eerie photograph was taken at noon on Oct.
29, 1948 in Donora, PA as deadly smog enveloped the town. 20 people
were asphyxiated and more than 7,000 became seriously ill during this
horrible event."
from:
http://oceanservice.noaa.gov/education/kits/pollution/02history.html
from:
http://www.eoearth.org/article/Donora,_Pennsylvania
A few students might be
thinking about reading a book rather than
performing an experiment. "When Smoke Ran Like Water," a book
about air pollution has been added to the list
of books. The
author, Devra Davis, lived in Donora Pennsylvania at the time of the
1948 air pollution episode.
Sulfur
dioxide is one of the pollutants that can react with water in
clouds to form acid rain (some of the oxides of nitrogen can react with
water to form nitric acid). The formation and effects of acid
rain
are discussed on p. 12 in the photocopied Class Notes.

Note that clean unpolluted rain has a pH less than 7
and is
slightly
acidic. This is because the rain contains dissolved carbon
dioxide gas. Acid rain is often a problem in regions that are
100s even 1000s of miles from the source of that sulfur dioxide that
forms the acid rain.
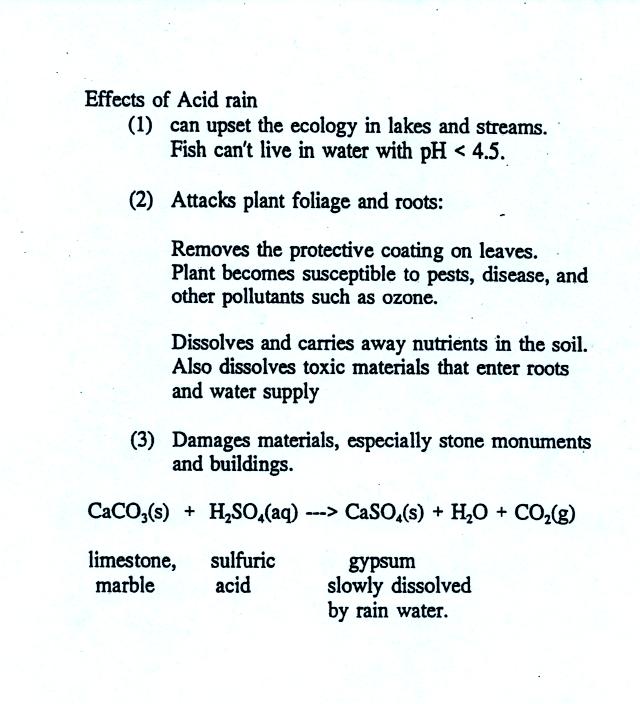
Some of the problems or consequences of acid rain.
Click here for a discussion of the acid
rain demonstration that was performed in class.
Next we
will take a brief look at the current concern over increasing
concentrations
of
carbon
dioxide in the earth's atmosphere and the
worry that this might lead
to global warming and climate change. This is a complex and
contentious subject and we will only
scratch the
surface.
You'll find this at the top of p. 1 in the photocopied
Classnotes. The highlighted numbered points were added after
class.
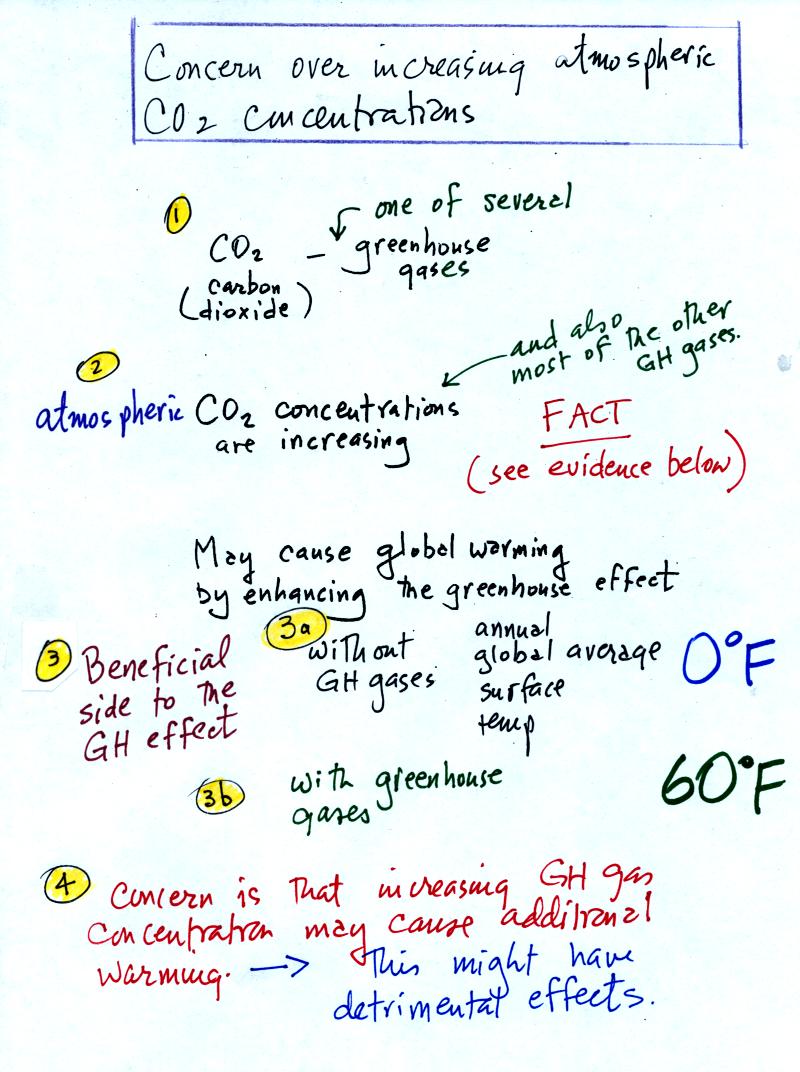
1. Carbon dioxide is one of several greenhouse gases. Much
of what we say about CO2 applies to the other greenhouse
gases as well.
2. Atmospheric CO2 concentrations are
increasing.
This is pretty generally accepted as fact. We'll look at some of
the evidence below.
3. Before we look at enhancement of the greenhouse effect,
it is important to understand first that the greenhouse effect is
beneficial.
3a. If the earth's
atmosphere didn't contain any greenhouse gases, the global annual
average surface temperature would be about 0o F.
That's pretty
cold
3b. The presence of greenhouse gases raises this average
temperature to about 60o F.
4. The concern is that increasing atmospheric greenhouse
gas concentrations might cause some additional warming. This
might not sound like a bad thing. However a small change in
average temperature might melt
polar ice and cause a rise in sea level and
flood coastal areas. Warming might change weather patterns and
bring more precipitation to some areas and less to places like
Arizona.
Now some of the data that show atmospheric carbon dioxide
concentrations are increasing.
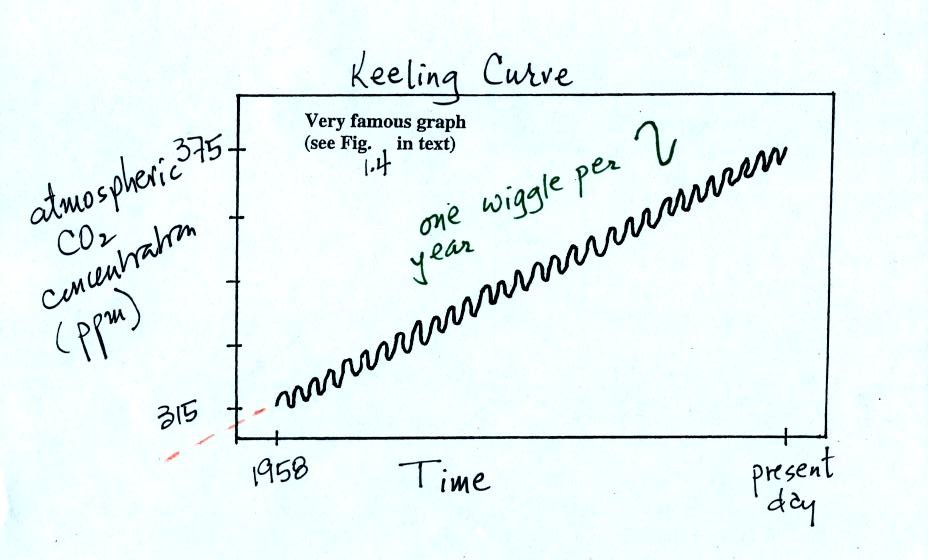
The "Keeling" curve shows measurements of CO2
that
were begun
in 1958 on top of the Mauna Loa volcano in Hawaii. Carbon dioxide
concentrations have increased from 315 ppm to about 380 ppm between
1958 and the present day. The small wiggles (one wiggle per year)
show that CO2
concentration
changes slightly during the year.
You'll find an up to date and accurately drawn record of atmospheric CO2
concentration from
the Mauna Loa observatory at the Scripps
Institution of Oceanography site.
Once scientists saw this data they began to wonder about how
CO2
concentration might have been changing prior to 1958. But how
could you now, in 2008, go back and measure the amount of CO2
in the
atmosphere in the past? Scientists have found a very clever way
of
doing just that. It involves coring down into ice sheets that
have
been building up in Antarctica and Greenland for hundreds of thousands
of years.
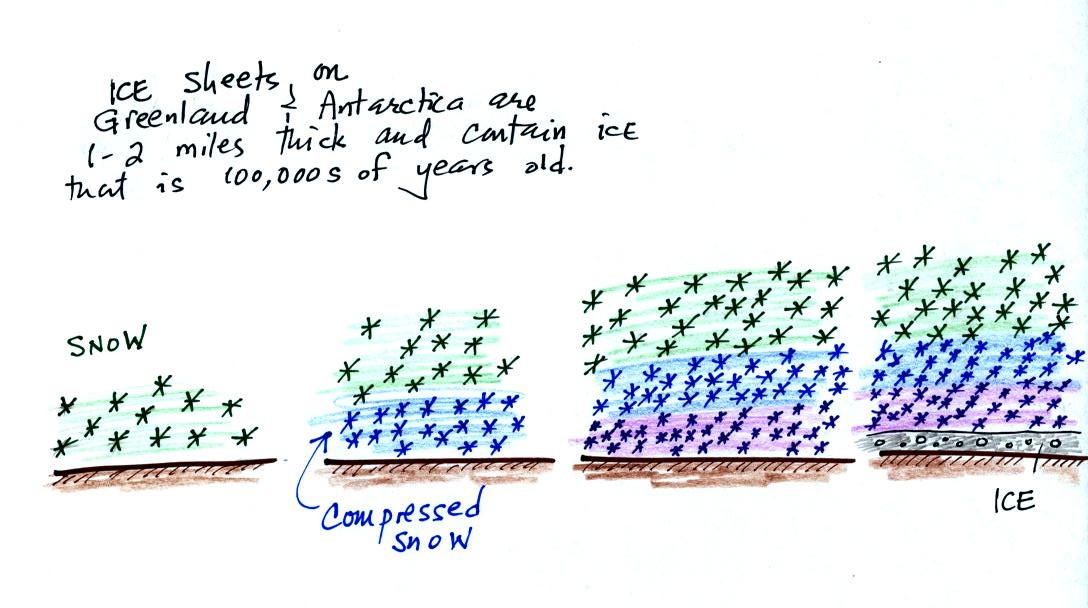
As layers of snow are piled on top of each other year after
year, the
snow at the bottom is compressed and eventually turns into a thin layer
of
solid
ice. The ice contains small bubbles of air trapped in the snow,
samples of the atmosphere at
the time the snow originally fell. Scientists are able to date
the ice layers and then
take the air out of these bubbles and measure the carbon dioxide
concentration. This isn't easy, the layers are very thin, the
bubbles are small and it is hard to avoid contamination.
A
book, "The Two-Mile Time Machine," by Richard B.
Alley discusses ice cores and climate change. This is one of the
books available for checkout should you decide to write a book report
instead of an experiment report.

Using the ice core measurements scientists have determined
that
atmospheric CO2 concentration was fairly constant at about
280 ppm
between
1000 AD and the mid-1700s when it started to increase. The start
of rising CO2 coincides with the beginning of the
"Industrial
Revolution."
Combustion of fossil fuels needed to power factories began to add
significant amounts of CO2
to the
atmosphere.

More carefully drawn graphs of changing carbon dioxide, methane, and
nitrous oxide concentrations during the past 1000 years from
Climate
Change 2001 - The Scientific Basis
Contribution of Working Group I to the 3rd Assessment Report of the
Intergovernmental Panel on Climate Change (IPCC)
Now before we look at what the earth's
temperature has been doing during this period we will try to understand
better how man has been able to change atmospheric CO2 concentrations.
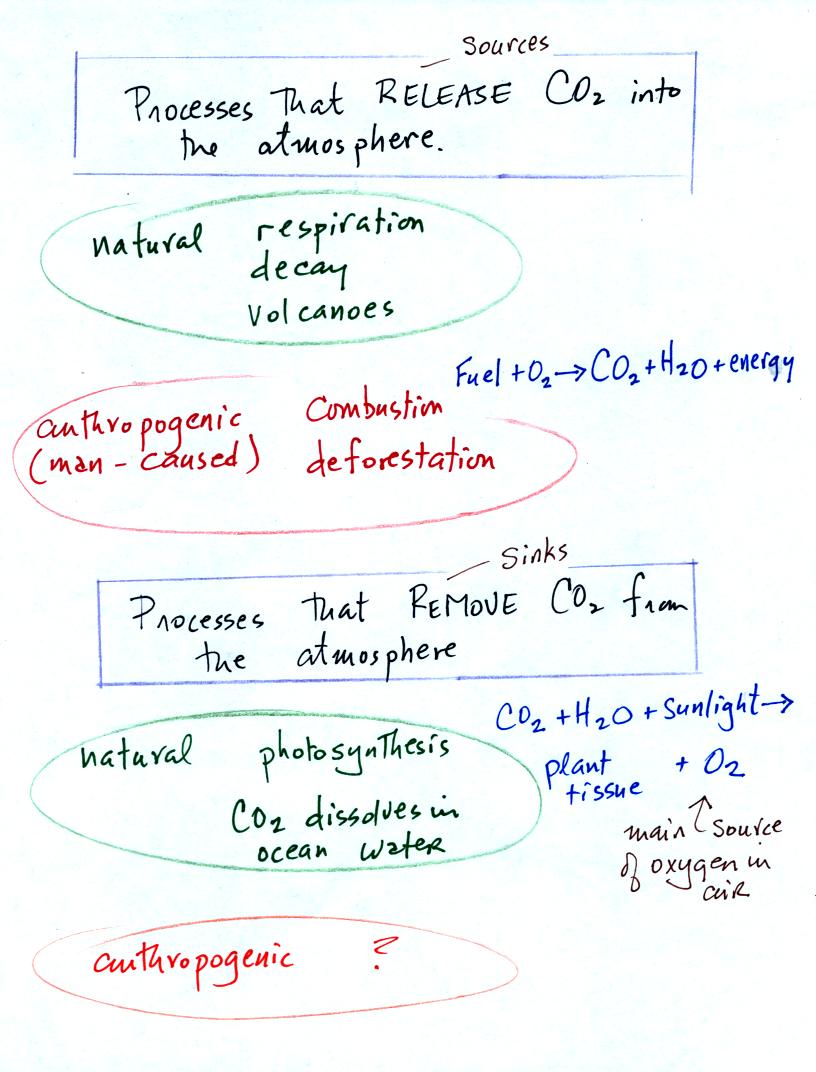
Carbon dioxide is added
to the
atmosphere naturally by respiration (people breathe in oxygen and
exhale carbon dioxide), decay, and volcanoes. Combustion of
fossil fuels, a human activity also adds CO2 to the
atmosphere. Deforestation,
cutting down and killing a tree (or burning the tree) will keep
it from removing CO2 from the air by photosynthesis.
The dead
tree will also decay and release CO2 to the air.
The chemical equation illustrates the combustion of a fossil
fuel. The by products are carbon dioxide and water vapor.
The steam cloud that
you sometimes see come from a rooftop vent or the tailpipe of an
automobile (especially during cold wet weather) is evidence of the
production of water vapor during the
combustion.
Photosynthesis removes CO2 from the air (in some respects,
photosynthesis is the opposite of combustion, photosynthesis
manufactures fuel and adds
oxygen to the air). CO2
also dissolves in
ocean water.
Note (something not mentioned in
class): your instructor is not aware of an anthropogenic process
that removes large amounts of carbon dioxide from the air.
We are now able to better understand the
yearly
variation in atmospheric CO2
concentration (the "wiggles" on the Keeling Curve).
The figure below was redrawn after class.
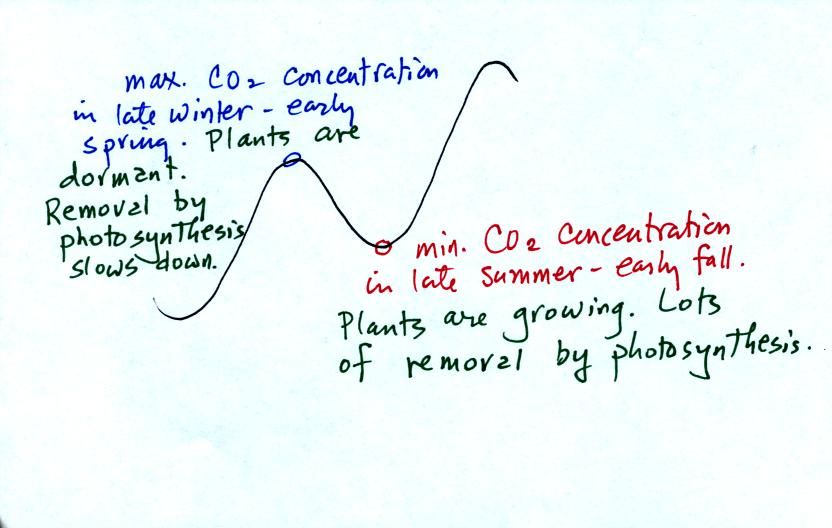
Atmospheric CO2 peaks in the late winter
to early
spring. Many
plants die or become dormant in the winter. With less
photosynthesis, more CO2 is added to the atmosphere than can
be
removed. The concentration builds throughout the winter
and reaches a peak value in late winter - early spring. Plants
come back to life at that time and start to remove the "excess" CO2.
In the summer the removal of CO2 by photosynthesis
exceeds
release. CO2 concentration decreases throughout the
summer and
reaches a minimum in late summer to early fall.
With careful measurements you could probably also observe a daily
variation in atmospheric CO2 concentrations.
To
really understand
why human activities are causing atmospheric CO2
concentration to
increase we need to look at the relative amounts of CO2
being added to
and being removed from the atmosphere (like amounts of money moving
into and out of a bank account and their effect on the account
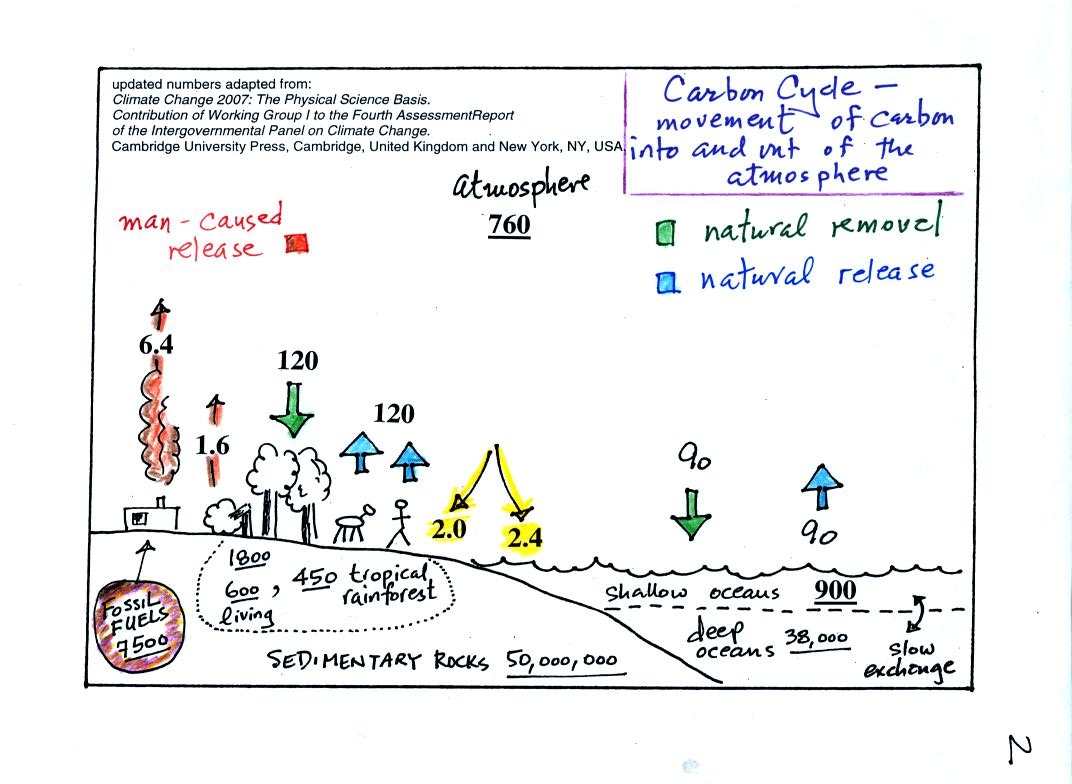
balance). A simplified version of the carbon cycle is shown
below. This figure (not shown or discussed in class on Thursday)
differs somewhat from the one on p. 2 of the photocopied
Classnotes. Copies of this updated figure were distributed in
class.
This requires
some
careful examination.
1. The underlined numbers show
the amount of carbon stored in "reservoirs." For example 760
units* of carbon
are stored in the atmosphere (predominantly in the form of CO2,
but
also in small amounts of CH4 (methane),
CFCs
and other gases; carbon is found in each of those
molecules). The other numbers show
"fluxes," the amount of carbon moving into or out of the atmosphere
every
year. Over land, respiration and decay add 120 units* of carbon
to the
atmosphere every year. Photosynthesis (primarily) removes 120
units every year.
2. Note the natural processes
are in balance (over land: 120 units added and 120 units removed, over
the oceans: 90 units added balanced by 90 units of carbon removed from
the atmosphere every year). If these were the only processes present,
the atmospheric concentration (760 units)
wouldn't change.
3. Anthropogenic (man caused) emissions
of
carbon into the air are small compared to natural processes. About
6.4 units are added during combustion of fossil fuels and 1.6
units are added every year because of deforestation (when trees are cut
down they decay and add CO2 to the air, also because they
are dead they
aren't able to remove CO2 from the air by photosynthesis)
The rate at which carbon is added to the atmosphere by man is not
balanced by an equal rate of removal: 4.4 of the 8 units added every
year are removed (highlighted in yellow in the figure). This
small imbalance (8 - 4.4 = 3.6 units of carbon are left in the
atmosphere every year) explains why
atmospheric carbon dioxide concentrations are increasing with time.
4. In the next 100 years or so,
the 7500 units of carbon stored in the fossil fuels reservoir (lower
left
hand corner of the figure) will be added to the air. The big
question is how will the atmospheric
concentration change and what effects will that have on climate?
*don't worry about the units. But here they are
just in case you are interested: Gtons (reservoirs) or Gtons/year
(fluxes)
Gtons = 1012 metric tons. (1 metric ton is 1000 kilograms or
about 2200
pounds)