Friday Mar. 13! again (the second time this semester)
click here to download these notes in a
more printer friendly format
About a song and a half this afternoon from Missy Higgins.
She'll be appearing at the Rialto Theatre in Tucson on the Spring
Equinox (Fri., Mar. 20)
The quizzes have been graded. Check the grading carefully.
I hope to grade all the 1S1P reports over Spring Break together with
the Expt. #1 revised reports and the Controls of Temperature Optional
Assignments.
If that happens (and it may not because remember St. Patrick's day and
the Spring Equinox
are next week, March
Madness starts next week, the weather forecast is for above average
temperatures, ...) I will try to put together
somekind of a midterm
grade summary.
We're going to cover 2, maybe 3, topics today.
Topic
#1
On the equinoxes, the sun rises exactly in the east and
sets
exactly in the
west. The picture below shows the position of the sun at sunrise
(around 6:30 am on the spring and fall equinox in Tucson).
At noon you need to look about 60 degrees above the southern
horizon to see the sun
The sun sets exactly in the west at around 6:30 pm on the
equinoxes in Tucson
This is a 2 pm class
Most of you are more likely to see the sun set (perhaps) than see the
sun
rise. The figure below shows you about what you would see if you
looked west on Speedway (from Treat Ave.) at sunset. In the
winter the sun will set south of west, in the summer north of west
(probably further south and north than shown here). On the
equinoxes the sun sets exactly in the west.
If you aren't careful, you can get yourself seriously
injured, even killed,
on
or around the equinoxes. Can you figure out how that might happen?
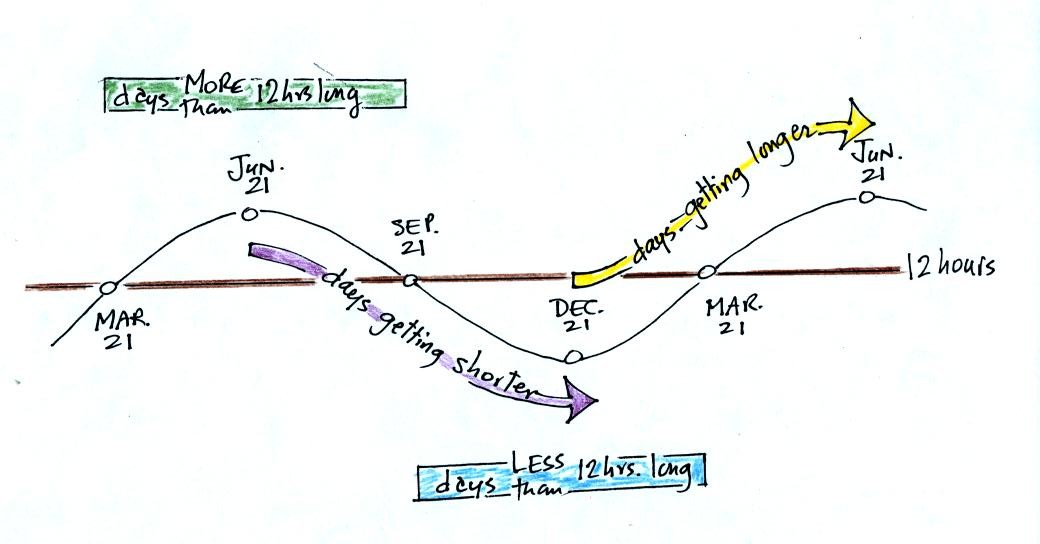
Dec. 21st, the winter solstice, is the shortest day of the
year (about 10 hours of daylight in Tucson). The days have slowly
been getting longer all semester. This will continue up until June 21,
the summer solstice, when there will be about 14 hours of
daylight. After that the days will start to shorten as we make
our way back to
the winter solstice.
The length of the day changes most rapidly on the equinoxes. The
spring equinox is on Mar. 20 this year.
On to
Topic #2
Do you remember the mysterious Point X near the Equator in the middle
of the Pacific Ocean at the end of the Controls of Temperature online
notes? That was just an excuse for me to tell you
about an awesome field experiment I took part in several years
ago.
The photograph above appeared on the cover of the April 1994
issue of
the Bulletin of the American Meteorological Society. If you look
closely you'll notice your NATS 101 instructor (he had been given the
nickname "Wilbur" by one of the members of the group, the other bald
man's name was Orville). This photo was taken on Kapingamarangi
Atoll (shown on the map below), shortly before all the men were about
to board ship and leave Kapingamarangi. The two women (Erica at
left, Maureen in the middle) were going to remain behind and operate
all of the research equipment. The scene looks happy enough, but
"Wilbur" revealed that he had taken a liking to one of the two women
and was anything but happy.
What we were doing on Kapingamarangi? We were a small
part of a much larger field experiment. Wilbur and Orville's job
was to install the tall white lightning detector at the left edge of
the photograph. They would later travel to Rabaul (on New Britain
island) and Kavieng (New Ireland island) in Papua New Guinea and
install
two more detectors. Papua New Guinea would turn out to be a very
different place. Until recently some of the highland tribes there
practiced cannibalism. You can also get malaria in Papua
New
Guinea.

To get to Kapingamarangi you first need to fly to Pohnpei (an
island in
the Federated States of Micronesia). The route is shown
above. Then you take a cargo ship for about a 4 day sail to
Kapingamarangi. We had intended to fly to Pohnpei, set sail for
Kapinga the next day, and then spend about a month on
Kapingamarangi. The ship however was delayed 3 weeks. That
gave us plenty of time to visit the island of Pohnpei but ultimately
meant we could only spend a few days on Kapingamarangi..

Here's a reminder of
how temperatures change during the year in Tucson.
Pohnpei is located at low latitude in the middle of the Pacific
Ocean. Both of those factors will reduce the annual range of
temperature. How
large do you think the annual range is?
The following precipitation data show that Pohnpei is also one of
the
rainiest locations on earth
Close to 400 inches of rain may fall in the interior of
Pohnpei. The rainiest location on earth is in Hawaii with about
460 inches of
rain per year.
Pigs
are also an important part of daily life on Pohnpei, Kapingamarangi,
and the other islands in Micronesia.
The Micro Glory (shown below) sails back and forth between
Pohnpei
and Kapingamarangi about once a month. The ship carries supplies
to the people on Kapingamarangi and some other small islands.
They pay for the supplies with
pigs (the pigs are sold on Pohnpei). We shared deck space on the
Micro Glory on the trip back to Pohnpei with 20 to 30 pigs (they were
hoisted aboard in nets)
Most of the lower deck in the photo above (under the
hoists)
was occupied by pigs on the return trip. One of the pigs died on
the return trip - that was a very serious matter.
We also had a chance to sample some of the local beverages.
Drinking sakau (as it is called on Pohnpei) turns your mouth and
throat numb. It is supposed to relax you, make you sleep more
fully, and doesn't seem to have any after effects. Until fairly
recently
you could buy kava in pill form at local supermarkets. However,
because of reports that it can cause serious liver problems, that is no
longer the case. There are no reports of liver problems when
drinking kava that has been prepared in the traditional way. Here is a link to a
Wikipedia article on kava.
We never tried betelnut. Areca nuts are wrapped in betel
leaves
and chewed together with lime (lime is pretty caustic, that is one of
the reasons I didn't try betelnut). The resulting mixture is a
mild
stimulant (some people add tobacco to the mix). The most
interesting aspect, however, is that chewing betelnut colors your mouth
and teeth
bright red.
You don't
swallow betelnut, you spit it out. You see the bright red stains
on sidewalks and the ground wherever you go. Most hotels will
also have a large sign near the entrance reminding guests not to chew
betelnut inside the hotel. You can read more about betelnut here.
Topic
#3 Introduction to Humidity Variables
Try to read through this material before class on Mon.,
Mar. 23.
The
following is an
introduction to an important new topic: humidity (moisture in the
air). This topic and the terms that we will be
learning and using can be confusing. That's the reason for this
introduction. We will be mainly be
interested in 4 variables, what they are
and what can cause their values to change. The variables are :
mixing ratio, saturation
mixing ratio, relative humidity, and dew point. You will find
much of what follows on page 83 in the photocopied ClassNotes.
Mixing ratio tells you how much water vapor is actually in
the
air. Mixing ratio has units of grams of water vapor per kilogram
of dry air (the amount of water vapor in grams mixed with a
kilogram
of dry air). It is basically the same
idea as teaspoons of
sugar
mixed in a cup of tea. You may be tempted to click on the words
highlighted in blue. Most of these aren't links. One of
them is, it will take you to a hidden optional assignment.

The value of the mixing ratio won't change unless you add
water
vapor to or remove water vapor from the air. Warming the air
won't
change the mixing ratio. Cooling the air won't change the mixing
ratio
(unless the air is
cooled below its dew point temperature and water
vapor starts to condense). Since the mixing ratio's job is to
tell you how much water vapor is in the air, you don't want it to
change unless water vapor is added to or removed from the air.
Saturation mixing ratio is just an upper limit to how much
water vapor
can be found in air, the air's capacity for water
vapor. It's a
property of air, it doesn't say anything about how much water
vapor is actually in the air (that's the mixing ratio's job).
Warm air can potentially hold more
water vapor than cold air.
This variable has the same units: grams of water vapor per kilogram of
dry air. Saturation mixing ratio values for different air
temperatures are listed and graphed on p. 86 in the photocopied class
notes.
Just as is the case with water vapor in air,
there's a limit to how much sugar can be dissolved in a cup of hot
water. You can dissolve more
sugar in hot water than in cold
water.
The dependence of saturation mixing ratio on air temperature is
illustrated below:
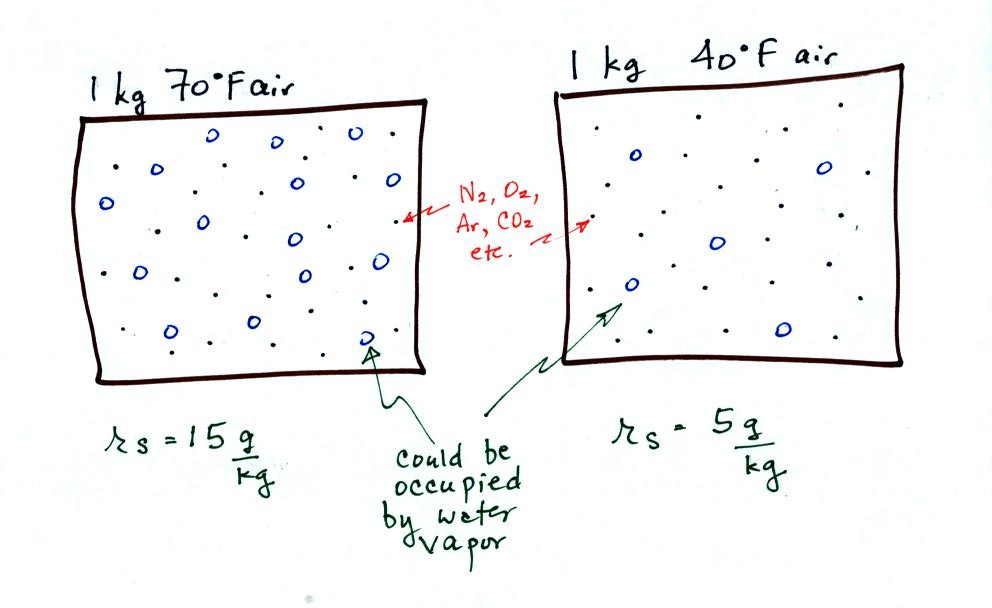
The small specks represent all of the gases in
air except
for the water
vapor. Each of the open circles represents 1 gram of water vapor
that
the air could
potentially hold. There are 15 open circles
drawn in the 1
kg of 70 F air; each 1 kg of 70 F air could hold up to 15 grams of
water vapor. The 40 F air only has 5 open circles; this
cooler
air can only hold up to 5 grams of water vapor per kilogram of dry air.
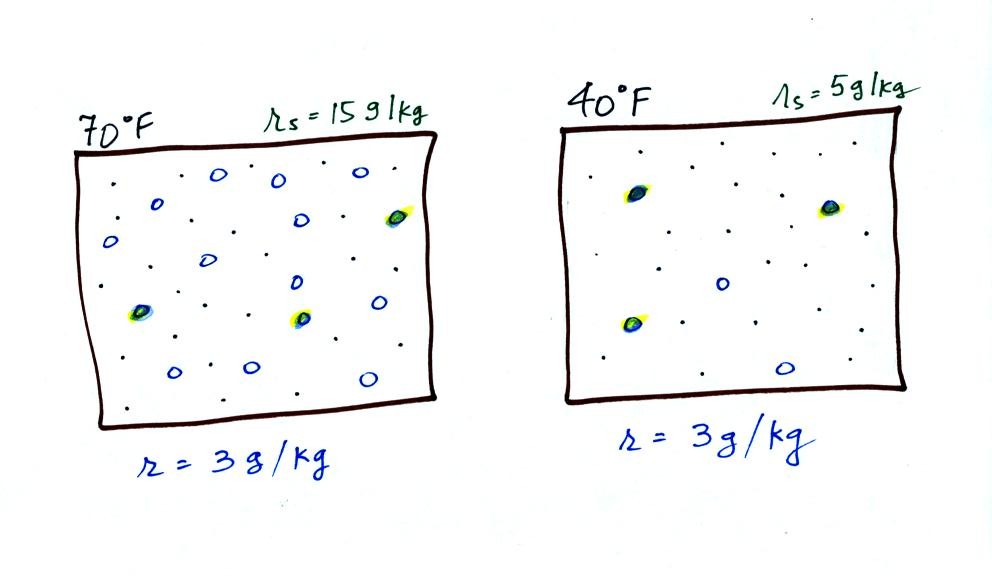
Now we have gone and actually put some water vapor
into the
volumes of
70 F and 40 F air. The same amount, 3 grams of water vapor, has
been added to each
volume of air. The mixing ratio, r, is 3 g/kg in both cases.
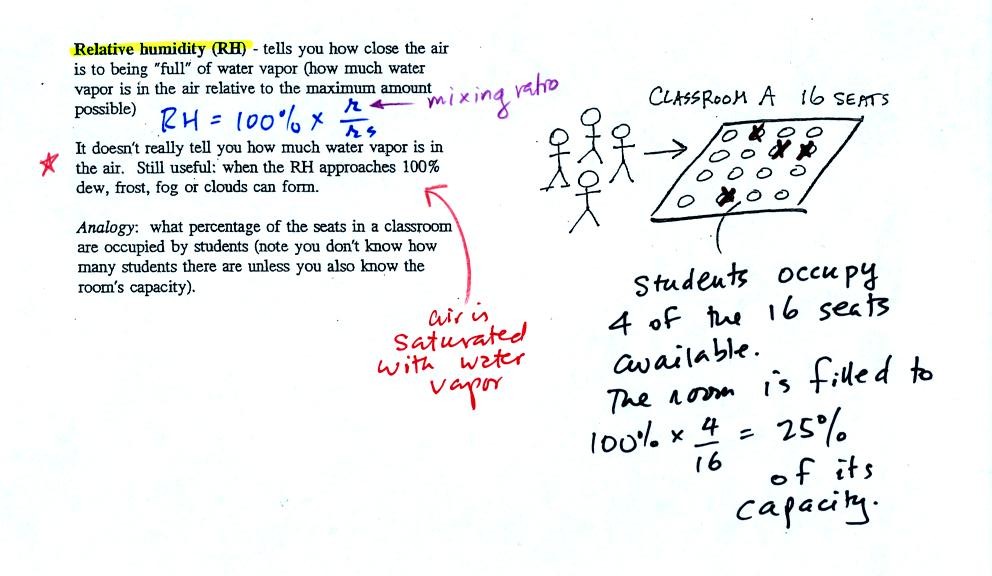
The relative
humidity is the variable most people are familiar with, it tells you
how "full" the air is with water
vapor.
In the analogy (sketched on the right hand side of p. 83 in
the photocopied notes) 4 students wander into Classroom A which has 16
empty
seats. Classroom A is filled to 25% of its capacity.
You can think of 4, the number of students, as being analogous to the
mixing ratio. The classroom capacity is analogous
to the
saturation mixing ratio. The percentage occupancy is analogous to
the relative humidity.
Instead of students and a classroom you
could think of the 70 F and 40 F air that could potentially hold 15
grams or 5 grams, respectively of water vapor. Here is the
Optional Assignment I mentioned I would hide in these notes. It
will be due at the beginning of class on Mon., Mar. 23.
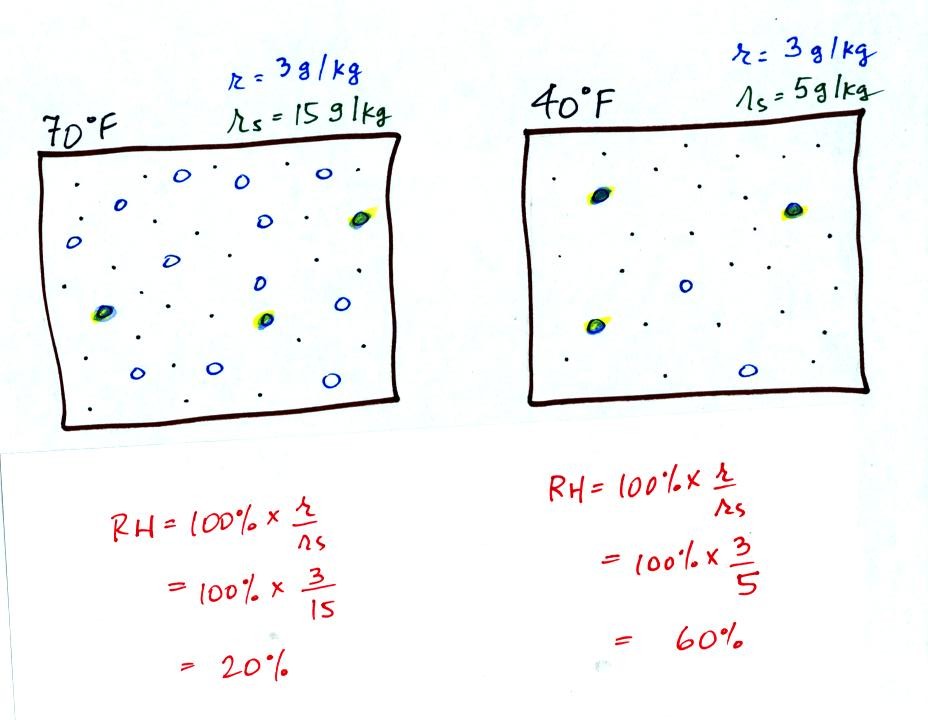
Here are the relative humidities of the 70 F and 40 F air
that each
contain 3 grams of water vapor. The 70 F air has a low RH because
this warm air's saturation mixing ratio is large. The RH in the
40 F is higher even though it has the same actual amount of water vapor
because the 40 F air can't hold as much
water vapor and is closer
to
being saturated.
Something important to note: RH doesn't really tell you how much water
vapor is
actually in the air. The two volumes of air above contain the
same amount of water vapor (3 grams per kilogram) but have different
relative humidities. You could just as easily have two volumes of
air with the same relative humidities but different actual amounts of
water vapor.

The dew point temperature has two jobs. First it gives you an
idea of
the actual amount of water vapor in the air. In this respect it
is just like the mixing ratio. If the dew point temperature is
low the air doesn't contain much water vapor. If it is high the
air contains more water vapor.
Second the dew point tells you how much you must cool the air in order
to cause the RH to increase to 100% (at which point a cloud, or dew or
frost, or fog would form).
If we cool the 70 F air or the 40 F air to 30 F we would
find that the
saturation mixing ratio would decrease to 3 grams/kilogram. Since
the air actually contains 3 g/kg, the RH of the 30 F air would become
100%. The 30 F air would be saturated, it would be filled to
capacity with water vapor. 30 F is the dew point temperature for
70 F air that contains 3 grams of water vapor per kilogram of dry
air. It is also the dew point temperature for 40 F air that
contains 3 grams of water vapor per kilogram of dry air.Because
both volumes of air had the same amount of water vapor,
they both
also have the
same dew point temperature.
Now back to our students and classrooms analogy on the
righthand
side of p. 83. The 4 students
move into classrooms of smaller and smaller capacity. The
decreasing capacity of the classrooms is analogous to the
decrease in saturation mixing ratio that occurs when you cool
air. Eventually the students move into a classroom that they just
fill to capacity. This
is analogous to cooling the air to the dew point.
If the 4 students were to move to an even smaller classroom, they
wouldn't all fit inside. The same is true of moist air. If
you cool moist air below the dew point, some of the water vapor will
condense.


