Wednesday Mar. 25, 2009
click here to download today's notes in a more printer friendly format

Music today was Mrs. Robinson sung by the Lemonheads.

The Optional Assignment on humidity is due at the start of class on Friday.

The revised Expt. #2 reports are due this week.  Please turn in the original report with your revised report.
The Expt. #3 reports are due next Monday.  Try to bring back your materials this week so that you can pick up the Supplementary Information sheet.


My favorite television show, Survivor, was preempted last week by the NCAA Basketball Tournament (that's OK, I'm willing do without Survivor as long as the UA basketball team keeps winning).

Survivor is back on this week, not in its usual Thursday night time slot, but on Wednesday night instead, tonight!

To celebrate I thought something like a Survivor auction might be appropriate in class today.  In a Survivor auction, contestants are given some money and allowed to bid on several items.  The only problem is they don't really know what they are bidding for.  Sometimes they win something good like a cheeseburger with fries other times they might win a plate full of grubs.

In class today several students were able to win prizes by correctly answering questions.


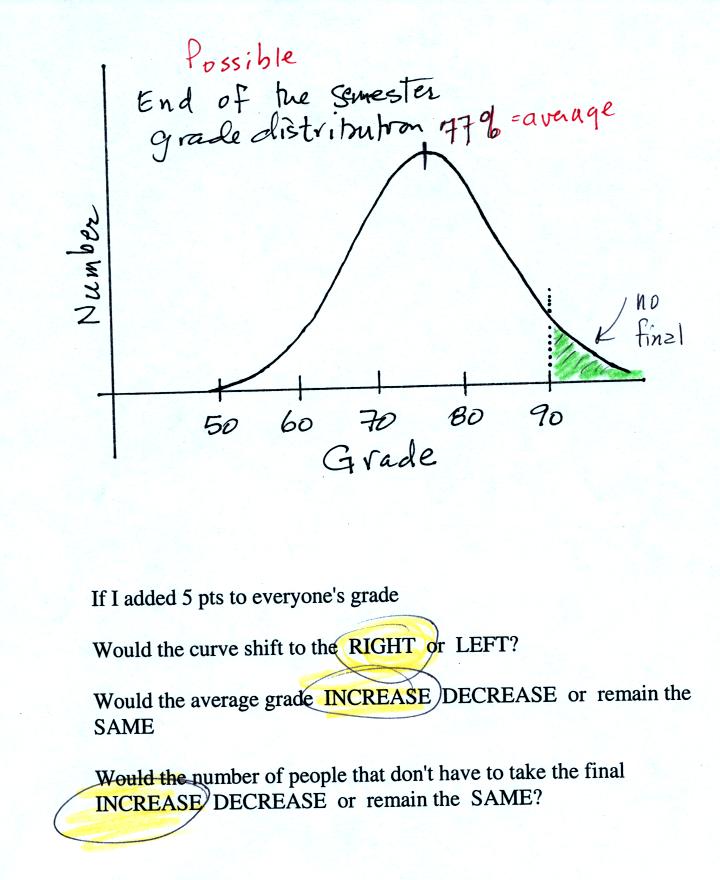
The graph shows a reasonable distribution of end-of-semester grades.  The average appears to be about 77%.  Students with grades equal to or greater than 90.0% are exempt from the final.  A student in the class was asked the three questions at the bottom of 
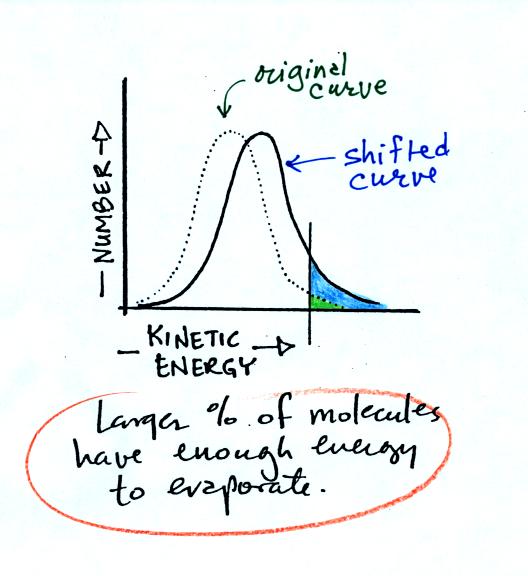
the figure.  If 5 pts were added to everyone's overall grade, the curve and the average grade would both shift to the right.  This rightward shift would increase the number of students that wouldn't have to take the final exam. 


This is the shifted curve.

The next question was very similar.  Instead of grades, the figure below shows the distribution of the kinetic energies of water molecules in a glass of water.  There's an average and some of the water molecules (the ones at the far right end of the curve) have enough kinetic energy that they can evaporate (similar to students that are exempt from the final exam).


A student was asked three questions about this kinetic energy distribution graph.  If the water were heated, would the curve shift to the right or the left.  Would the average kinetic energy move to the right or left.  Would the number of water molecules, with enough kinetic energy to be able to evaporate, increase, decrease, or remain the same?  The student's three correct answers are shown above.  The shifted curve is shown below  


Now what we have been able to understand is that warm water evaporates more rapidly than cold water.  This is summarized om p. 84 in the photocopied ClassNotes.


And now a completely different type of question.  The situation is shown below.


It was basically a question about how many people would have to be inside the Walmart in order for the rates at which people enter (10 people per minute) and at which people leave (10% of the people inside leave every minute) to equal.  Once this balance is reached the number of people inside the store will remain constant.

The student answered the question correctly (the details are shown below). 


The Walmart problem is very similar to saturation of air with water vapor which is shown on p. 85 in the photocopied ClassNotes.  What does it mean to say that air is saturated with water vapor.  Why does the saturation amount depend on temperature?


The evaporating water in Picture 1 is analogous to people entering a Walmart store.  The amount of water vapor in the air in the covered glass will begin to increase.  Some fraction of the water vapor molecules will condense (even though it has just evaporated).  The water vapor concentration will build until the rate of condensation balances evaporation.  The air is saturated at that point.  The water vapor concentration won't increase further.  Saturated air has a relative humidity (RH) of 100%. 

Cups filled with cold and warm water are shown at the bottom of the figure.  Because of different rates of evaporation (slow in cold, rapid in warm water) the water vapor concentrations at saturation are different.  Cold saturated air won't contain as much water vapor as warm saturated air.


Now we can start to use what we have learned about humidity variables (what they tell you about the air and what causes them to change value) to learn some new things.  The figure below is on p. 87 in the photocopied ClassNotes.  The figure was redrawn after class.


At Point 1 we start with some 90 F air with a relative humidity of 25%, fairly dry air (these data are the same as in Problem #4 on Monday).  Point 2 shows the air being cooled to the dew point, that is where the relative humidity would reach 100% and a cloud would form.    Then the air is cooled below the dew point, to 30 F.  Point 3 shows the 30 F air can't hold the 7.5 g/kg of water vapor that was originally found in the air.  The excess moisture must condense (we will assume it falls out of the air as rain or snow).  When air reaches 30 F it contains 3 g/kg, less than half the moisture that it originally did (7.5 g/kg).  Next, Point 4, the 30 F air is warmed back to 90 F, the starting temperature, Point 5.  The air now has a RH of only 10%.

Drying moist air is like wringing moisture from a wet sponge.  The following figure wasn't shown in class.


You start to squeeze the sponge and nothing happens at first (that's like cooling the air, the mixing ratio stays constant as long as the air doesn't lose any water vapor).  Eventually water will start to drop from the sponge (with air this is what happens when you reach the dew point and continue to cool the air below the dew point).  Then you let go of the sponge and let it expand back to its orignal shape and size (the air warms back to its original temperature).  The sponge (and the air) will be drier than when you started.

This sort of process ("squeezing" water vapor out of moist air by cooling the air below its dew point) happens all the time.  Here are a couple of examples (p. 87 again)


In the winter cold air is brought inside your house or apartment and warmed.  Imagine 30 F air with a RH of 100% (this is a best case scenario, the cold winter air usually has a lower dew point and is drier). Bringing the air inside and warming it will cause the RH to drop from 100% to 20%..  Air indoors during the winter is often very dry.

The air in an airplane comes from outside the plane.  The air outside the plane can be very cold (-60 F perhaps) and contains very little water vapor (even if the -60 F air is saturated it would contain essentially no water vapor).  When brought inside and  warmed to a comfortable temperature, the RH of the air in the plane will be very close 0%.  Passengers often complain of becoming dehydrated on long airplane flights.  The plane's ventilation system probably adds moisture to the air so that it doesn't get that dry.

Here's a very important example, the rain shadow effect (the figure, p. 88 in the ClassNotes, was redrawn after class for clarity).


We start with some moist but unsaturated air (RH is about 50%) at Point 1.  As it is moving toward the right the air runs into a mountain and starts to rise (see the note below).  Unsaturated air cools 10 C for every kilometer of altitude gain.  This is known as the dry adiabatic lapse rate.  So in rising 1 km the air will cool to 10 C which is the dew point.

The air becomes saturated at Point 2, you would see a cloud appear.  Rising saturated air cools at a slower rate than unsaturated air (condensation of water vapor releases latent heat energy, this warming partly offsets the cooling caused by expansion).  We'll use a value of 6 C/km (an average value).  The air cools from 10 C to 4 C in next kilometer up to the top of the mountain.  Because the air is being cooled below its dew point at Point 3, some of the water vapor will condense and fall to the ground as rain. 

At Point 4 the air starts back down the right side of the mountain.  Sinking air is compressed and warms.  As soon as the air starts to sink and warm, the relative humidity drops below 100% and the cloud evaporates.  The sinking air will warm at the 10 C/km rate. 

At Point 5 the air ends up warmer (24 C vs 20 C) and drier (Td = 4 C vs Td = 10 C) than when it started out.  The downwind side of the mountain is referred to as a "rain shadow" because rain is less likely there than on the upwind side of the mountain.  Rain is less likely because the air is sinking and because the air on the downwind side is drier than it was on the upslope side.

Most of the year the air that arrives in Arizona comes from the Pacific Ocean.  It usually isn't very moist by the time it reaches Arizona because it has travelled up and over the Sierra Nevada mountains in California and the Sierra Madre mountains further south in Mexico.  The air loses much of its moisture on the western slopes of those mountains.


Next in our potpourri of topics today was measuring humidity.  One of the ways of measuring humidity is to use a sling (swing might be more descriptive) psychrometer.


A sling psychrometer consists of two thermometers mounted side by side.  One is an ordinary thermometer, the other is covered with a wet piece of cloth.  To make a humidity measurement you swing the psychrometer around for a minute or two and then read the temperatures from the two thermometers.  The dry - wet thermometer (dry and wet bulb) temperature difference can be used to determine relative humidity and dew point. 

The figure at upper left shows what will happen as you start to swing the wet bulb thermometer.  Water will begin to evaporate from the wet piece of cloth.  The amount or rate of evaporation will depend on the water temperature (the 80 F value was just made up in this example).  Warm water evaporates at a higher rate than cool water.

The evaporation is shown as blue arrows because this will cool the thermometer.  The same thing would happen if you were to step out of a swimming pool on a warm dry day, you would feel cold.  Swamp coolers would work well on a day like this.

The figure at upper left also shows one arrow of condensation.  The amount or rate of condensation depends on how much water vapor is in the air surrounding the thermometer.  In this case (low relative humidity) there isn't much water vapor.  The condensation arrow is orange because the condensation will release latent heat and warm the thermometer.

Because there is more evaporation (4 arrows) than condensation (1 arrow) the wet bulb thermometer will drop. 

The wet thermometer will cool but it won't cool indefinitely.  We imagine that the wet bulb thermometer has cooled to 60 F.  Because the wet piece of cloth is cooler, there is less evaporation.  The wet bulb thermometer has cooled to a temperature where the evaporation and condensation are in balance.  The thermometer won't cool any further.

You would measure a large difference (20 F) between the dry and wet bulb thermometers on a day like this when the air is relatively dry.

The air temperature is the same in this example, but there is more water vapor in the air.  You wouldn't feel as cold if you stepped out of a pool on a warm humid day like this.  Swamp coolers wouldn't provide much cooling on a day like this.

There are four arrows of evaporation (because the water temperature is still 80 F just as it was in the previous example) and three arrows now of condensation (due to the increased amount of water vapor in the air surrounding the thermometer).  The wet bulb thermometer will cool but won't get as cold as in the previous example. 

The wet bulb thermometer might well only cool to 75 F.  This might be enough to lower the rate of evaporation (from 4 arrows to 3 arrows) enough to bring it into balance with the rate of condensation.

You would measure a small difference (5 F) between the dry and wet bulb thermometers on a humid day like this.


There won't be any difference in the dry and wet bulb temperatures when the RH=100%.  The rates at which water is evaporating and water vapor is condensing are equal.  That's one of the things that happens when air is saturated.  The dry and wet bulb thermometers would both read 80 F.


The last thing we covered was the formation of dew, frost, and something called frozen dew.  The figures below were redrawn after class to make them clearer.

It might be a little hard to figure out what is being illustrated here.  Point 1 is sometime in the early evening when the temperature of the air at ground level is 65.  By the next morning the air has cooled to 35 F.  When the air temperature reaches 40 F, the dew point, the relative humidity reaches 100% and water vapor begins to condense onto the ground.  You would find your newspaper and your car covered with dew the next morning.

The next night is similar except that the nighttime minimum temperature drops below freezing.  Dew forms and first covers everything on the ground with water.  Then the water freezes and turns to ice.  This isn't frost, rather frozen dew.  Frozen dew is often thicker and harder to scrape off your car windshield than frost. 

Now the dew point and the nighttime minimum temperature are both below freezing.  When the RH reaches 100% water vapor turns directly to ice (deposition).  This is frost.

What happens on this night?  Because the nighttime minimum temperature never reaches the dew point and the RH never reaches 100%, nothing would happen.