Tue., Jan. 25, 2011
click here to download today's notes in a more printer friendly format

The first homework assignment was handed out in class today.  It will be due next Tuesday, Feb. 1.

We started class by showing how the electric field can be expressed as the gradient of a scalar function called the electrostatic potential.

I'm not enough of a mathematician to be able to explain why the curl of a vector being zero means the vector can be expressed as the gradient of a scalar.  We'll just have to accept that on faith.  We can replace the r over r3 term in the expression for electric field with the gradient of 1/r.

This leads to a definition of the electrostatic potential.  It is often much simpler to determine the electrostatic potential because it is a scalar quantity.  The electric field can then be determined by taking the gradient of the potential. 

The expression above is valid for a point charge.  More general expressions for cases where multiple charges are present or when charge is distributed over a volume or on a surface are shown below.  This figure was not shown in class.


Essentially you can break a more complex charge distribution into smaller pieces and then either sum over a collection of multiple discrete charges, or integrate over volume or surface distributions of charge to determine the electrostatic potential.

We didn't do the last step above in class (substituting in the point charge expression for electric field).  Often the potential at r = infinity would be set to zero. 


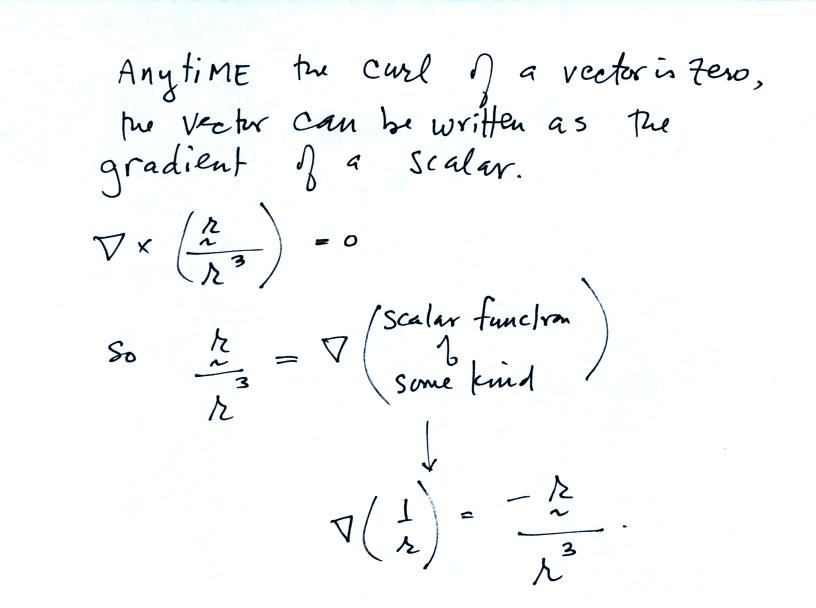
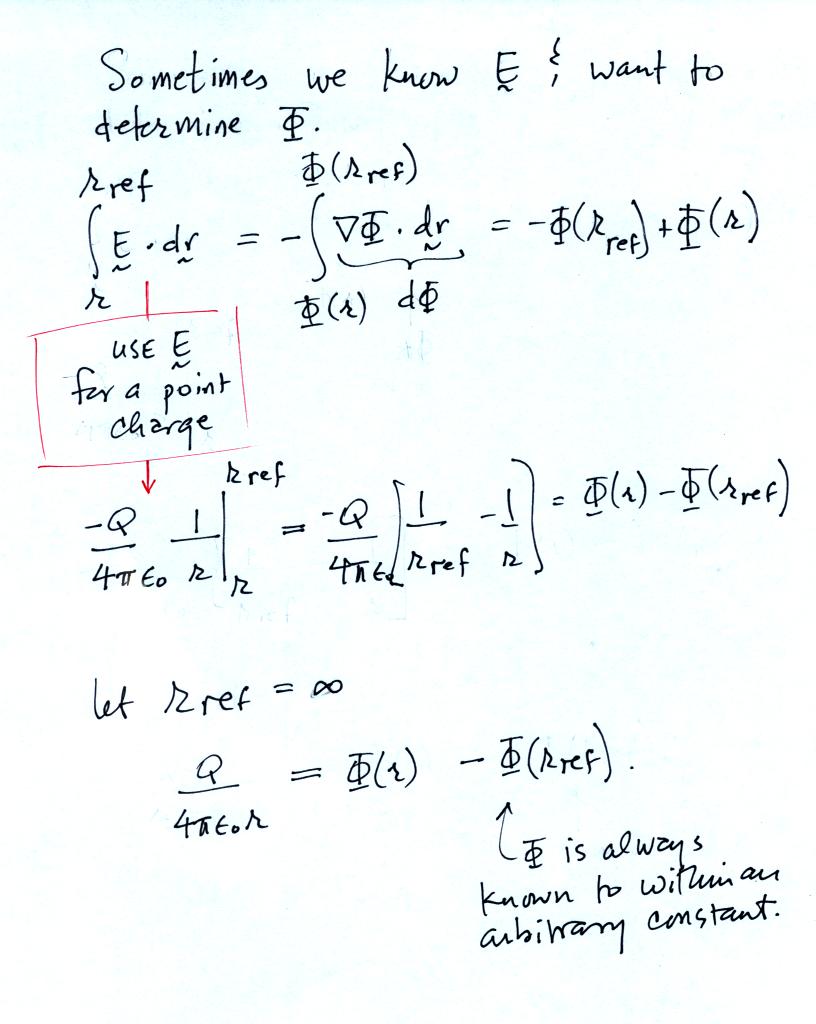
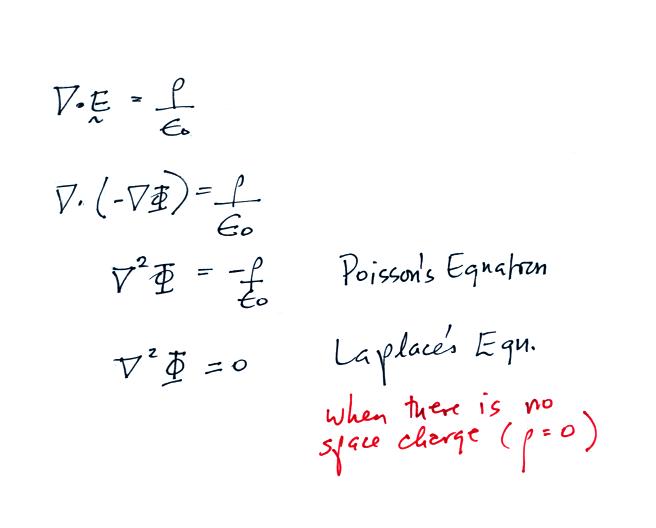
If you write the electric field as the gradient of the electrostatic potential and then substitute that into Gauss' Law you can obtain Poisson's Equation.  Laplace's equation applies in situtations where the volume space charge density is zero.  We'll be using Laplace's equation in class on Thursday.  A handout with vector differential operators in cartesian, cylindrical, and spherical coordinate systems was distributed in class.


We spent the rest of the class looking at a couple of instruments used to measure thunderstorm and lightning electric fields. 

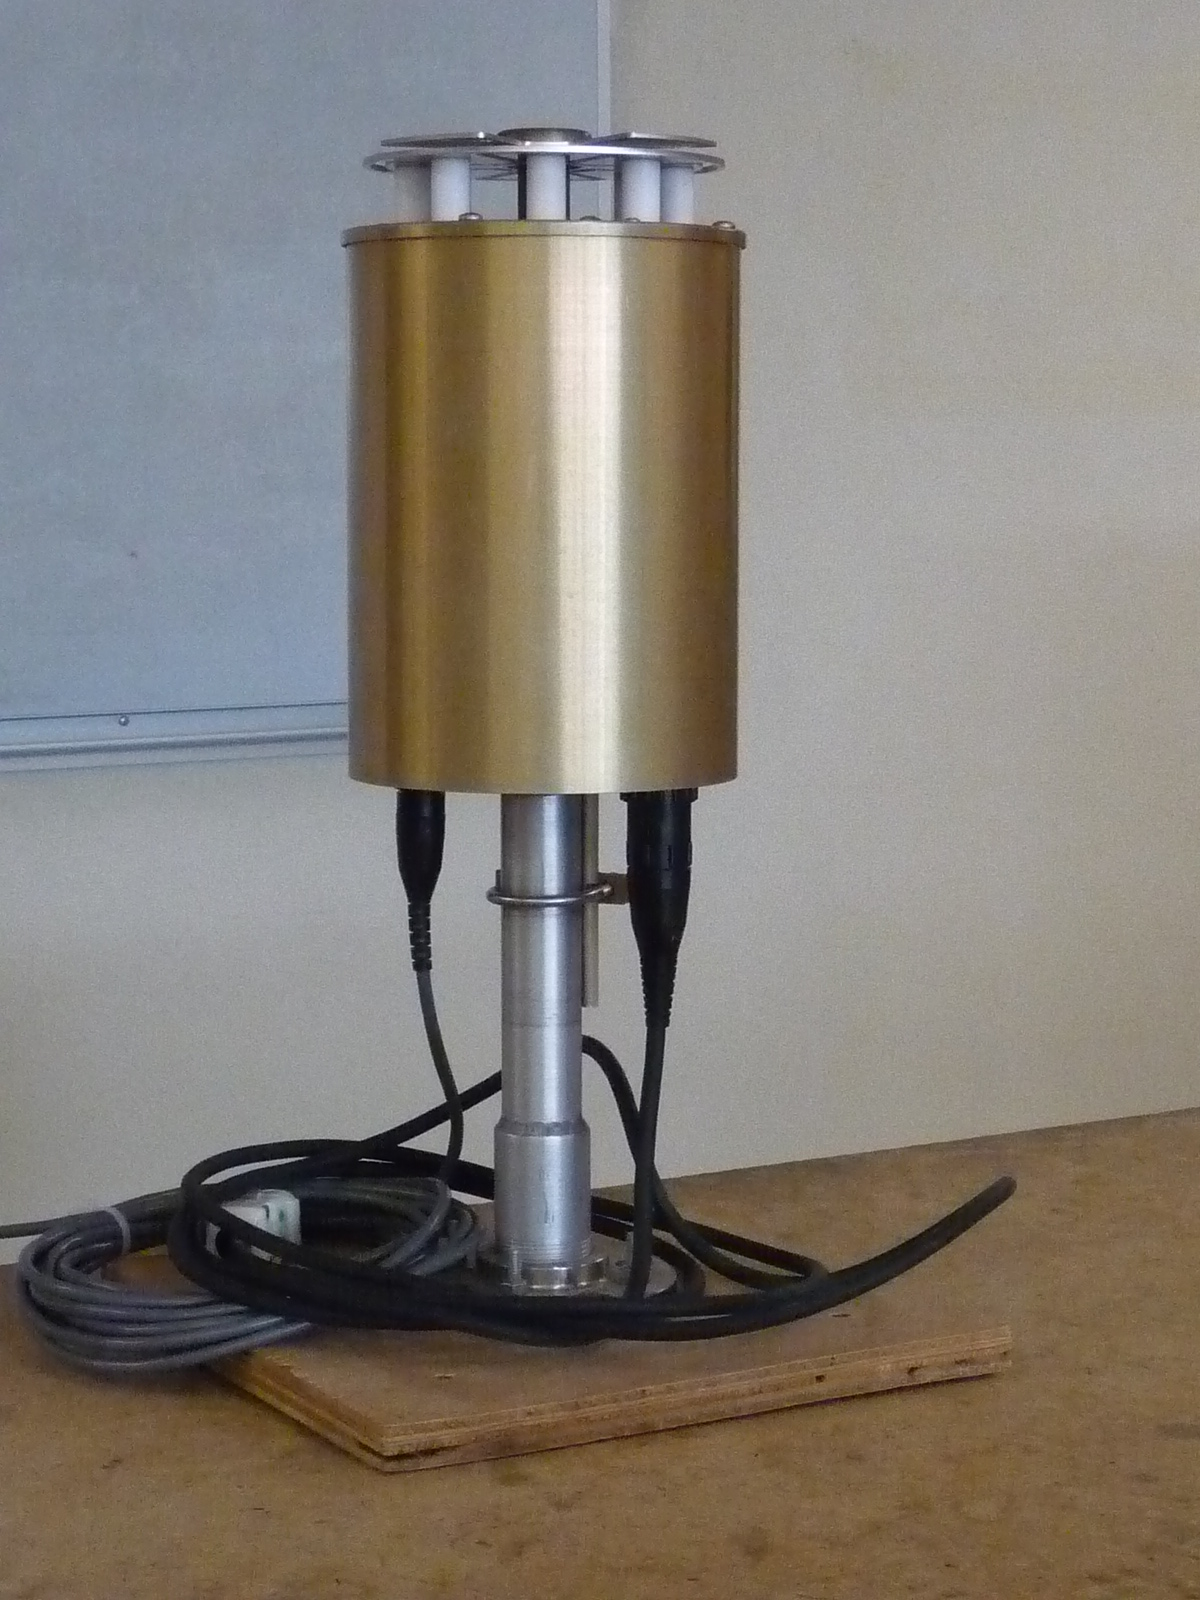
The first is an electric field mill used to measure static and slowly time varying electric fields.  Referring to the figure below at left (from Uman's 1987 The Lightning Discharge book).  The sensors (referred to as studs in the figure) are covered by a rotating grounded plate.  The rotating plate is notched or slotted so that the sensors are periodically exposed to and covered (shielded) 
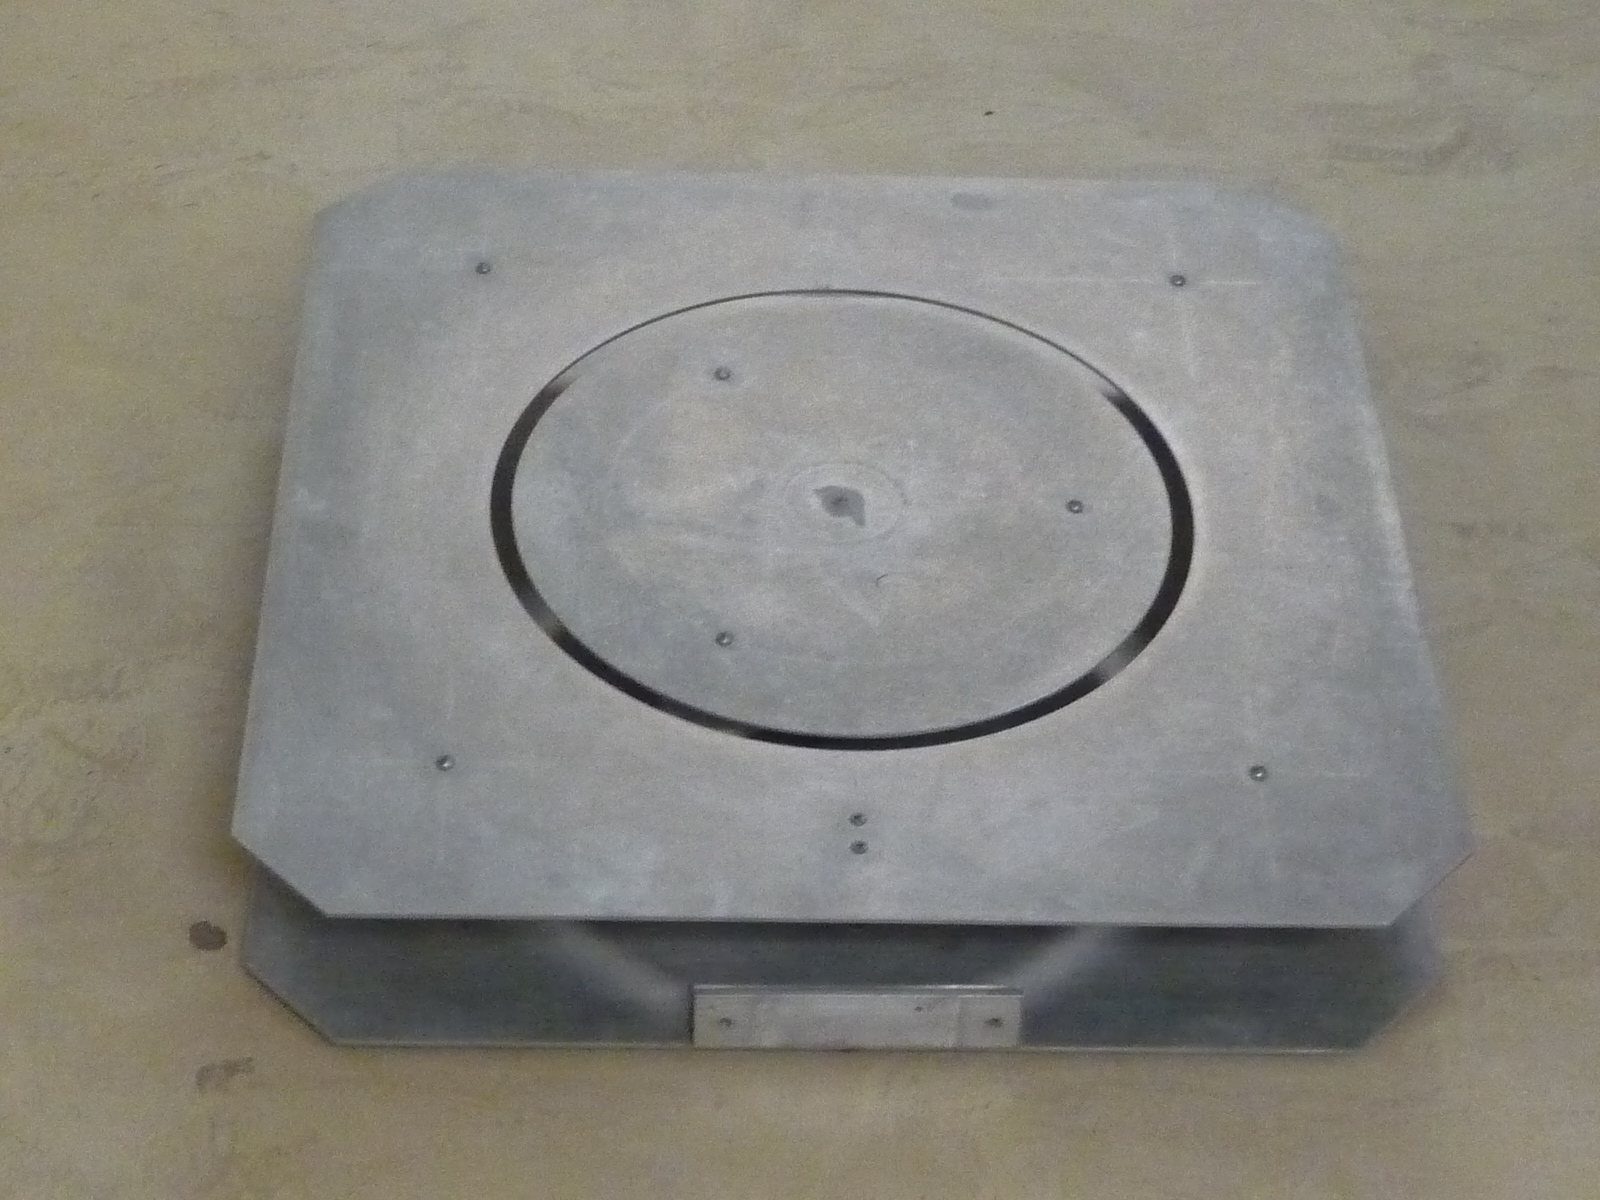
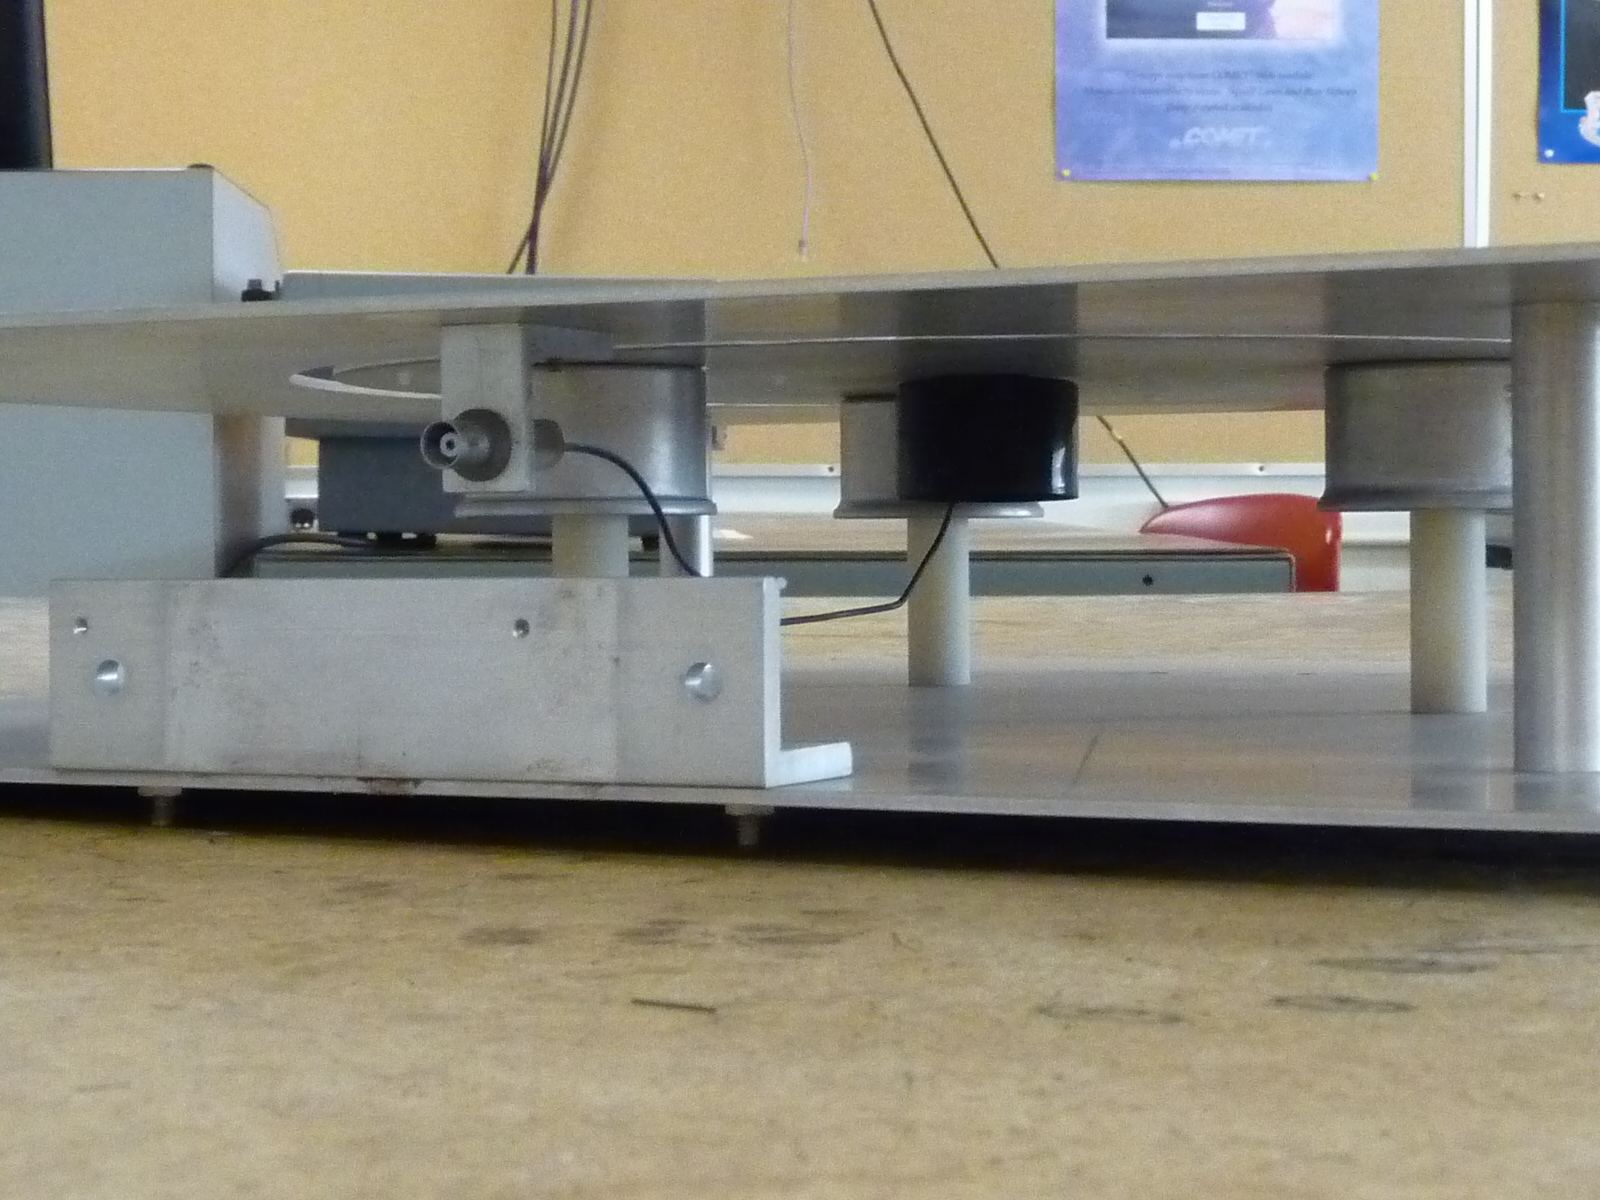
from the ambient electric field.  A photograph of the field mill shown in class is shown below at right.


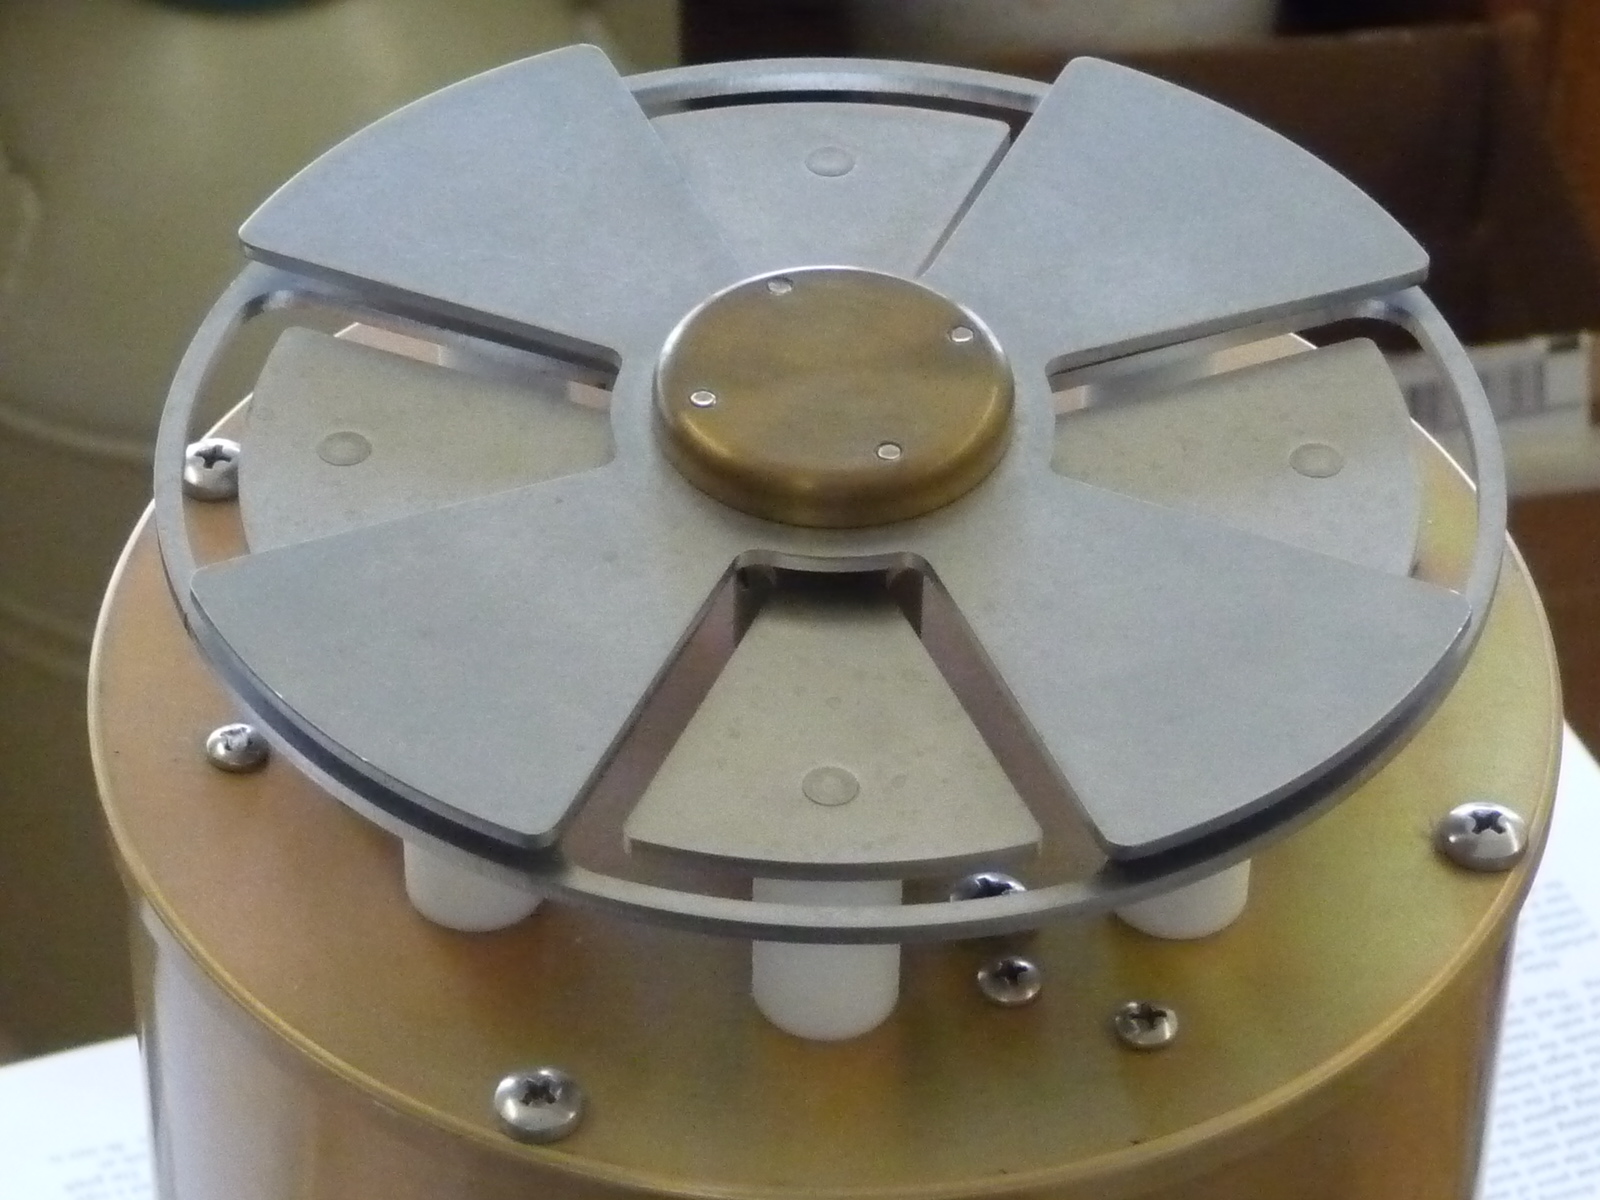
The two photographs below are closeups of the top of the field mill


The stator plates are exposed to the E field at left and covered in the photograph at right.

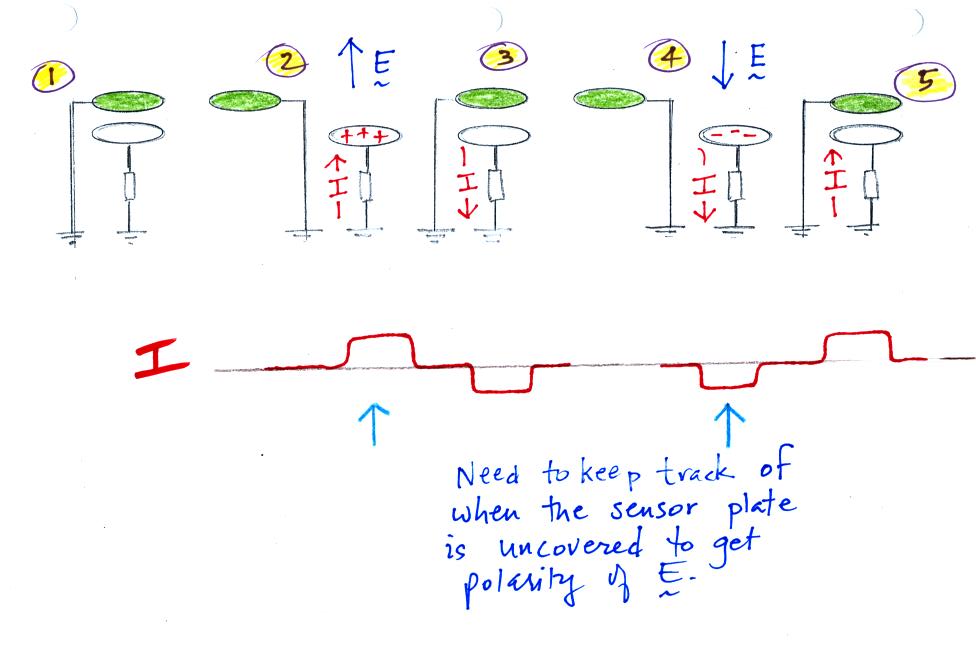
The next figure shows currents flowing into and out of the sensor plate in response to an incident E field.


The sensor plate is covered at Point 1.  At Point 2 the sensor is uncovered and we assume the ambient field points upward (to negative charge in the lower part of a thunderstorm perhaps).  Positive charge flows up to the sensor plate.  The current flows from the sensor in Point 3 because the sensor has been covered and shielded from the E field.  Points 4 and 5 are similar except the polarity of the E field has been changed. 

Note the current signals at Points 2 & 5 even though the field polarities are reversed.  You must keep track of when the sensor is covered and uncovered if you are going to determine the polarity of the incident E field.

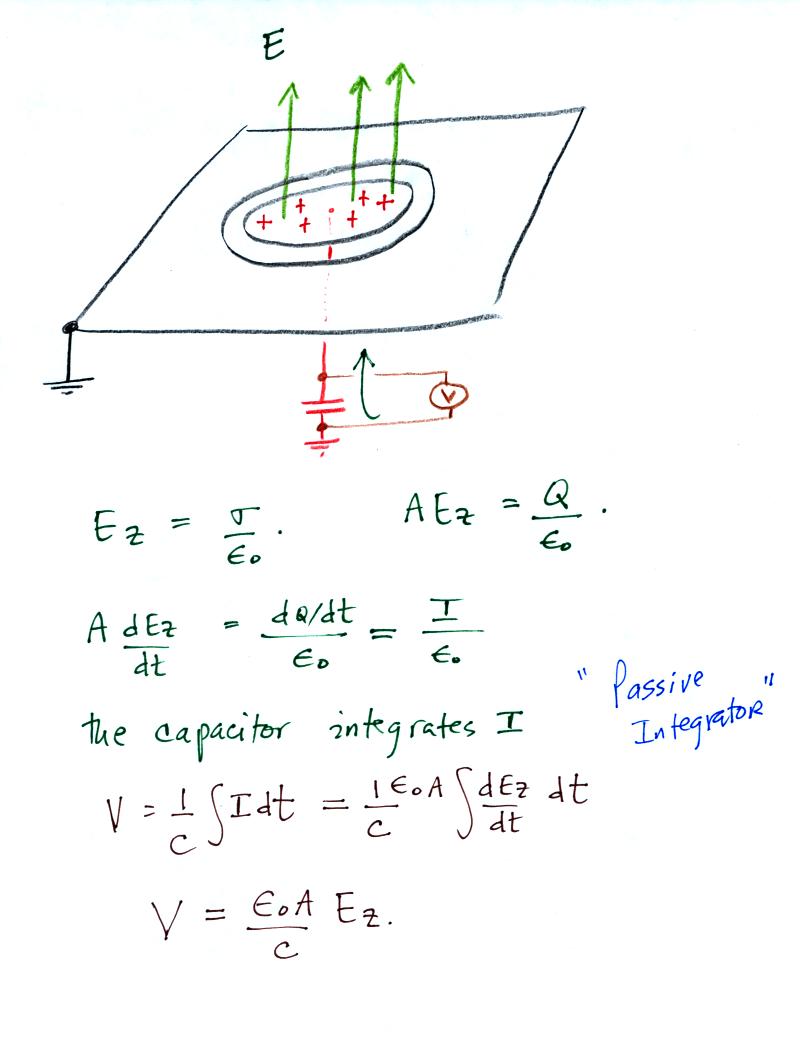
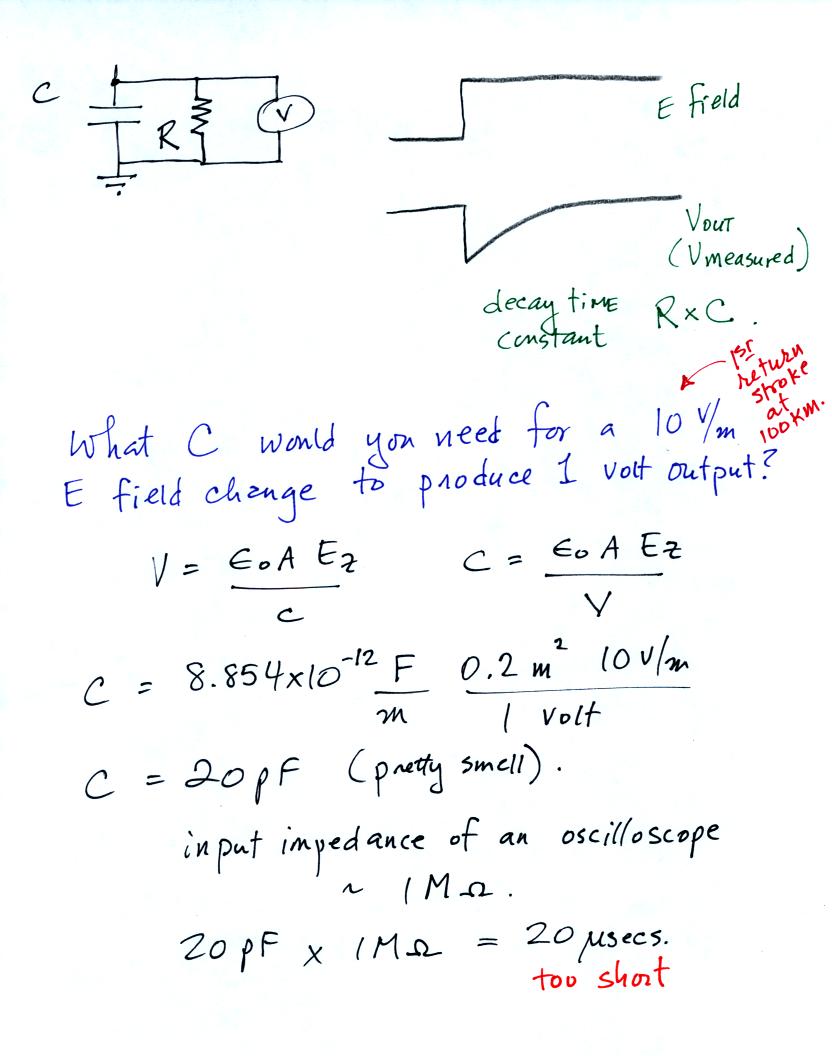
It is a relatively simple matter to relate the amplitude of the signal current to the intensity of the incident E field.

We use the expression derived a few days ago relating the E field at the surface of a conductor and the surface charge density (sigma in the equations above).  A is the area of the sensor.

If you integrate the current (connect the sensor through a capacitor to ground) you obtain an output voltage that is proportional to E.


Next we looked at some typical E field records obtained with an electric field mill.  The data come from the Kennedy Space Center field mill network.

The first record is interesting because it shows the transition from fair to foul weather electric fields (a change in polarity and in field strength).


Note the change from fair weather fields of about 200 V/m to foul weather fields that attains values of about 2500 V/m of the opposite polarity.  The abrupt transitions are caused by lightning.  We'll come back to field records like this and show what we start to learn something about the locations of charge and amounts of charge involved in lightning discharges by analyzing these electric field changes.

Note that the vertical axis is labeled potential gradient rather than electric field.  This brings up a confusing situation regarding electric field polarities that you should be aware of; something that might cause some confusion if you ever read through some of the atmospheric electricity literature.


The figure above at left correctly show the E field pointing downward toward negative charge on the earth's surface during fair weather.  The E field reverses direction under a thunderstorm.  The main negative charge center in the cloud causes positive charge to build up in the ground under the storm.  The E field points upward.

A physicist would consider the fair weather field to be negative polarity because it points downward and would call the stormy weather field positive.  Someone from the atmospheric electricity community might refer to the fair weather field as positive and would call the foul weather field negative.  This is a source of confusion. 

Nowadays atmospheric electricians either just simply use the physics convention or refer to the potential gradient rather than the electric field so that they can preserve the positive polarity for fair weather, negative polarity for stormy weather tradition.


The record above shows field variations over a 20 minute period.  A lightning discharge usually takes place in less than a second and there are lightning processes that occur on a microsecond and submicrosecond time scales.  An electric field mill can't resolve field changes or variations that occur this rapidly. 


We'll won't discuss the various processes that make up a typical cloud to ground lightning discharge at this point (that'll come later in the semester).  And we'll discuss the difference between slow and fast E field antenna systems in class on Thursday.

One way of measuring these faster time varying electric fields is to use a flat plate antenna (aka flush plate dipole antenna).  It basically consists of a large flat grounded plate that would be positioned on the ground (preferably flush with the surrounding ground).  A smaller circular sensor plate is found inside a center hole as shown in the photograph below.


The "insides" of the antenna are shown in the next picture


The center sensor plate is supported by nylon spacers.  The top end of the supports are covered with "rain hats" to try to keep the sides dry during stormy weather.  A wire connection to the center plate connects to a BNC cable to carry the signal to processing and recording equipment.

In some ways the operation of this antenna is similar to the field mill.  In this case E field changes cause current to flow to and from the center sensor plate (you don't need to repeatedly cover and uncover the sensor plate).

This current is proportional to the time derivative of the electric field.  Integrating the current gives an output signal that is proportional to E.

In the circuit above the antenna is connected to a capacitor (this is a passive integrator).  Some kind of measuring device would be connected across the capacitor.

In some cases the input impedance of the measuring device together with a small capacitance in the passive integrator (a small capacitance would provide higher gain) gives a time decay constant that is too short.

This is about as far as we got in class on Tuesday.  We'll come back to this topic briefly at the start of class on Thursday..