This seemed like a reasonable
picture of the day (from the
University
Corporation for Atmospheric Research)
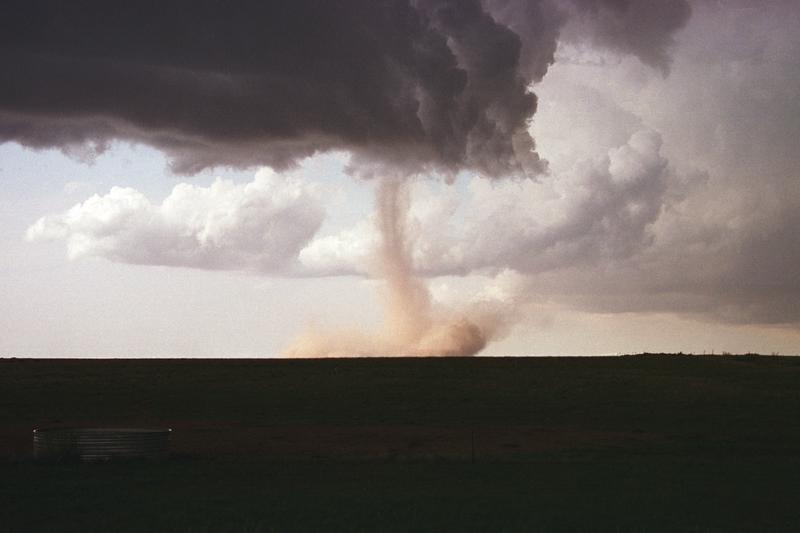
A tornado (probably a relatively weak one) dropping down from the edge of a wall cloud.
A tornado (probably a relatively weak one) dropping down from the edge of a wall cloud.
The
United
States
has more tornadoes in an
average year than
any
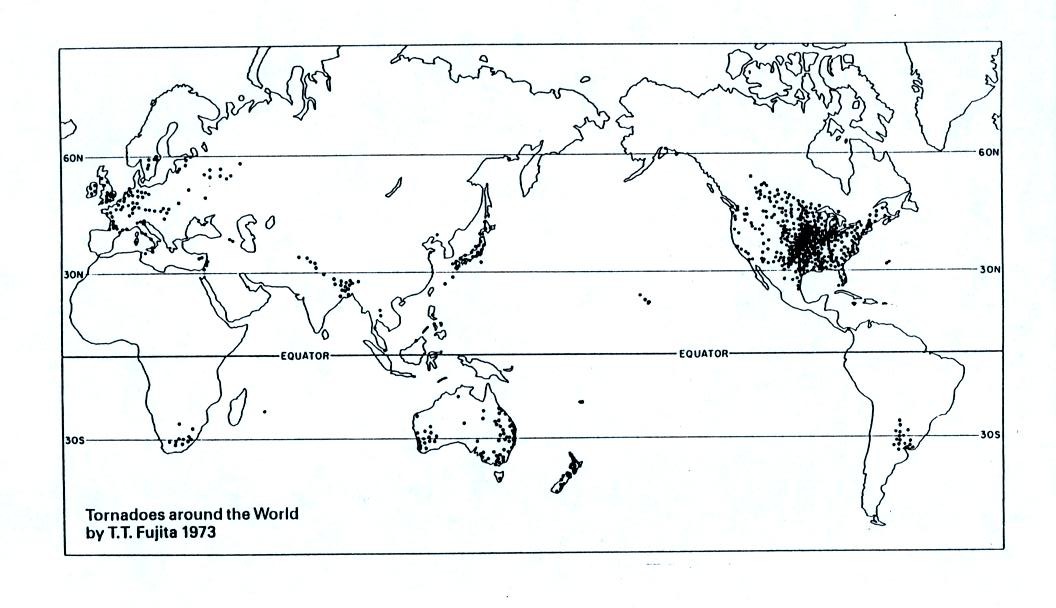
other country in the world (over 1000 per year). The
central
US
has
just
the
right
mix
of
meteorological
conditions.
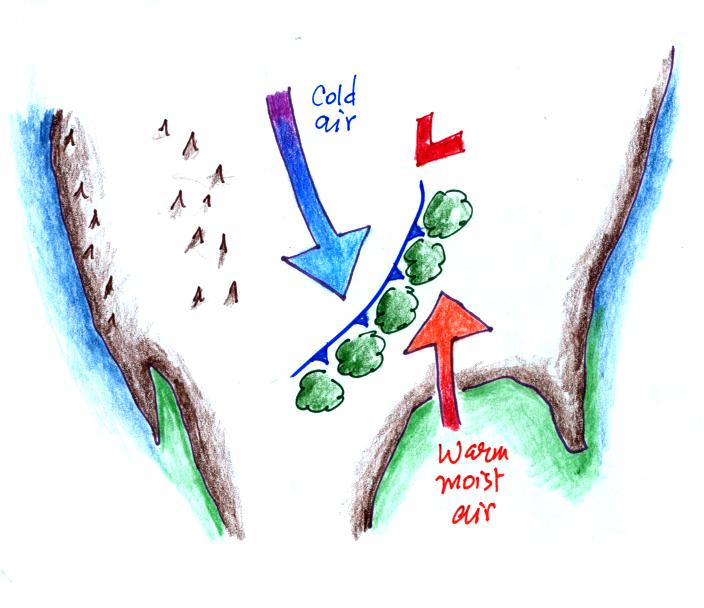
I got a little carried away with
the colored pencils. In the spring, cold
dry
air can move all the way
from
Canada and collide with
warm moist air
from the Gulf of Mexico to form strong cold fronts and thunderstorms.
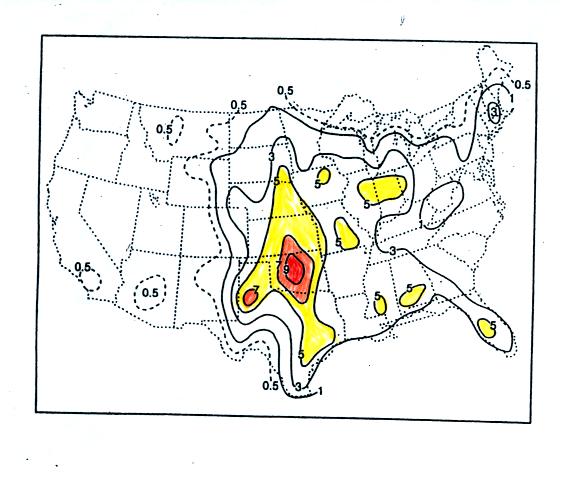
Tornadoes
have been
observed in
every state in the US, but tornadoes are most frequent in the central
plains, a region referred to as "Tornado Alley" (highlighted in red,
orange, and yellow above). You'll
find this map on p. 161 in the photocopied ClassNotes)
Here are some basic
tornado
characteristics.
1. About 2/3rds of tornadoes are F0 or F1 tornadoes (we'll learn moare about the Fujita scale used to rate tornado intensity later today and on Wednesday) and have spinning winds of about 100 MPH or less. Microburst winds can also reach 100 MPH. Microbursts are much more common in Tucson in the summer than tornadoes and can inflict the same level of damage.
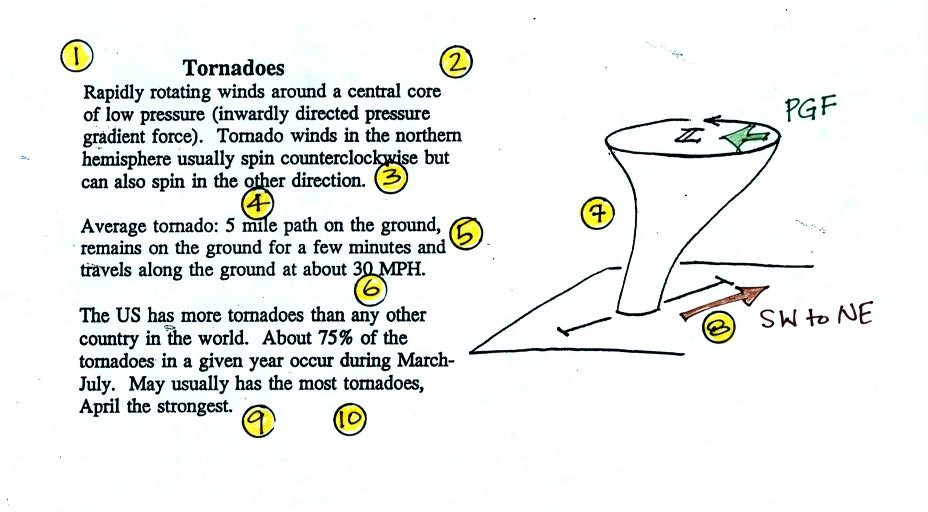
2. A very strong inwardly directed pressure gradient force is needed to keep winds spinning in a circular path. The pressure in the center core of a tornado can be 100 mb less than the pressure in the air outside the tornado. This is a very large pressure difference in such a short distance. The PGF is much stronger than the Coriolis Force (CF) and the CF can be neglected.
3. Tornadoes can spin clockwise or counterclockwise, though counterclockwise rotation is more common.
4, 5, 6. Tornadoes usually last only a few minutes, leave a path on the ground that is a few miles long, and move at a few 10s of MPH. There are exceptions, we'll look at one shortly.
7, 8. Most tornadoes move from the SW toward the NE. This is because tornado-producing thunderstorms are often found just ahead of a cold front. Winds ahead of a cold front often blow from the SW. Most tornadoes have diameters of tens to a few hundred yards but tornadoes with diameters over a mile have been observed.
9, 10. Tornadoes are most frequent in the Spring. The strongest tornadoes also occur at that time of year. Tornadoes are most common in the late afternoon when the atmosphere is most unstable.
1. About 2/3rds of tornadoes are F0 or F1 tornadoes (we'll learn moare about the Fujita scale used to rate tornado intensity later today and on Wednesday) and have spinning winds of about 100 MPH or less. Microburst winds can also reach 100 MPH. Microbursts are much more common in Tucson in the summer than tornadoes and can inflict the same level of damage.
2. A very strong inwardly directed pressure gradient force is needed to keep winds spinning in a circular path. The pressure in the center core of a tornado can be 100 mb less than the pressure in the air outside the tornado. This is a very large pressure difference in such a short distance. The PGF is much stronger than the Coriolis Force (CF) and the CF can be neglected.
3. Tornadoes can spin clockwise or counterclockwise, though counterclockwise rotation is more common.
4, 5, 6. Tornadoes usually last only a few minutes, leave a path on the ground that is a few miles long, and move at a few 10s of MPH. There are exceptions, we'll look at one shortly.
7, 8. Most tornadoes move from the SW toward the NE. This is because tornado-producing thunderstorms are often found just ahead of a cold front. Winds ahead of a cold front often blow from the SW. Most tornadoes have diameters of tens to a few hundred yards but tornadoes with diameters over a mile have been observed.
9, 10. Tornadoes are most frequent in the Spring. The strongest tornadoes also occur at that time of year. Tornadoes are most common in the late afternoon when the atmosphere is most unstable.
The figure traces out
the path of the 1925 "Tri-State
Tornado" . The
tornado path (note the SW to NE orientation) was 219 miles long, the
tornado lasted about 3.5 hours and
killed 695 people. The tornado was traveling over 60 MPH over
much of its path. It is the deadliest single tornado ever in the United
States.
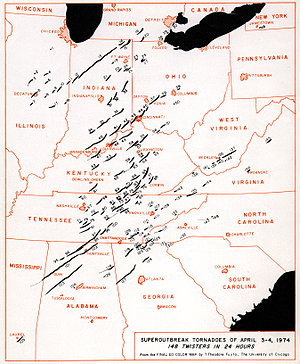
Tornadoes often occur
in
"outbreaks."
The paths of 148
tornadoes
during the April 3-4, 1974 "Jumbo Tornado
Outbreak" are shown above. Note the first tornadoes were
located
in the upper left corner of the map. The tornadoes were produced
by thunderstorms forming along a cold front (see the weather map
below). During this two day
period the front moved from the NW part toward the SE part of the
figure.
Note
that all the tornado paths have a
SE toward NE
orientation.
Tornadoes the past several days qualify as an outbreak. According to this source, 50 confirmed tornadoes (the total will probably exceed 200) have killed at least 38 people. North Carolina seems to have been particularly hard hit (here is a link with lots of photographs from the Charlotte Observer newspaper).
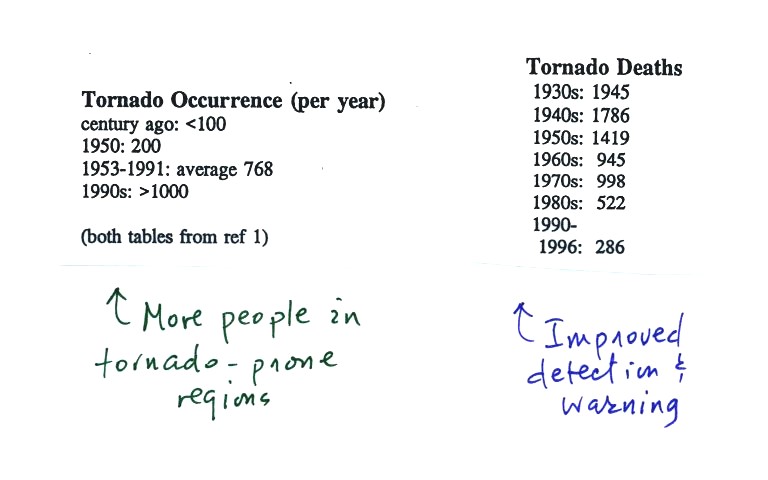
The two tables above are on p. 161
in the photocopied
ClassNotes. At the present time about 75 people
are
killed
every year in the
United States. This is about a factor of ten less than a century
ago due to improved methods of detecting tornadoes and severe
thunderstorms. Modern day communications also make easier to warm
people of dangerous weather situations. Lightning and flash
floods (floods are the most
serious
severe weather hazard) kill slightly more people. Hurricanes kill
fewer people on average than tornadoes.
We watched a short segment of video from Tornado Video Classics vol. 1 (see the summary below)
The second column above is the Fujita scale rating of each tornado. That provides an idea of the intensity of the tornado.
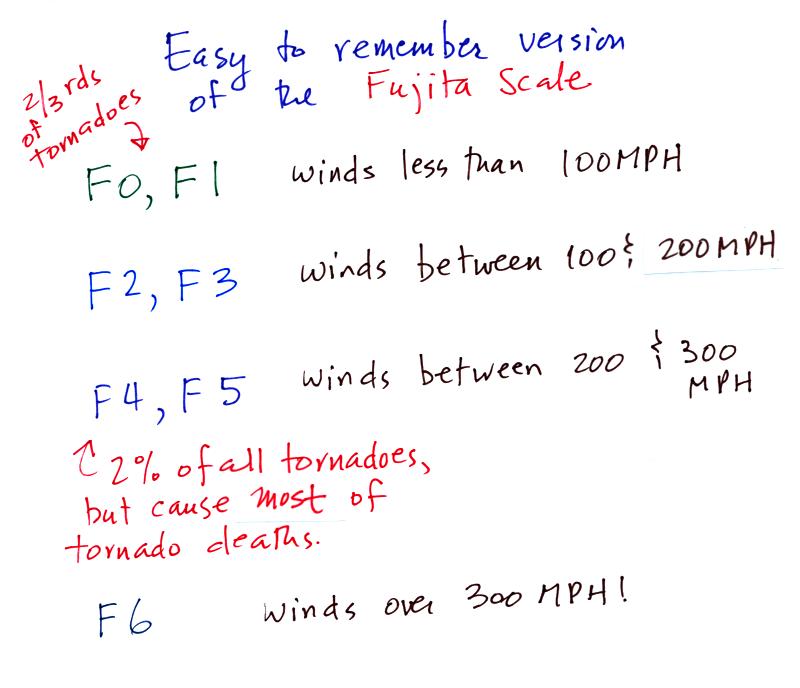
Here's an easy to
remember version of the Fujita Scale used
to rate tornado strength and damage
potential. It is very hard to actually measure the speed of the
rotating winds in a tornado. Researchers usually survey the
damage caused by the tornado to come up with a Fujita Scale
rating. The Fujita Scale has recently been revised. The
newer scale is called the Enhanced
Fujita Scale to differentiate it from the original scale introduced
in 1971.
We watched a short segment of video from Tornado Video Classics vol. 1 (see the summary below)
| 54a |
F3 |
Grand
Island, NE |
Mar.
13,
1990 |
tornado
cloud is pretty
thick and vertical |
| 61f |
F3 |
McConnell
AFB KS |
Apr.
26,
1991 |
this
is about as close to a
tornado as you're ever likely to get. Try to judge the diameter
of the tornado cloud. What direction are the tornado winds
spinning? |
| 52 |
F5 |
Hesston
KS |
Mar.
13,
1990 |
Watch
closely,
you may see a tree or two uprooted by the tornado winds |
| 51 |
F3 |
North
Platte NE |
Jun.
25,
1989 |
Trees
uprooted
and buildings lifted by the tornado winds |
| 65 |
F1 |
Brainard
MN |
Jul.
5,
1991 |
It's
a good
thing this was only an F1 tornado |
| 57 |
F2 |
Darlington
IN |
Jun.
1,
1990 |
Tornado
cloud
without much dust |
| 62b |
F2 |
Kansas
Turnpike |
Apr.
26,
1991 |
It's
sometimes
hard to run away from a tornado. Watch closely you'll see a van
blown off the road and rolled by the tornado. The driver of the
van was killed! |
| 47 |
F2 |
Minneapolis
MN |
Jul.
18,
1986 |
Tornado cloud appears and disappears. |
The second column above is the Fujita scale rating of each tornado. That provides an idea of the intensity of the tornado.
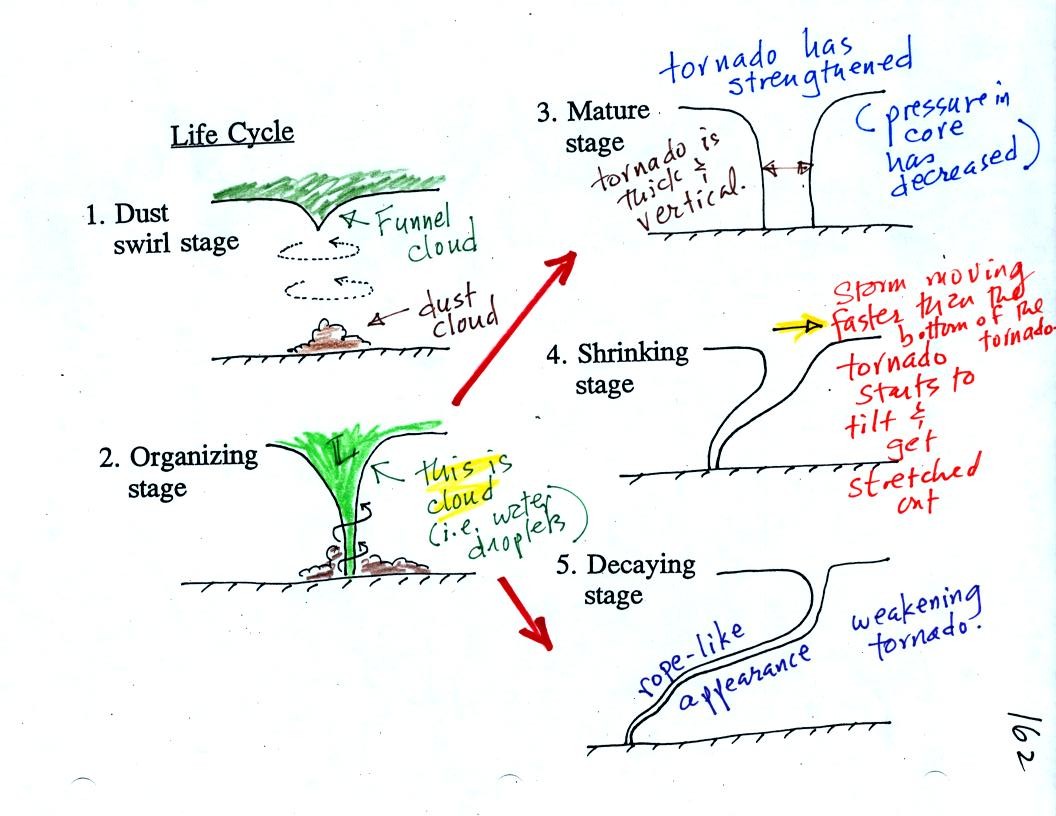
Tornadoes begin in and descend from
a
thunderstorm. You would usually see a funnel cloud dropping from
the base
of the thunderstorm. Spinning winds will probably be present
between the cloud and ground before the tornado cloud becomes
visible. The spinning winds can stir up dust at ground
level. The spinning winds might also be strong enough at this
point to produce some minor damage. We saw an example of this in
a video tape of a tornado
in
Laverne
Oklahoma.
In Stage 2, moist air moves horizontally toward the low pressure in the core of the tornado. This sideways moving air will expand and cool just as rising air does (see figure below). Once the air cools enough (to the dew point temperature) a cloud will form.
Tornadoes can go from Stage 2 to Stage 3 (this is what the strongest tornadoes do) or directly from stage 2 to stage 5. Note a strong tornado is usually vertical and thick as shown in Stage 3. "Wedge tornadoes" actually appear wider than they are tall.
The thunderstorm and the top of the tornado will move faster than the surface winds and the bottom of the tornado. This will tilt and stretch the tornado. The rope like appearance in Stage 5 is usually a sign of a weakening (though still a dangerous) tornado.
The tornado cloud forms when moist
air moves into lower
pressure
in the core of the tornado. The air expands and cools to the dew
point and a cloud forms. This is just like the cloud that forms
when air rises (and moves into lower pressure and expands).
This
seemed like a good place to briefly discuss supercell thunderstorms.
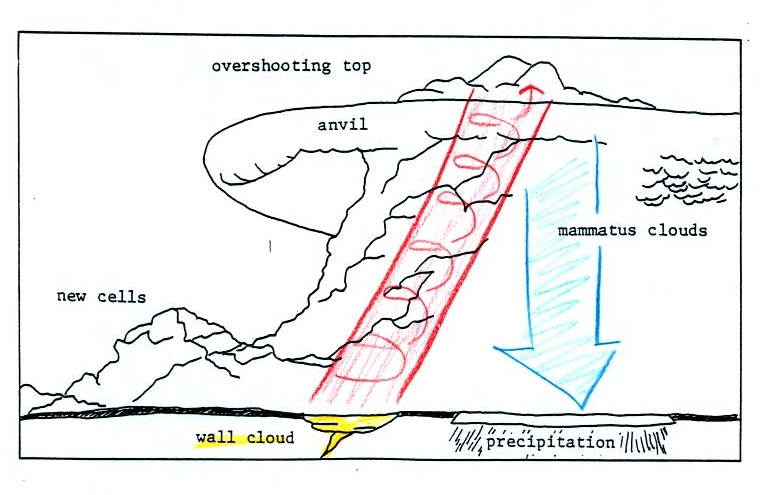
Here is a relatively simple drawing showing some of the key features on a supercell thunderstorm. In a supercell the rotating updraft (shown in red above) is strong enough to penetrate into the stratosphere. This produces the overshooting top or dome feature above. A wall cloud and a tornado are shown at the bottom of the mesocyclone. In an ordinary thunderstorm the updraft is unable to penetrate into the very stable air in the stratosphere and the upward moving air just flattens out and forms an anvil. The flanking line is a line of new cells trying to form alongside the supercell thunderstorm.
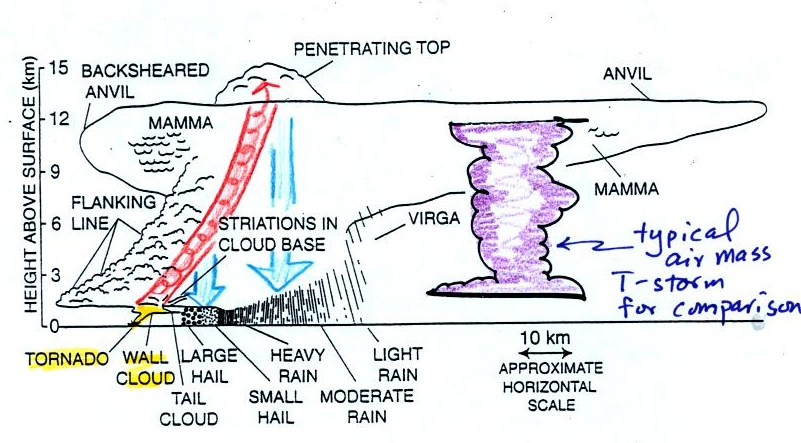
Here is a second slightly more complicated drawing of a supercell thunderstorm. A typical air mass thunderstorm (purple) has been drawn in for comparison.
A short segment of video was shown at this point. The video first showed some good quality video of a close tornado. This was followed by photographs of a distant supercell thunderstorm and photographs of the bases of nearby supercell thunderstorms. Here you could see the spectacular wall cloud that often forms at the base of these storms. Finally a computer simluation showed some of the complex motions that form inside supercell thunderstorms, particularly the tilted rotating updraft.
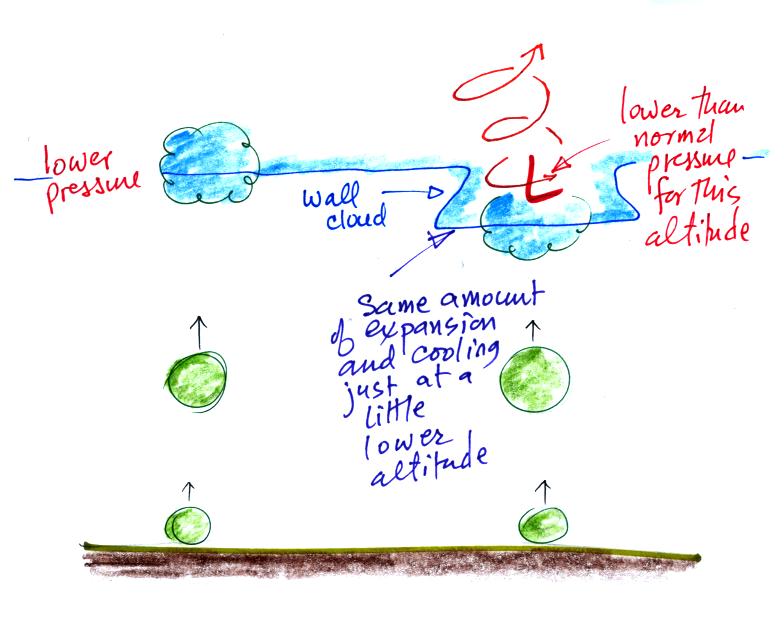
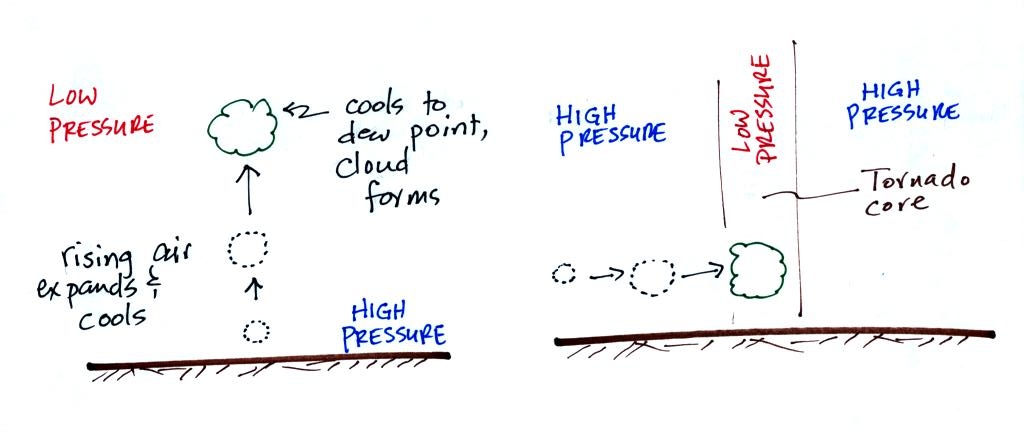
A wall cloud can form a little bit
below the rest of the base of the thunderstorm. The figure (shown but not really
discussed in class) above
tries to explain why that is true. Clouds normally form when air
rises, expands, and cools as shown above at left. The rising air
expands because it is moving into lower pressure surroundings at higher
altitude.
At right the air doesn't have to rise to as high an altitude to experience the same amount of expansion and cooling. This is because it is moving into the core of the rotating updraft where the pressure is a little lower than normal for this altitude. Cloud forms a little bit closer to the ground.
At right the air doesn't have to rise to as high an altitude to experience the same amount of expansion and cooling. This is because it is moving into the core of the rotating updraft where the pressure is a little lower than normal for this altitude. Cloud forms a little bit closer to the ground.