This
picture
gets a
little
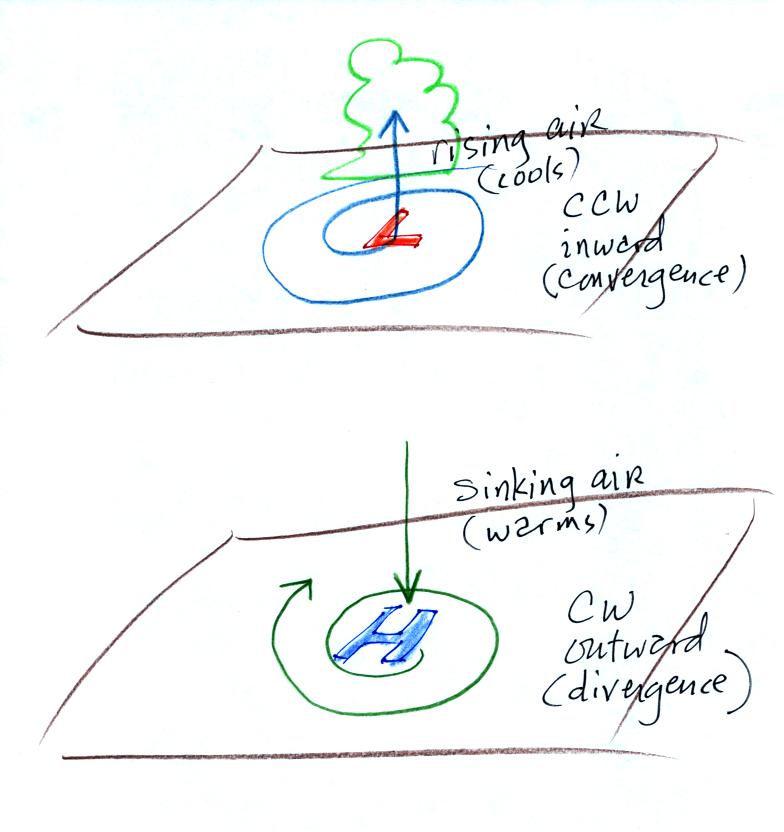
more interesting if you put centers of high or low pressure in the
middle.
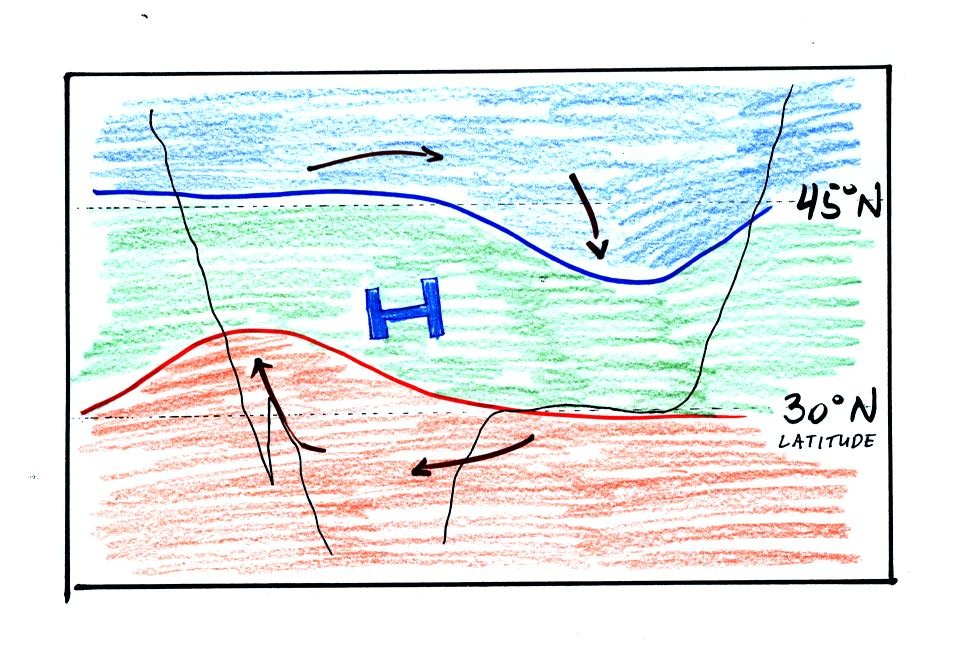
The clockwise spinning winds
move warm air to
the north on
the western
side of the High. Cold air moves toward the south on the eastern
side of the High. The diverging winds also move the warm and cold
air away from the center of the High.
Counterclockwise winds move cold
air toward the south
on the
west side
of the Low. Warm air advances toward the north on the eastern
side of the low.
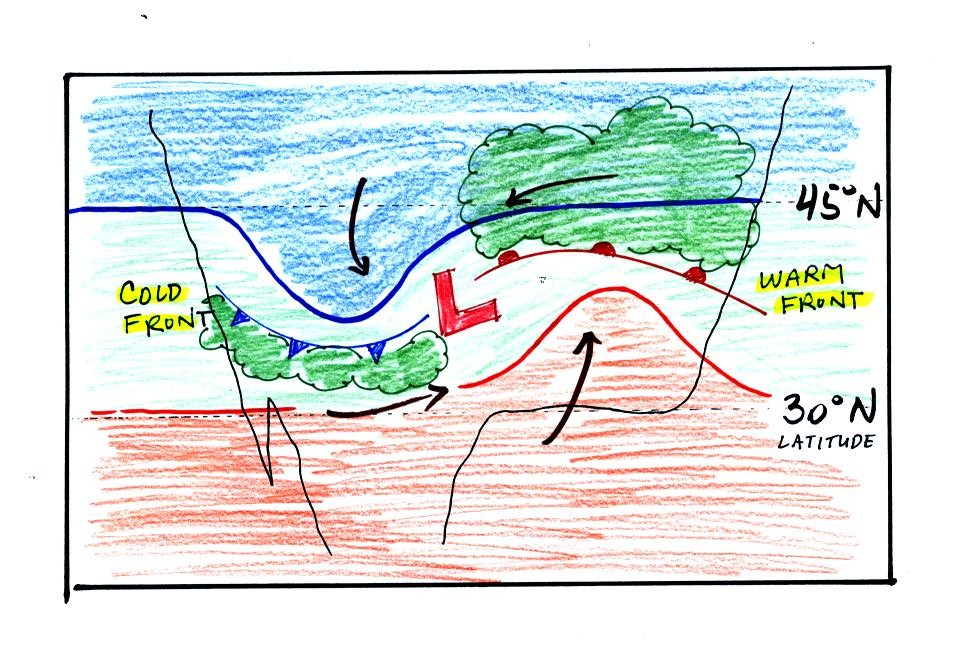
The converging winds in the case of low pressure will move the air
masses of different temperature in toward the center of low pressure
and cause them to collide with each other. The boundaries between
these colliding air masses are called fronts. Fronts are a second
way
of causing rising air motions (rising air expands and cools, if the air
is moist clouds can form).
Cold air is moving from north toward the south on the
western side of
the low. The leading edge of the advancing cold air mass is a
cold front. Cold fronts are drawn in blue on weather maps.
The small triangular symbols on the side of the front identify it as a
cold front and show what direction it is moving. The fronts are
like spokes on a wheel. The "spokes" will spin counterclockwise
around the low pressure center (the axle).
A warm front (drawn in red with half circle symbols) is shown on
the
right hand side of the map at the advancing edge of warm air. It
is also rotating counterclockwise around the Low.
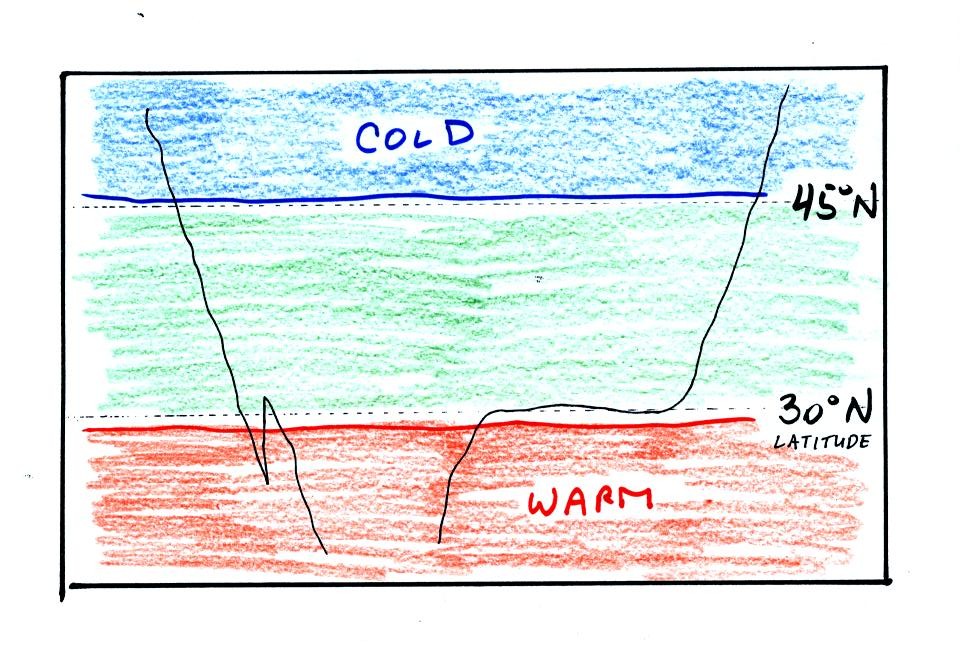
This
type
of storm system is referred to
a middle latitude storm or an extratropical cyclone
(extra tropical means outside the tropics, cyclone means winds spinning
around low pressure). These storms form at middle latitudes
(roughly 30 to 60 degrees latitude because that is where you get air
masses with very different temperatures (cold dry air from high
latitude and warmer air from lower latitude).
You mostly just find warm air in the tropics. Large
storms also
form there; they're called tropical cyclones or, in our part of the
world, hurricanes. I'm pretty sure I
forgot to mention hurricanes in class.
Clouds can form along fronts (often in a fairly narrow band along
a
cold front and over a larger area ahead of a warm front). We need
to look at the crossectional structure of warm and cold fronts to
understand better why this is the case.
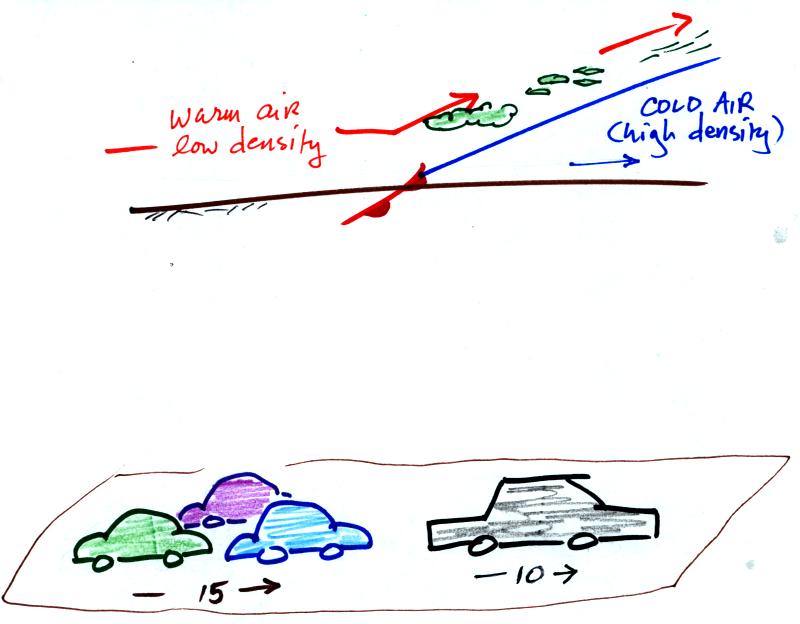
The top picture below shows a crossectional
view of a cold front
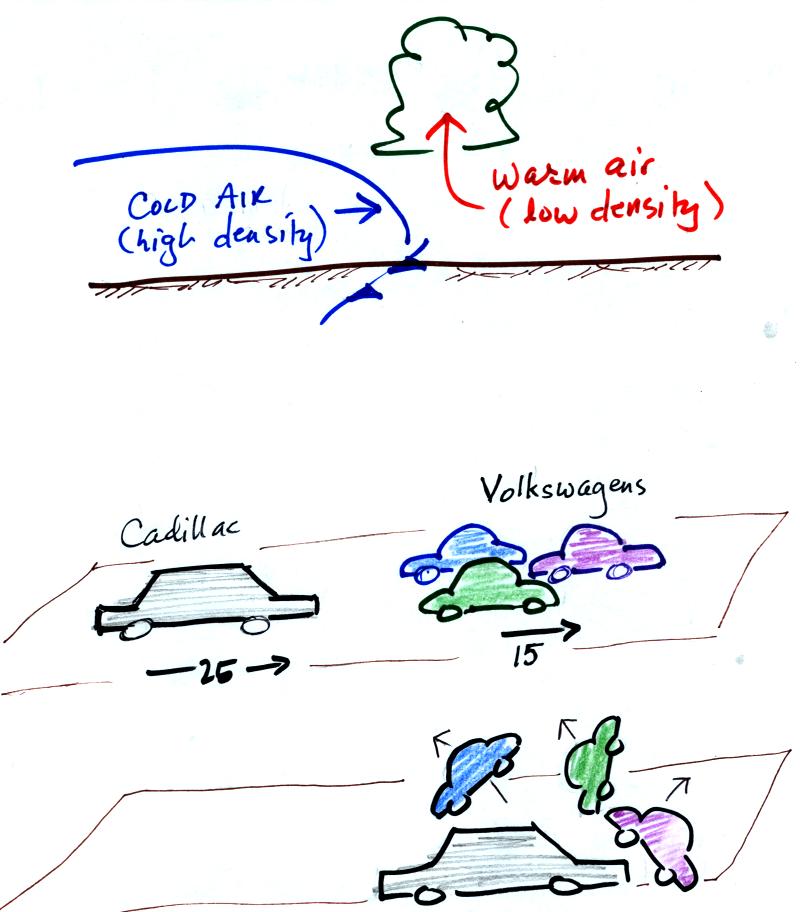
At the top of the figure, cold
dense air on the left is
advancing into
warmer lower density air
on the right. We are looking at the front edge of the cold air
mass, note the blunt shape. The front edge of the advancing cold
air "bunches up" because of friction as it moves across the
ground. The warm low density air is lifted
out of the way
by the cold air. The warm air is rising.
The lower figure shows an analogous situation, a big heavy
Cadillac
plowing into a bunch of
Volkswagens. The VWs are thrown up into the air by the Cadillac.
Here's a crossectional view of a
warm front, the structure is a
little different.
In the case of a warm
front we are looking
at
the
back,
trailing edge of cold air (moving slowly to the right). Note the
ramp
like shape of the cold air mass. Warm air overtakes the cold
air. The warm air is still less dense than the cold air, it can't
wedge its way underneath the cold air. Rather the warm air
overruns the cold air. The warm air rises again (more gradually)
and clouds form. The clouds generally are spread out over a
larger area than with cold fronts. The front can advance only as
fast as the cooler air moves away to the right.
In the automobile analogy, the VWs are catching a
Cadillac. What
happens
when they overtake the Cadillac?
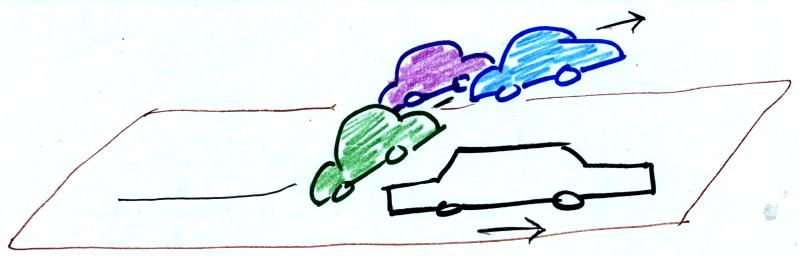
The Volkswagens
aren't heavy
enough to lift the
Cadillac.
They run up and over the Cadillac.
Fronts
are
a
second
way of
causing air to rise. Rising air cools and if the
warm air
is moist and cooled enough, clouds and precipitation can form.
That's why the clouds were drawn in along the fronts in the middle
latitude storm picture above.
We watched a couple of short video segments at this point.
The
first used colored liquids with slightly different densities (a
water/glycerin mixture) to show
how a cold air mass can lift a warmer, less dense air mass. The
video
segment also tried to show how warm air overruns a receding mass of
colder denser air. The second video was a time lapse movie of an
actual cold front that passed through Tucson on Easter Sunday, April 4,
in 1999. It actually snowed for a short time during the passage
of the cold front. Click here
to see the cold front video (it may take a minute or two to transfer
the data from the server computer in the Atmo. Dept., be
patient). Remember the video shows a time
lapse movie of the frontal passage. The front seems to race
through Tucson in the video, it wasn't moving as fast as the video
might lead you to believe. Cold fronts typically move 15 to 25
MPH.
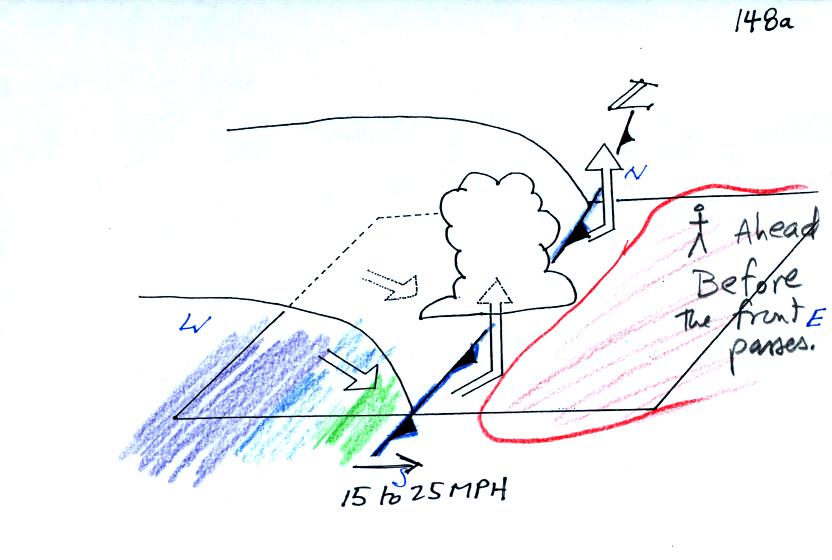
Now let's look at some of the weather changes that
precede and follow passage of a cold front
A crossectional view of a cold front is shown below (we've jumped to p.
148a in the photocopied ClassNotes)
Here are some of the specific weather changes
Weather
variable
|
Behind
|
Passing
|
Ahead
|
Temperature
|
cool, cold, colder*
|
|
warm
|
Dew Point
|
usually much drier*
|
|
may be moist (though that
is often
not the case here in the desert southwest)
|
Winds
|
northwest
|
gusty winds (dusty)
|
from the southwest
|
Clouds,
Weather
|
clearing
|
rain clouds, thunderstorms
in
narrow band along the front
(if the warm air mass is moist)
|
might see some high clouds
|
Pressure
|
rising
|
reaches a minimum
|
falling
|
* the coldest air might follow passage of a cold front by a day
or two. Nighttime temperatures often plummet in the cold dry air
behind a cold front. Note the green (cool), blue (cold), purple
(colder) sequence is the picture above behind the cold front
A temperature drop is probably the most obvious change associated with
a cold front. Here is southern Arizona, gusty winds and a wind
shift are also often noticeable when a cold front passes.
The pressure changes that precede and follow a cold front are not
something we would observe or feel but are very useful when trying to
locate a front on a weather map.
In the next figure we started with
some weather data
plotted on a
surface map using the station model notation.

Before trying to locate a cold front, we needed to draw in a few
isobars and map out the pressure pattern. In some respects fronts
are like spokes on a wheel - they rotate counterclockwise around
centers of low pressure. It makes sense to first determine the
location of the low pressure center.
Isobars are drawn at 4 mb increments above and below a starting value
of 1000 mb. Some
of the allowed values are shown on the right side of the figure (992,
996, 1000, 1004, 1008 etc).
The highest pressure on the map is 1003.0 mb, the lowest is 994.9
mb. You must choose from the allowed list of isobar values and
pick only the values that fall between the high and low pressure values
on the map. Thus we have drawn in 996 mb and 1000 mb
isobars.
The next step was to try to locate the warm air mass in the
picture. Temperatures are in the 60s in the lower right portion
of the map; this area has been circled in red.
The cold front on the map seems to be properly postioned. The air
ahead of the front is warm, moist, has winds blowing from the S or SW,
and the pressure is falling. These are all things you would
expect to find ahead of a cold front.
Clouds and a rain shower were located right near the front which is
typically where they are found.
The air behind the front is colder, drier, winds are blowing from the
NW, and the pressure is falling. Note how the cold front is
positioned at the leading edge of the cold air mass, not necessarily in
front of the coldest air in the cold air mass.
We didn't have time to cover warm fronts. I'll stick that
onto the front of next Monday's notes. And here's the activity
I mentioned in class that will show you how to draw in isobars
and locate fronts on your own (really it contains some very detailed
directions). You can either earn some
1S1P pts or some extra credit pts
(one or the other not both).
We finished class by looking at another short video segment
showing Auguste Piccard and his son Jacques traveling down to 10,000
ft. depth in the ocean. It was a trial run of a bathyscaph that
Auguste Piccard had designed. Later Jacques and another person
would travel to a depth of 35,000 feet.
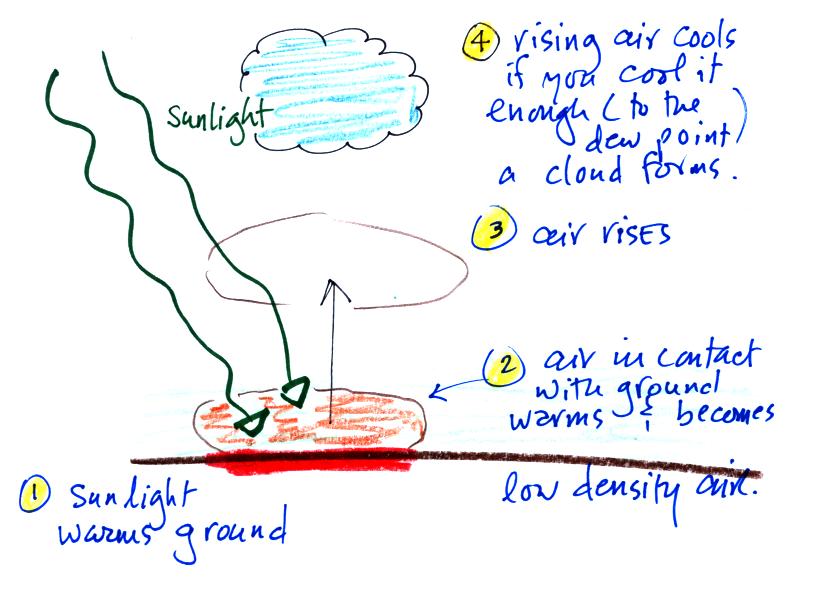
As long as
we're listing weather processes that can cause air to rise we might as
well mention the 3rd process. It's something we've already sort
of covered as a matter of fact. The process illustrated below is
called convection.
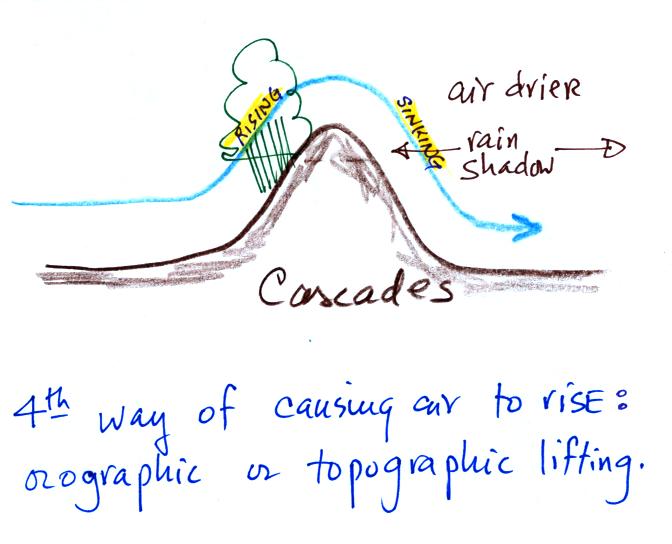
The 4th process is something called
Topographic or Orographic
Lifting.
When moving air encounters a
mountain it must pass over
it.
You often find clouds and rain on the windward side of the
mountain where the air rises (rising air expand and cools; cooling
moist air is how you make clouds)
Drier conditions, a rain shadow, is
found on the leeward side where the air is sinking (sinking air moves
into higher pressure surroundings and warms; that keeps clouds from
forming)