Thu., Mar. 22, 2012
click here to
download today's notes in a more printer friendly format
The Blue
Danube waltz seemed like a good way to celebrate the Spring Equinox
and the return of warm weather.
The in-class assignment from Tuesday was returned today.
Everyone received full credit (0.15 pts of extra credit) even if you
didn't get all the answers right. Here are some answers
to the questions.
The 1S1P Bonus Assignment report on "Causes of the Seasons" was
collected today together with the Expt. #2 revised reports.
A new take-home Optional
Assignment was handed out. It is due next Thursday (Mar.
29). The Controls
of Temperature assignment is due net Tuesday (Mar. 27).
I hope you saw the graupel (aka "soft hail" or "snow pellets") earlier
this week. If not here's a good picture of
some graupel that fell in Catalina AZ (northwest of Tucson). The
photograph was taken by a student in this class.
Now onto the main event for today, some example
humidity
problems.
Example 1
Here's what was actually written down in class. You will
have a hard time unscrambling this if
you're seeing it for
the first
time or didn't understand it when we went over it in class. The
series of steps
that we followed are retraced
below:
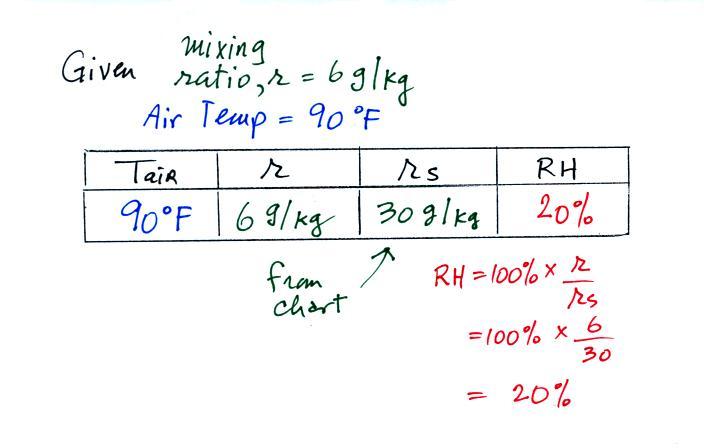
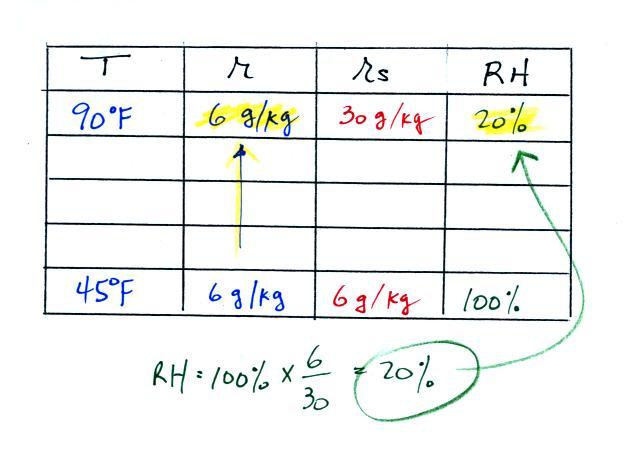
We're given an air temperature of 90 F and a mixing ratio
(r) of 6
g/kg.
We're supposed to find the relative humidity (RH) and
the dew point temperature.
We start by entering the data we were given in the
table. Once
you know the air's temperature you can look up the saturation mixing
ratio value (using the chart on p. 86 in the ClassNotes); it is 30 g/kg
for 90 F air. 90 F air could
potentially hold 30 grams of water vapor per kilogram of dry air (it
actually contains 6 grams per kilogram in this example).
Once you know mixing ratio and saturation mixing ratio you can
calculate the relative humidity (you divide the mixing ratio by the
saturation mixing ratio, 6/30, and multiply the result by 100%).
You ought to be able to work out the ratio 6/30 in your head (6/30 =
1/5 = 0.2). The RH is 20%.
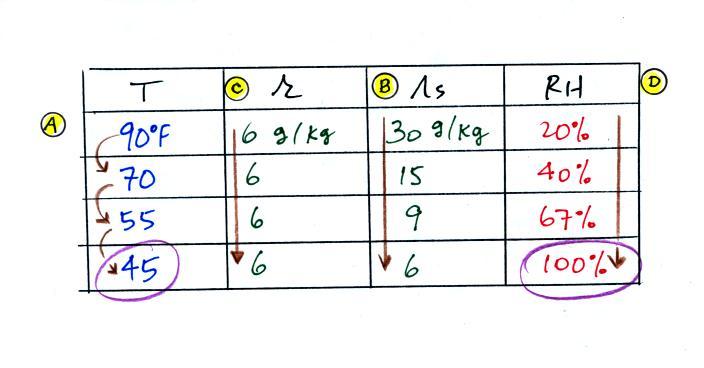
The numbers we just figured out are shown on the top line
above.
(A) We imagined cooling the air from 90F to 70F, then to 55F, and
finally to 45F.
(B) At each step we looked up the saturation mixing ratio and entered
it on the chart. Note that the saturation mixing ratio values
decrease as the air is
cooling.
(C) The mixing
ratio (r) doesn't
change as we cool the air. The only
thing that changes r is adding or removing water vapor and we aren't
doing either. This is probably the most difficult concept to
grasp.
(D) Note how the relative humidity is increasing as we cool
the
air. The air still contains the same amount of water
vapor it is
just that the air's capacity is decreasing.
Finally at 45 F the RH becomes 100%. This is kind of a special
point. You have cooled the air until it has become
saturated.
The dew point temperature in
this problem is 45 F.
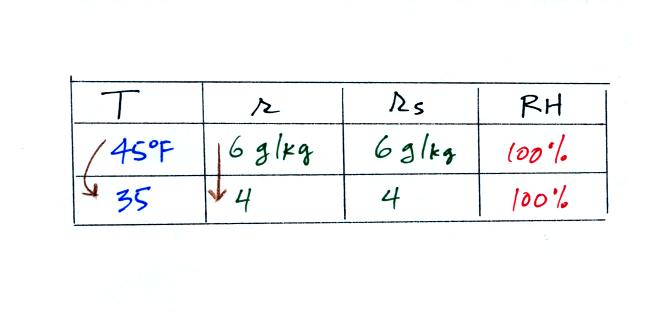
What would happen if we cooled the air
further still, below the dew
point temperature?
35 F air can't hold the 6 grams of water vapor
that 45 F air can. You can only "fit" 4 grams of water vapor into
the 35 F air. The remaining 2 grams would condense. If
this happened at ground level the ground would get wet with dew.
If it happens above the ground, the water vapor condenses onto small
particles in the air and forms fog or a cloud. Because water
vapor is being taken out of the air (the water vapor is turning into
water), the
mixing
ratio will decrease from 6 to 4. As you cool air below the dew
point, the RH stays constant at 100% and the mixing ratio decreases.
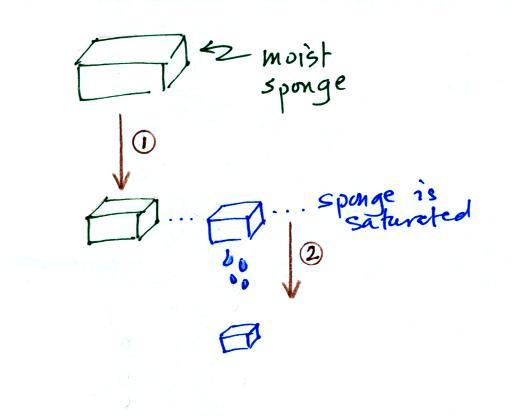
In many ways cooling moist air is liking squeezing a
moist sponge (this
figure
wasn't
shown
in
class)
Squeezing the
sponge and reducing its volume is like cooling moist air and reducing
the saturation mixing ratio. (1) At first when you sqeeze the
sponge
nothing happens, no water drips out. Eventually you get to a
point where the sponge is saturated. This is like reaching the
dew point. (2) If you squeeze the sponge any further (or cool air
below
the dew point) water will begin to drip out of the sponge (water vapor
will condense from the air).
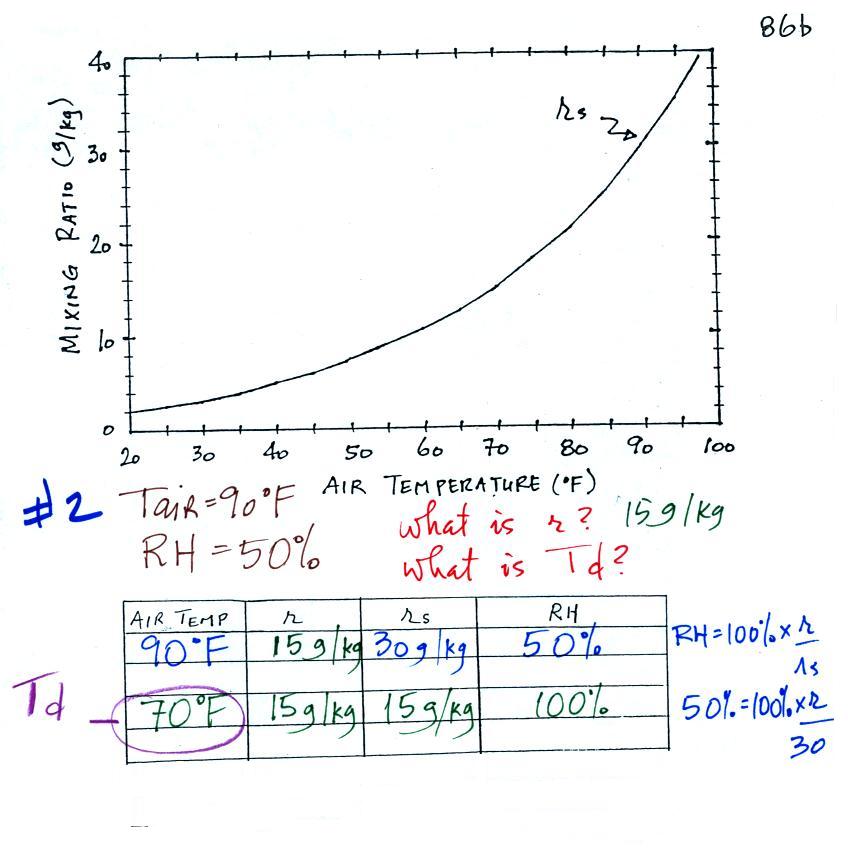
Example 2
The work that we did in class is shown above. Given an air
temperature
of 90
F and a relative humidity of 50% you are supposed to figure out the
mixing ratio (15 g/kg) and the dew point temperature (70 F). The
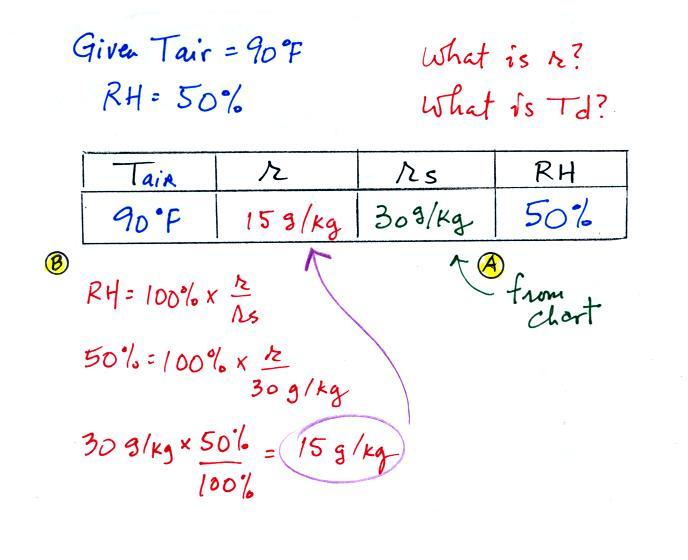
problem is worked out in detail below:
First you fill in the air temperature and the RH data that
you are
given.
(A) since you know the air's temperature you can look up the
saturation mixing ratio (30 g/kg).
(B) Then you might be able to figure out the mixing ratio in your
head. Air that is filled to 50% of its capacity could hold up to
30 g/kg. Half of 30 is 15, that is the mixing ratio. Or you
can substitute into
the relative humidity formula and solve for the mixing ratio.
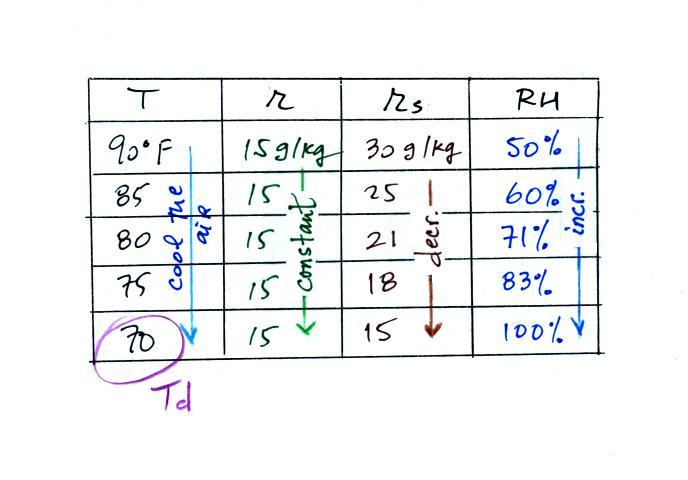
Finally you imagine cooling the air. The
saturation mixing ratio decreases, the mixing ratio stays constant,
and the relative humidity increases. In this example the RH
reached 100% when the air had cooled to 70 F. That is the dew
point temperature.
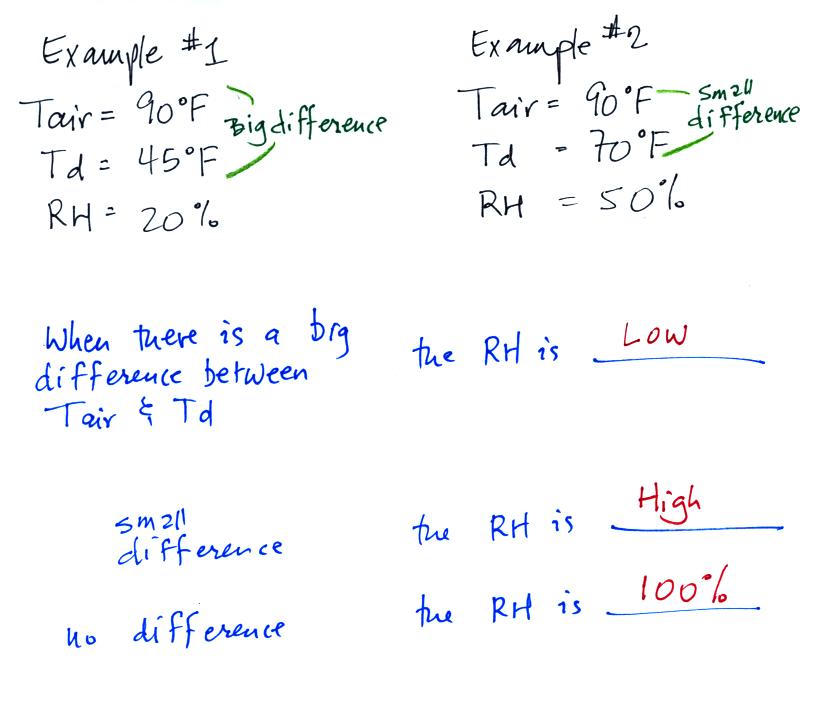
We can use
results from humidity problems #1 and #2 to
learn and understand a useful rule.
In the first
example the difference between the air and dew point
temperatures was large (45 F) and the RH was low (20%).
In
the
2nd
problem
the
difference
between
the
air
and
dew
point
temperatures
was
smaller
(20
F)
and the RH was higher (50%). The easiest way to
remember
this
rule is to remember the case where there is no difference between the
air and dew
point temperatures. The RH then would be 100%.
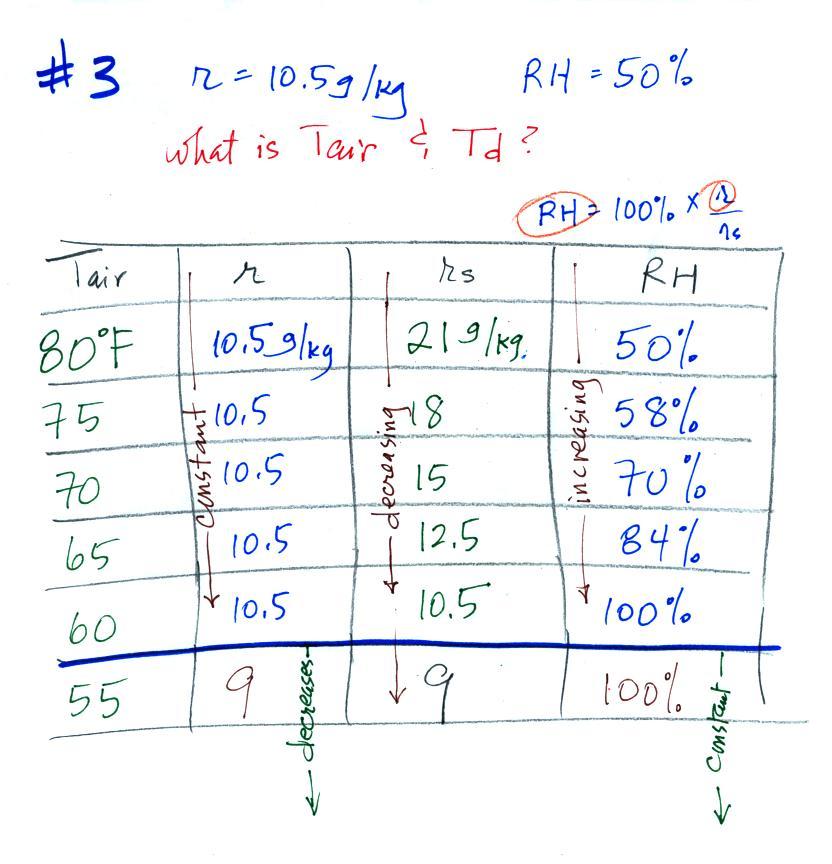
Example 3
You're given the the mixing ratio = 10.5 g/kg and the relative humidity
= 50%. You need to figure
out the air temperature and the dew point temperature.
Here's the play by
play solution to the question
(1) The air contains 10.5 g/kg of water vapor, this is
50%,
half, of what the air
could potentially hold. So the air's capacity, the saturation
mixing ratio must be 21 g/kg (you can either do this in your head or
use the RH equation following the steps shown above).
(2) Once you know the saturation mixing
ratio you can look up the air temperature in a table (80 F air has a
saturation mixing ratio of 21)
(3) Then you
imagine cooling the air until the RH becomes 100%. This occurs at
60 F. The dew point is 60 F.
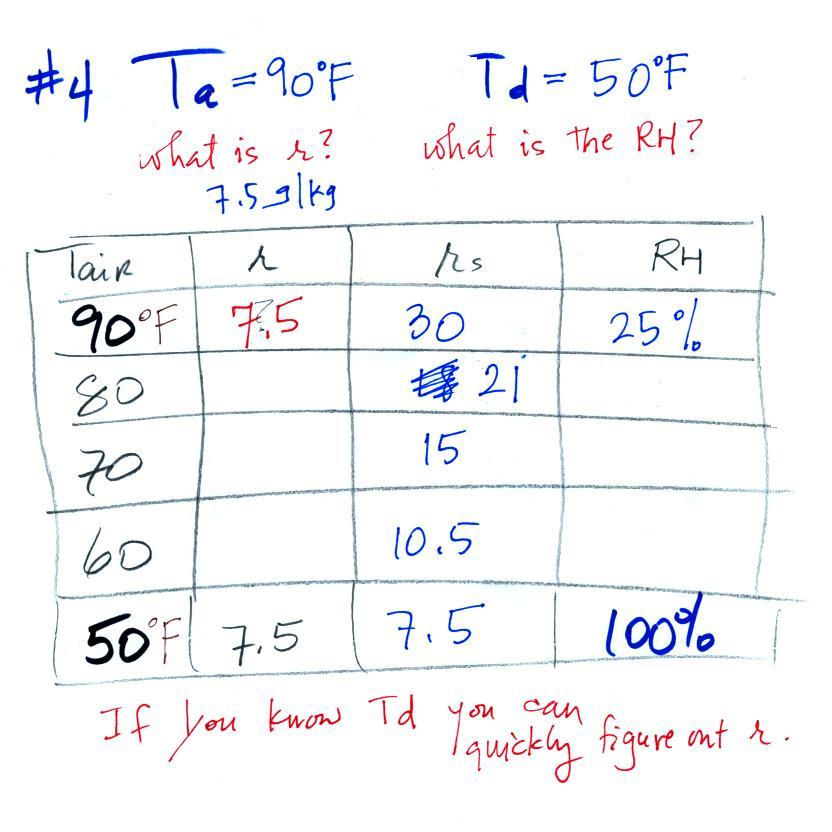
Example 4
Probably the most difficult problem of the bunch. But one of the
things we said about dew point is that it has the same job as mixing
ratio - it gives you an idea of the actual amount of water vapor in the
air. This problem will show that if you know the dew point, you
can quickly figure out the mixing ratio. Knowing the dew point is
equivalent to knowing the mixing ratio.
Here's what we ended up with in class, we
were given the air temperature and the dew point temperature. We
were supposed to figure out the mixing ratio and the relative
humidity.
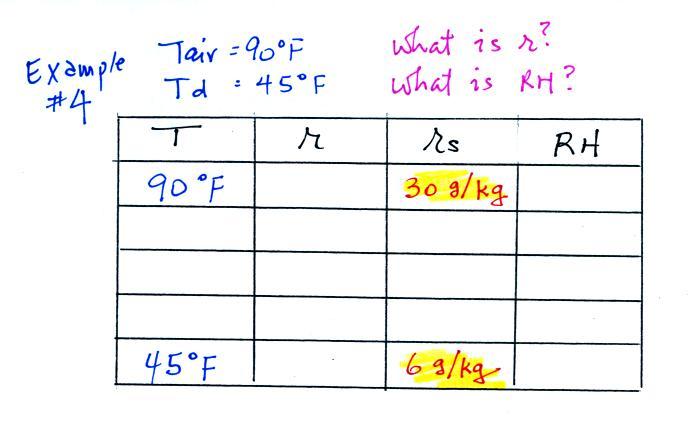
We enter the two temperatures onto a chart and look up the
saturation
mixing ratio for each.
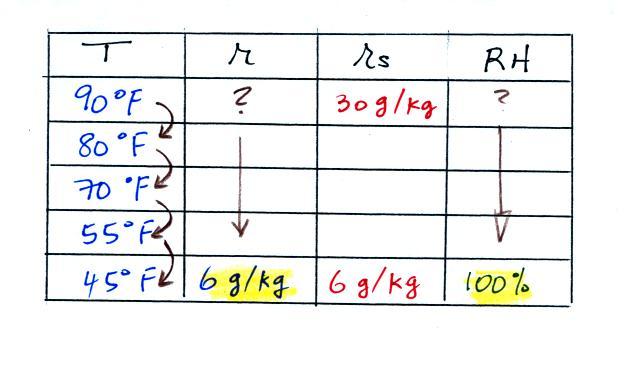
We ignore the fact that we don't know the mixing
ratio. We do know that if we cool the 90 F air to 45 F the RH
will
become
100%. We can set the mixing ratio equal to the value of the
saturation mixing ratio at 45 F, 6 g/kg.
Remember back to the three earlier examples. When we
cooled air
to the the dew point, the mixing ratio didn't change. So the
mixing ratio must have been 6 all along. Once we know the
mixing ratio in the 90 F air it is a simple matter to calculate the
relative humidity, 20%.
And now for something completely different (actually many of you
just turned in a 1S1P report on the Causes of the Seasons so this
should be material you're pretty familiar with. But the Spring
Equinox took place earlier this week (it was 05:14
UT on Tuesday Mar. 20 this year which was 10:14 pm Monday night in
Tucson). We can't let a big event like
that go unnoticed.

The figure above shows the earth
orbiting the
sun.
On
or
around Dec. 21st, the winter solstice, the north pole is tilted away
from the sun. Note that a small portion of the earth near the N.
Pole (north of the Arctic Circle) spends 24 hours in darkness.
Days are less than 12 hours long in the northern
hemisphere and the sun is low in the sky. Both factors reduce the
amount of sunlight energy reaching the ground. That's why it's
cold and wintry.
On June 21st, the
summer solstice, the north pole is tilted toward the sun. Now
there are 24 hours of sunlight north of the Arctic Circle. Days
are more than 12 hours long in the northern hemisphere and the sun is
high in the sky at noon. A lot more sunlight energy reaches the
ground; that's why it is summer.
The equinoxes are a time of transition. On the equinoxes,
the N. Pole still tilted just not toward or away from the sun.
The line
separating day and night passes through the pole and the days
and nights are each about 12 hours long everywhere on earth (except
perhaps
at
the poles).
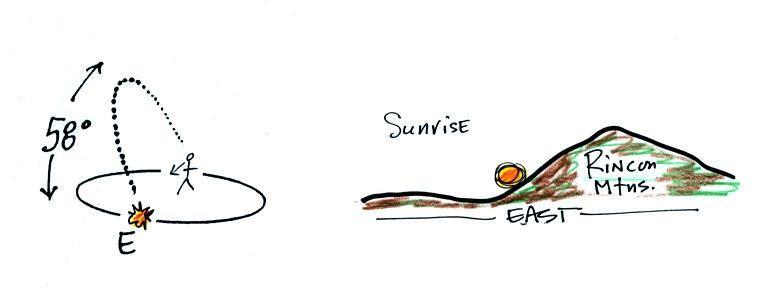
The drawing below shows you what you would see at sunrise (about
6:30 am) on the Spring Equinox here in Tucson (the same would happen on
the Fall Equinox). The sun rises exactly in the east
on the equinoxes. The rest of the year it is a little to the
north or south of east.
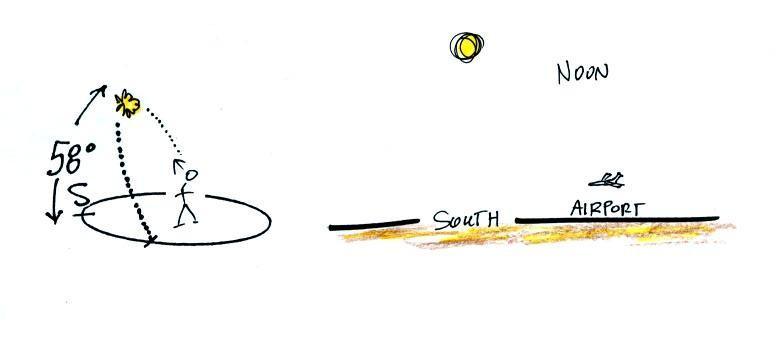
At noon you
would need to look south to see the sun.
The sun reaches its
highest point in the sky at noon. On the equinoxes in Tucson
that's almost 60 degrees. The sun is lower in the sky (34.5
degrees
above the horizon) on the winter solstice. That together with the
fact that the days are shorter means much less sunlight energy reaches
the ground. In the summer the days are longer and the sun gets
much higher
in the sky at noon (81.5
degrees
above
the
horizon,
nearly
overhead). Much more sunlight energy reaches the ground and it is
much warmer.
The sun passes directly overhead at the equator at noon on the
equinoxes.
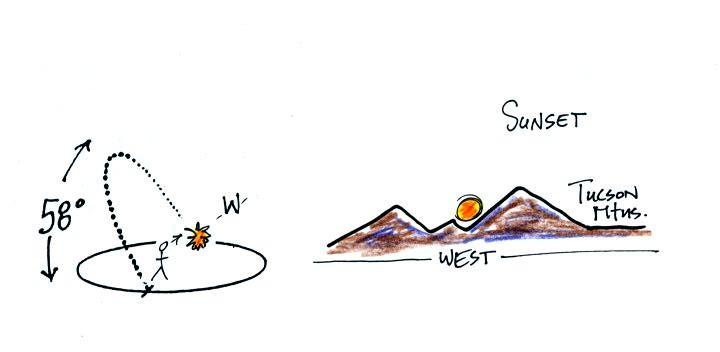
The
sun
sets exactly in the west on the equinoxes at about 6:30 pm in
Tucson.
This is the 2 pm class.
Most of you are more likely
(perhaps) to see the sun set than see the
sun
rise. The figure below shows you about what you would see if you
looked west on Speedway (from Treat Ave.) at sunset. In the
winter the sun will set south of west, in the summer north of west
(probably further south and north than shown here). On the
equinoxes the sun sets exactly in the west. This is something you
should check out for yourself this week before the sun moves noticeably
to the north of due west.
Several years ago I
positioned myself in the median near the
intersecton of Treat and Speedway and pointed my camera west. I
took a multiple exposure photograph of the sun over a 2 or 3 hour
period
that ended at sunset. I'll bring the slide photograph to
class one of these days.
Something else to note in this figure and something I didn't
mention in class. Note how the sun is changing
color. It changes from a bright yellow white to almost red by the
time it sets.. This is due to scattering of sunlight by
air. The shorter wavelengths (violet, blue, green) are scattered
more readily than the longer wavelengths. At sunset the rays of
sunlight take a much longer slanted path through the atmosphere and
most of the shorter wavelengths are scattered and removed from the beam
of sunlight. All that's left in the beam of light that reaches
your eyes are the longer wavelengths: yellow, orange, and red.
If you aren't
careful, you can get yourself seriously
injured,
even
killed,
on
or around the equinoxes. Here's
an article that appeared in the Arizona Daily Star at the time of the
equinox last fall (Thu., Sep. 22).
I forgot to
come back and discuss the following figure in class.
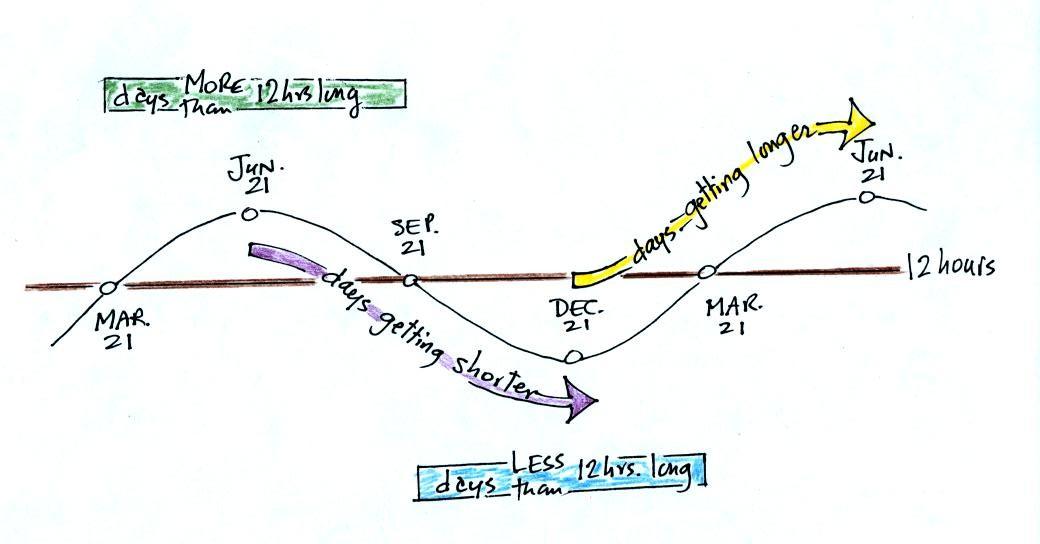
December 21, the
summer solstice, is the shortest day
of the
year (about 10 hours of daylight in Tucson). The days have slowly
been getting longer since then. The rate of change is greatest at the
time of the equinox.
This will continue up until June 21,
the summer solstice, when there will be about 14 hours of
daylight. After that the days will start to shorten again as we
make
our way back to
the winter solstice.
There was
a very interesting coicidence last semester. We were
covering some of this same material in class on Friday Sep. 23.
There
were a few parents in class because it was Parent's
Weekend. I showed these same pictures on that
afternoon. One of the parents came up to the front
after class and mentioned having seeing the sun right at the end of
77th St.
in New York City around this time of year. That got me thinking
that a picture of sunset at the end of one of the long streets with all
the tall buildings might be spectacular.
When I started looking however I found that the major streets in
Manhattan aren't oriented EW and NS. You can see this on a Google
map
of
Manhattan. 77th St. is oriented in more of a NW-SE
direction. So the sun doesn't shine straight down 77th St.
at sunrise and sunset on the equinoxes. I was pretty disappointed
but then I stumbled on the this
Manhattanhenge
map which shows the direction of sunset (the left, west,
side of the map) and sunrise (the right, east, side of the map) at
various times of the year.
If you remember that as you move past the Spring Equinox toward summer
sunrise move north of east and sunset is north of west. On May 31
the sun has moved far enough north that it does set right at the west
end of 77th St. Sunset continues to move north up until the
summer solstice on June 21. Then the sunset starts to move back
south. You can again see the sunset at the west end of 77th St.
on July 12 and 13. An
article with several Manhattanhenge
photographs from the May 31 event appeared in a story on
the Business Insider webpage. That would certainly
make a worthwhile field trip in Atmo 170A1 if the semester went that
long. The "henge" part of the
name comes from Stonehenge
where the rising and setting sun aligns with
stones on the solstices.
You can also see the sunrise at the east end of 77th St. But
sunrise has to be in the southeast. This takes place on Dec. 5
and Jan. 8, just before and just after the winter solstice.
We had a little time for a couple of more topics that begin to
apply some of what we have been learning about humidity.
The figure below is on p.
87 in the photocopied ClassNotes. It explains how you can dry
moist air.
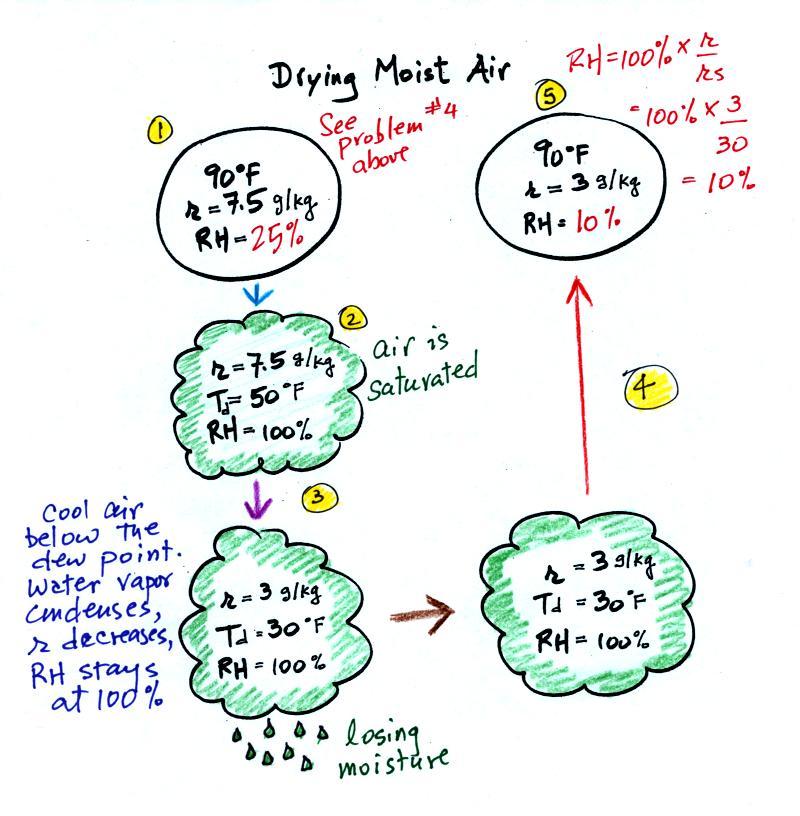
At Point 1 we start with some 90 F air with a relative
humidity of 25%, fairly dry air. These are the numbers we ended
up with in Example Problem #4. We imagine cooling this air to
the dew point temperature where the relative humidity would reach 100%
and a cloud would form (Pt. 2 in the figure above).
Then we continue to cool the air below the dew
point, to
30 F. Air that is cooled below the dew point finds itself with
more water vapor than it can contain. The excess moisture must
condense (we will assume it falls out of the air as rain or
snow). When air reaches 30 F it contains 3 g/kg, less than half
the
moisture that it originally did (7.5 g/kg). The air is being
warmed back up to 90 F along Path 4. As it warms the mixing ratio
remains constant. At Point 5, the air
now
has a RH of only 10%.
Drying moist air is very much like wringing moisture from a wet
sponge. The
figure
below
wasn't shown in class.

You start to
squeeze the sponge and it gets smaller. That's like cooling the
air and reducing the saturation mixing ratio, the air's capacity for
water vapor. At first squeezing the sponge doesn't cause anything
to happen (that's like cooling
the air, the mixing ratio stays constant as long as the air doesn't
lose any water vapor). Eventually water will start to drop from
the sponge (with air this is what happens when you reach the dew point
and continue to cool the air below the dew point). Then you let
go of the sponge and let it expand back
to its orignal shape and size (the air warms back to its original
temperature). The sponge (and the air) will be drier than when
you started.
This sort of process ("squeezing" water vapor out of moist air by
cooling the air below its dew point) happens all the time. Here
are a couple of examples (p. 87 again)

In the
winter cold air is brought inside your house or apartment and
warmed. Imagine 30 F air with a RH of 100% (this is a best case
scenario, the cold winter air usually has a lower dew point and is
drier). Bringing the air inside and warming it will cause the RH to
drop from 100% to 20%.. Air indoors during the winter is often
very dry. This can cause chapped skin, can irritate nasal
passages, and cause cat's fur to become charged with static electricity.
The air in an
airplane comes from outside the plane. The air outside the plane
can be very cold (-60 F perhaps) and contains very little water
vapor (even if the -60 F air is saturated it would contain essentially
no water vapor). When brought inside and warmed to a
comfortable
temperature, the RH of the air in the plane will be very close
0%.
Passengers often complain of dehydration
on
long
airplane
flights. The plane's ventilation system probably adds
moisture to
the
air so that it doesn't get that dry.
Next a much more important example of drying moist air (see p. 88
in the photocopied ClassNotes).
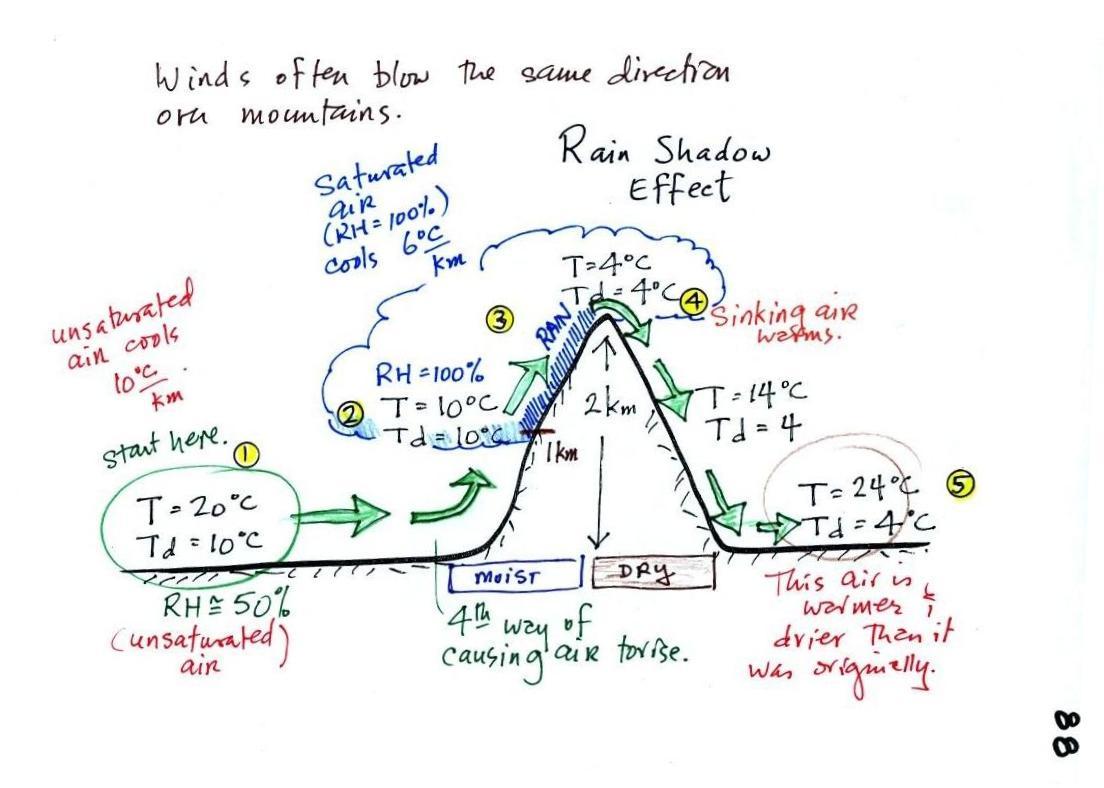
We start with some moist but unsaturated air (the RH is
about 50%) at Point 1 (the air and dew point temperatures would need to
be equal in
order for the air to be saturated).
As
it
is
moving
toward
the
right
the
air runs into a mountain and
starts to rise. Rising air expands and
cools. Unsaturated air
cools 10 C for every kilometer of altitude gain.
This is known as the dry adiabatic lapse rate. So after rising 1
km
the air will cool to 10 C which is the dew point.
The air becomes saturated at Point 2 (the air temperature and the dew
point are both 10 C). Would you be able to
tell if you were outdoors looking at the mountain? Yes, you would
see a cloud
appear.
Now that the RH = 100%, the saturated air cools at a slower rate than
unsaturated air (condensation of water vapor releases latent heat
energy inside the rising volume of air, this warming partly offsets the
cooling caused by
expansion). We'll use a value of 6 C/km (an average
value). The air cools from 10 C to 4
C in next kilometer up to the top of the mountain. Because the
air is being cooled below its dew point at Point 3, some of the water
vapor will condense and fall to the ground as rain. Moisture is
being removed from the air and the value of the mixing ratio (and the
dew point temperature) decreases.
At Point 4 the air starts back down the right side of the
mountain. Sinking air is compressed and warms. As soon as
the air starts to
sink and warm, the relative humidity drops below 100% and the cloud
disappears. The sinking unsaturated air will warm at the 10 C/km
rate.
At Point 5 the air ends up warmer (24 C vs 20 C) and drier (Td =
4 C vs Td = 10 C) than when it started out. The downwind side of
the mountain is referred to as a "rain shadow" because rain is less
likely there than on the upwind side of the mountain. Rain is
less likely because the air is sinking and because the air on the
downwind side is drier than it was on the upslope side.
I went looking for some good specific illustrations of the
rainshadow effect after class. None of the
following figures were shown in class on Thursday.

|

|
We can see the effects of a rainshadow illustrated well in the
state of Oregon. The figure above at left shows the topography (here's
the
source
of that map). Winds generally blow from west to east
across the state.
Coming off the Pacific Ocean the winds first encounter a coastal range
of moutains. On the precipitation map above at right (source)
you
see
a lot of greens and blue on the western sides of the coastal
range. These colors indicate yearly rainfall totals that range
from about 50 to more than 180 inches of rain per year. This is
where temperature rain forests are found.
That's the Willamette River, I think, in between the coastal range and
the Cascades. This valley is somewhat drier than the coast
because air moving off the Pacific has lost some of its moisture moving
over the coastal range.
What moisture does remain in the air is removed as the winds move up
and over the taller Cascades. Yearly rainfall is generally less
than 20 inches per year on the eastern side, the rainshadow side, of
the Cascades. That's not too much more than Tucson which averages
about 12 inches of rain a year.
Here's the best picture of the rain shadow effect I could find
(here's the source
of the
picture). I
didn't
show this picture in class either.

The Himalayan mountains stretch across the lower left 1/3 of the
picture. The land below and to the left of the mountains appears
somewhat green in the picture. This is because moist air moving
from lower
left toward the upper right leaves most of its moisture on this side of
the mountain range. The upper right 2/3rds of the picture, the
Tibetan plateau, is in the rain shadow and appears very dry and brown
in the
photograph.
Most of the year the air that arrives in Arizona comes from the west,
from the Pacific
Ocean (this changes in the summer). It
usually isn't very moist by the time it reaches Arizona because it has
travelled up and over the
Sierra Nevada mountains in
California and the Sierra Madre mountains further south in
Mexico. The air loses much of its moisture on the western slopes
of those mountains.


