Monday Mar. 4, 2013
click here to download today's notes
in a more printer friendly format
Israel
Kamakawiwo'ole's version of "Somewhere Over
the Rainbow/What a Wonderful World" was a nice way to start
a new week. The Federated States of Micronesia will come up
at the end of today's class and Polynesian music was as close as I
could come.
Some additional Experiment #3 materials were brought to
class. I'll bring more on Wednesday. After that you'll
need to come by my office to pick them up. You should now
either have finished an experiment report or be working on an
experiment, book report, or Scientific Paper report. The
Expt. #3 reports are due Mon., Mar. 25. Everything else is
due Mon., Apr. 4.
Graded Expt. #2 reports will be returned on Wednesday. The
revised Expt. #1 reports will be returned after Spring Break.
We have a little material to cover concerning the effects of
clouds on daytime high and nighttime low temperatures.
W can use our simplified representation of the greenhouse
effect to understand the effects of clouds. The following
can be found on pps. 72a & 72b in the ClassNotes (I've
rearranged things slightly to try to make it clearer)
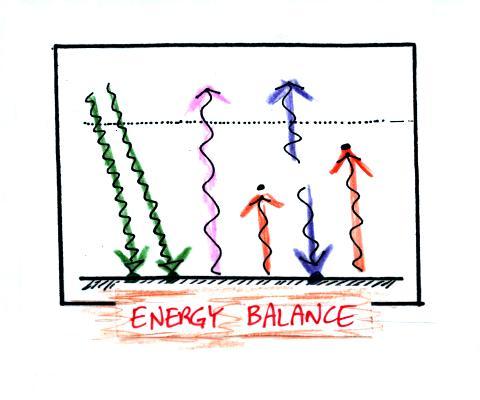
Here's the simplified picture of
radiative equilibrium again (you're probably getting pretty
tired of seeing this). You should be able to
say something about every arrow in the picture. The two
pictures below show what happens at night when you remove
the two green rays of incoming sunlight.
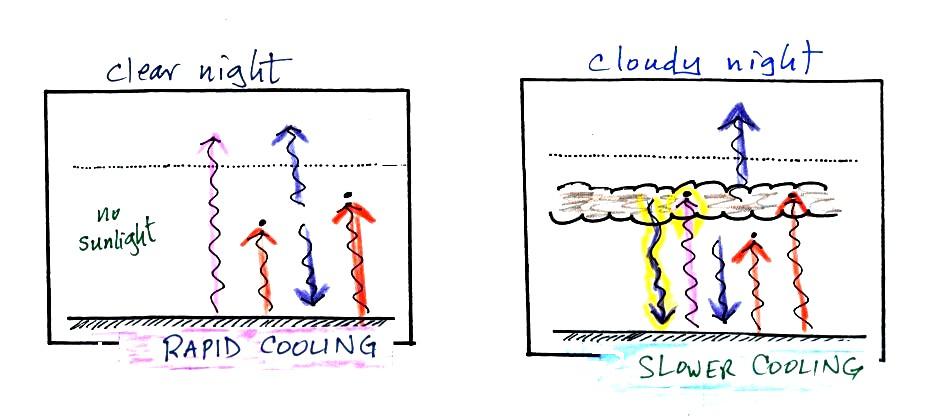
Note first of all that neither picture is in radiative
equilibrium. The picture on the left shows a clear
night. The ground is losing 3 arrows of energy and getting
one back from the atmosphere. That's a net loss of 2
arrows. The ground cools rapidly and gets cold during the
night.
A cloudy night is shown at right. Notice the effect of
the clouds. Clouds are good absorbers of far infrared radiation (10 μm
wavelength). They reflect near IR light (1 μm wavelength)
just like they do visible light. If we could see 10
μm far IR light, clouds would appear black, very different from
what we are used to (because clouds also emit IR light, the
clouds might also glow). Because of the clouds none of the
IR radiation emitted by the ground passes through the atmosphere
into space. It is all absorbed either by greenhouse gases
or by the clouds. Because the clouds and atmosphere are
now absorbing 3 units of radiation they must emit 3 units: we'll
draw 1 going upward into space, the other 2 downward to the
ground.
There is still a net loss of energy at the ground but it's
smaller, only 1 arrow. The ground won't cool
as quickly and won't get as cold on a cloudy night as it does on
a clear night. That makes for somewhat warmer early
morning bicycle rides this time of the year. It was a
little cloudy last night (Sunday night) and the result was a
nighttime low in the upper 50s instead of the mid 40s.
The next two figures compare clear and cloudy days.
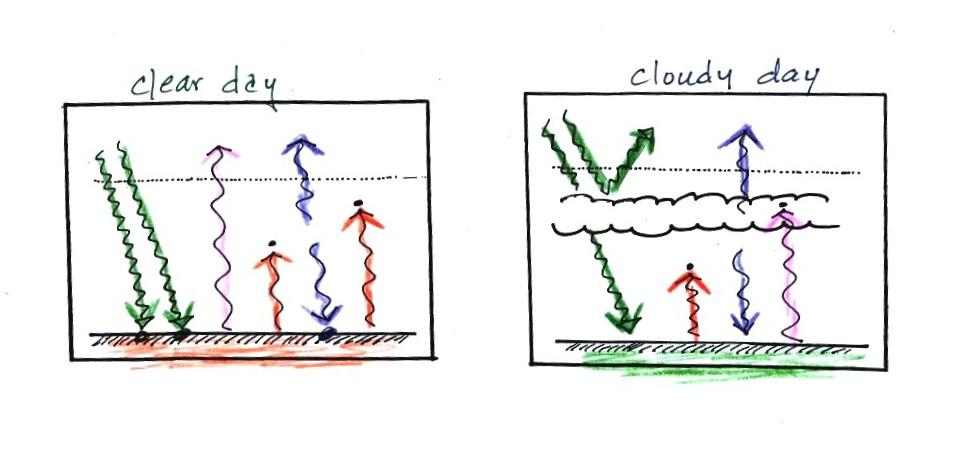
Clouds are good reflectors
of visible light
(we see visible light and clouds appear white). The effect
of this is to reduce the amount of sunlight energy reaching the
ground in the right picture. With less sunlight being
absorbed at the ground, the ground doesn't need to get as warm to
be in energy balance.
It is generally cooler during the day on a cloudy day than on a
clear day.
Clouds raise the nighttime minimum temperature and lower the
daytime maximum temperature. Here are some typical daytime
high and nighttime low temperature values on clear and cloudy days
for this time of the year.
We can use our simplified representation of radiative
equilibrium to understand enhancement of the greenhouse effect and
global warming.
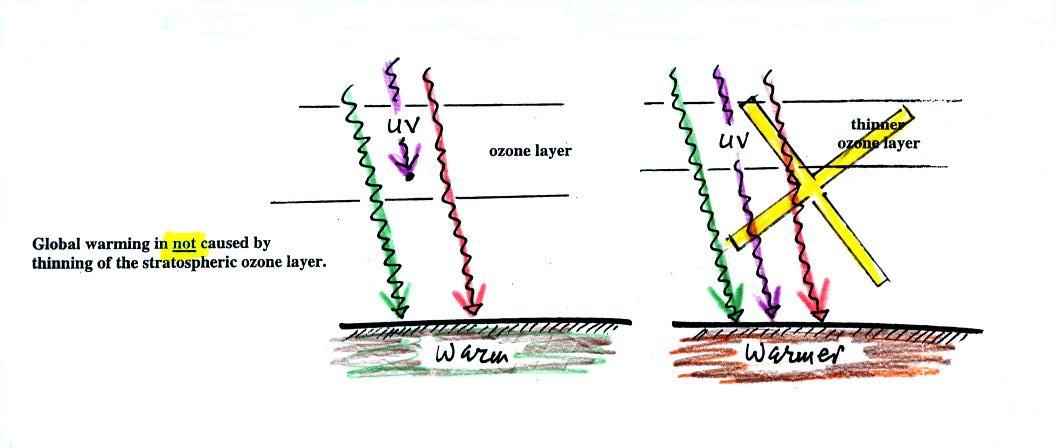
But first a common misconception about the cause of global
warming.
Many people know that sunlight contains UV light and that the
ozone absorbs much of this dangerous type of high energy
radiation. People also know that release of chemicals such
as CFCs are destroying stratospheric ozone and letting some of
this UV light reach the ground. That is all correct.
They then conclude that it is this additional UV energy
reaching the ground that is causing the globe to warm. This is not correct.
There isn't much (about 7%) UV light in sunlight in the first
place and the small amount of additional UV light reaching the
ground won't be enough to cause global warming. It will
cause cataracts and skin cancer and those kinds of problems but
not global warming.
If all of the UV light in sunlight were to reach the ground it
probably would cause some warming. But it probably wouldn't
matter because some of the shortest wavelength and most energetic
forms of UV light would probably kill us and most other forms of
life on earth.
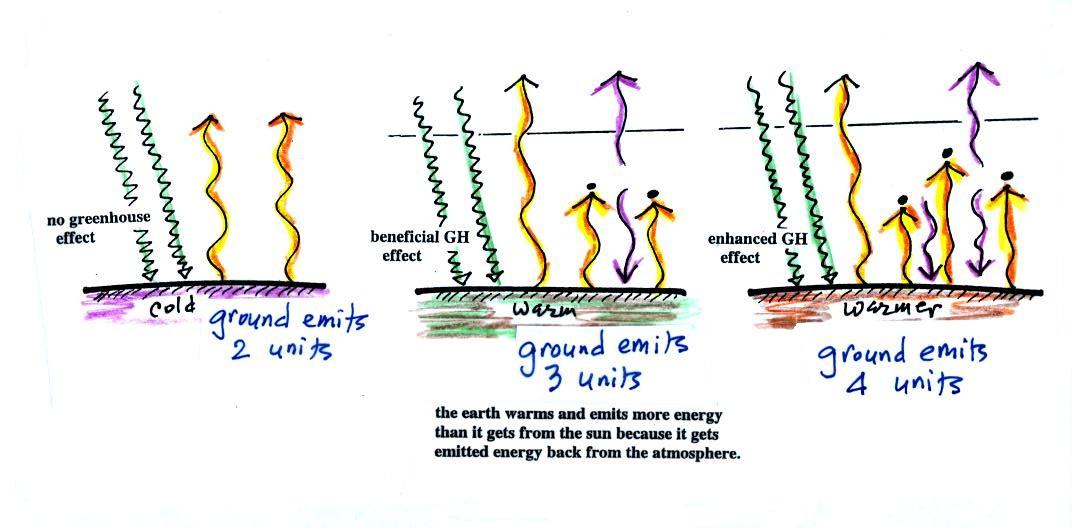
Here's the reason for concern
The figure (p. 72c in the photocopied Class Notes) on the left
shows energy balance on the earth without an atmosphere (or with
an atmosphere that doesn't contain greenhouse gases). The
ground achieves energy balance by emitting only 2 units of energy
to balance out what it is getting from the sun. The ground
wouldn't need to be very warm to do this.
If you add an atmosphere and greenhouse gases, the atmosphere
will begin to absorb some of the outgoing IR radiation. The
atmosphere will also begin to emit IR radiation, upward into space
and downard toward the ground. After a period of adjustment
you end up with a new energy balance. The ground is warmer
and is now emitting 3 units of energy even though it is only
getting 2 units from the sun. It can do this because it gets
a unit of energy from the atmosphere. This is what I refer
to as the beneficial greenhouse effect. It makes the earth
more habitable (average surface temperature of 60 F versus about 0
F without a greenhouse effect).
In the right figure the concentration of greenhouse gases has
increased even more (due to human activities). The earth
might find a new energy balance. In this case the ground
would be warmer and would be emitting 4 units of energy, but still
only getting 2 units from the sun. With more greenhouse
gases, the atmosphere is now able to absorb 3 units of the IR
emitted by the ground. The atmosphere sends 2 back to the
ground and 1 up into space.
How would you describe Tucson's climate? Hot
and dry? You're basically conveying information about
temperature and precipitation. Here we'll mainly concern
ourselves with temperature.
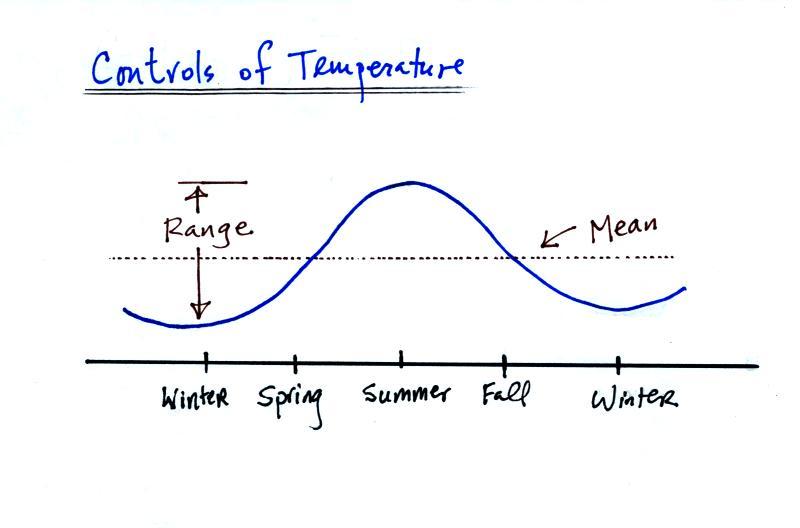
With just two numbers, the annual mean or annual average
temperature and the annual range of temperature, you can give
someone a pretty complete idea of the temperature in Tucson
(or some other location) and how it changes during the year.
Before we look at the factors that determine annual
mean and range of temperature, here are some average
temperature and precipitation data for Tucson (this
information was on a class handout)
1. Monthly average temperatures are plotted
here. To determine the annual mean temperature add the
twelve monthly average temperatures and divide by 12 (68.5 F for
the data shown here). You can get a pretty good estimate of
the annual mean temperature by adding the highest and lowest
average monthly temperature values and dividing by 2 (69 F).
Average Monthly Temperature
and Precipitation data for Tucson
Average
Monthly Temp
|
Month
|
Average
Max Temp
|
Average
Min Temp
|
Difference
|
Precipitation
|
52
|
Jan
|
64
|
39
|
25
|
0.99
|
55
|
Feb
|
68
|
42
|
26
|
0.88
|
59
|
Mar
|
73
|
45
|
28
|
0.81
|
66
|
Apr
|
82
|
50
|
32
|
0.28
(see Note 2)
|
74
|
May
|
90
|
59
|
31
|
0.24
|
84
|
Jun
|
100
|
68
|
32
|
0.24
|
86
|
Jul
|
100
|
73
|
27
|
2.07
(see Note 3)
|
85
|
Aug
|
97
|
72
|
25
|
2.30
|
81
|
Sep
|
94
|
68
|
26
|
1.45
|
70
|
Oct
|
84
|
57
|
27
|
1.21
|
59
|
Nov
|
72
|
45
|
27
|
0.67
|
52
|
Dec
|
65
|
39
|
26
|
1.07
(see Note 4)
|
Notes
2. April, May, and June is generally the driest time
of year in Tucson. This is reflected in the low montly
average precipitation values. It is fairly common to go a
month or more without rain at this time of year.
Because the air is dry and the
skies are cloud free, there is generally a large difference
between daytime high and nighttime low temperatures.
3. The summer thunderstorm season usually begins in
early July when the daily average dew point temperature remains 54
F or above for three days in a row. July, Aug, and Sept. are
usually the wettest months of the year in Tucson. Tucson
gets nearly half its annual rainfall during the summer
thunderstorm season.
Note how the difference between
daytime high and nighttime low temperatures decreases once the
summer thunderstorm season gets underway. This is due to the
increase in humidity and cloud cover. Clouds will lower the
daytime high temperature and raise the nighttime minimum
temperature.
4. During the winter, middle latitude storms will
occasionally drop far enough south to bring precipitation to
southern Arizona. Sometimes these storms will pull up
moisture from the tropics and rainfall amounts can be significant.
There are three or four main factors that determine a region's
annual mean and annual temperature range.
Latitude affects both the annual mean and the annual range of
temperature. The polar regions have colder annual
average temperatures than any other location on earth.
The South Pole is in the middle of a large land mass
(Antarctica), the North Pole is ocean. Much of
Antarctica is found at high altitude. These factors work
together to make Antarctica and the South Pole colder than the
North Pole. The hottest regions on earth are found near
30 latitude, not at the Equator. This is, if you
remember, where the optimal combination of sun elevation angle
and length of day delivers the greatest amount of sunlight
energy to the ground.
The annual range of temperature increases with increasing
latitude. There is little or no seasonal change at the
Equator.

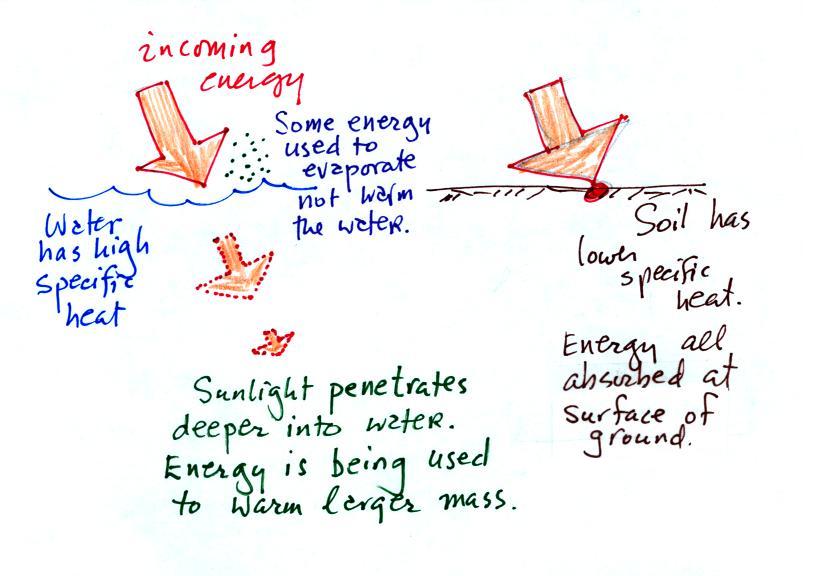
Water has a higher specific heat. Some of the
incoming energy is used to evaporate rather than warm
water. Incoming sunlight penetrates into a body of water
and is used to try to warm a larger mass of water. These
three factors mean that water will warm more slowly and won't
get as hot during the summer as land. There is also a
larger diurnal temperature range over land than over
ocean. If you've ever been to the beach in the summer
you probably remember that the sand on the beach gets
much hotter during the day than the ocean water. We'll
see this effect in action in a later lecture on satellite
photographs.
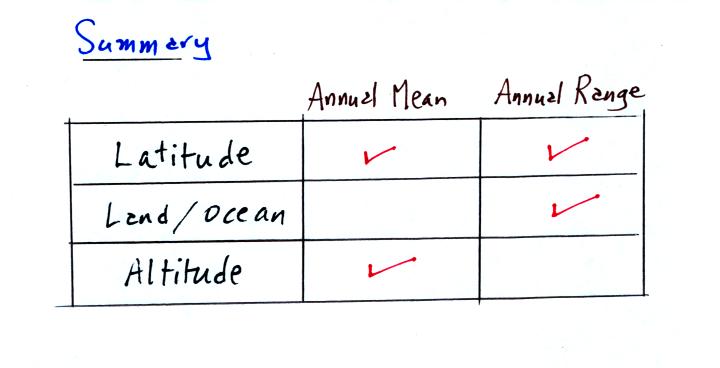
The table below summarizes the three controls of
temperature that we have covered so far. One of them
affects both the annual mean and annual range, one affects
just the mean, and the other just the annual range.
One final factor:
Cities on the west coast and east coast of the US
can have very different climates even if they are at the same
latitude and altitude. A cold southward flowing ocean
current is found along the West Coast. The warm Gulf
Stream current flows northward along the East Coast.
Winds at middle latitudes generally blow from west to
east. The city on the West Coast will feel the full
moderating effect of the ocean. The city on the East
Coast will be affected by the Gulf Stream current and also by
winds blowing across the interior of the US.
A graphical summary. You find cold locations
over land at high latitudes (Northern Canada, Siberia).
Antarctica is the coldest region because it is found at high
latitude, is a land mass, and much of Antarctica is high
altitude. The hottest regions on earth are found at low
altitude in the middle of land masses near 30 latitude.
What kind of climate would you expect to find at Point X in the figure
above. I.e. at a point near the Equator in the middle of
the Pacific Ocean? The answer to the question
includes a short story that features such things as carved
wooden pigs, tropical island beverages, and something called
betelnut.
The photograph above, taken on ,Kapingamarangi
Atoll (see also this gallery
of images), shows a group of people that were
participating in a very large international project called the
Tropical Ocean Global Atmosphere/Coupled Ocean Atmosphere Response
Experiment. The instructor of this course and one of the
other people in the photograph had just installed and tested the
tall white lightning detector seen at the edge of the
photograph. They were about to leave Kapingamarangi and
travel to Papua New Guinea to install detectors at two additional
sites.

It's not particularly easy to travel to Kapingamarangi, it is
very remote. At the time of our field experiment, we had to
first fly to Pohnpei
(an island in the Federated States of Micronesia). We
planned then to travel onboard a cargo ship that normally sails to
Kapingamarangi once a month. In our case we discovered,
after reaching Pohnpei, that the ship departure had been
delayed. We would eventually wait 3 weeks on the island of
Pohnpei before departing for Kapingamarangi. That gave us
plenty of time to visit and learn about the island of Pohnpei.
Pohnpei is a fairly large island and, together with some of the
other Micronesian islands, is a popular snorkeling and scuba
diving destination. Pohnpei also has a weather station
that is operated by the US National Atmospheric and Oceanic
Administration (NOAA).
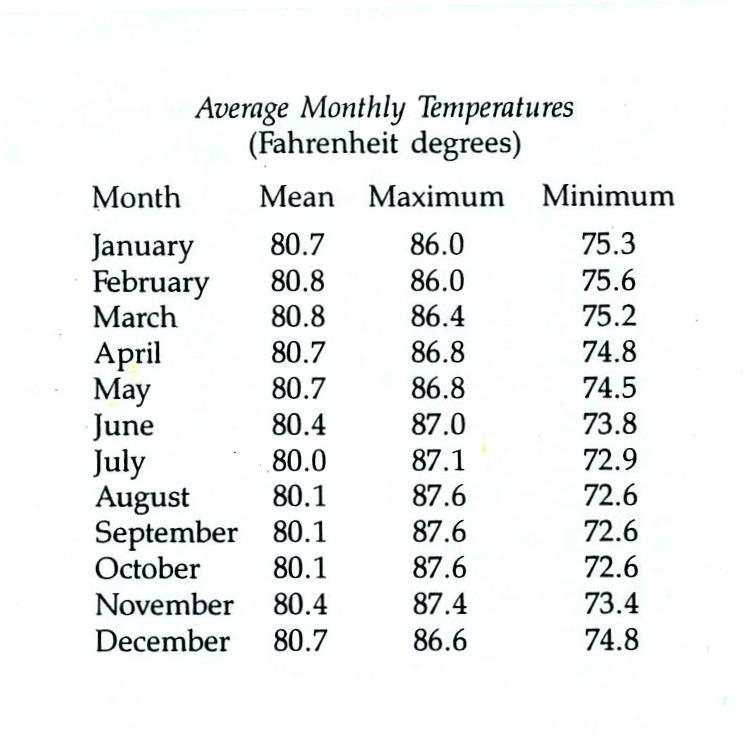
Pohnpei is located at low latitude in the middle of the Pacific
Ocean. Both of those factors will reduce the annual range of
temperature. The annual range is less than one
degree (it is about 34 F in Tucson)!
The average monthly temperatures in Pohnpei range from a high
of 80.8 F in February and March to a low of 80.0 F in July.
The all-time record high temperature is 96 F, it has never dropped
below 66 F on Pohnpei.The controls of temperature that
we have learned about can have quite an effect.
The following precipitation data for Kolonia, the largest
town on the island, show that Pohnpei is also one of the rainiest
locations on earth
Close to 400 inches of rain may fall in the interior of
Pohnpei. The rainiest location on earth is in Hawaii with
about 460 inches of rain per year.
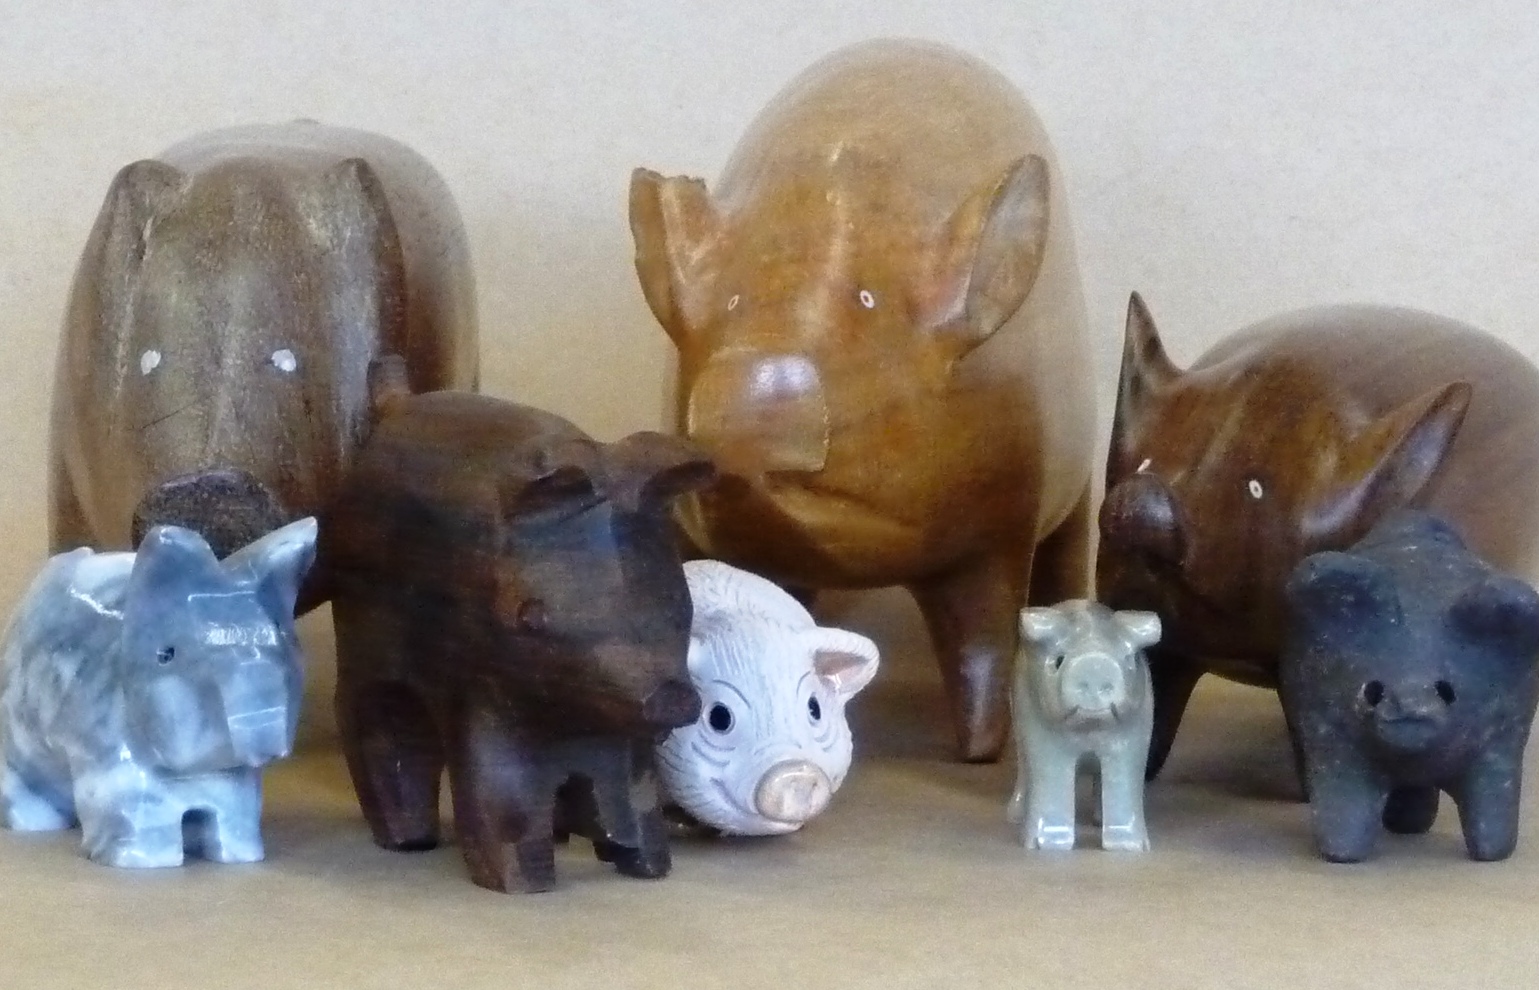
We learned quite a bit more about life in the tropics during our 3
weeks on Pohnpei. For example we saw a lot of pigs and
learned about their importance in the local culture and economy.
The Micro Glory (shown below) is the ship that carried us from
Pohnpei to Kapingamarangi and back. The ship carries
supplies to the people on Kapingamarangi and some other small
islands along the way. The islanders pay for the supplies
with pigs (the pigs are later sold on Pohnpei). We shared
deck space on the Micro Glory on the trip back to Pohnpei with 20
to 30 pigs (they were hoisted aboard in nets).
Most of the lower deck in the photo above (under the hoists)
was occupied by pigs on the return trip. One of the pigs
died on the return trip - that was a very serious matter.
We also had a chance to sample some of the local beverages.
Drinking kava or sakau (as it is called on Pohnpei) turns your
mouth and throat numb. It is supposed to relax you, make you
sleep more fully, and doesn't seem to have any after
effects. Until fairly recently you could buy kava in pill
form at local supermarkets. However, because of reports that
it can cause serious liver problems, that is no longer the
case. There are no reports of liver problems when drinking
kava that has been prepared in the traditional way. Here is a link to a
Wikipedia article on kava.
We never tried betelnut. Areca nuts are wrapped in betel
leaves and chewed together with lime (lime is pretty caustic, that
is one of the reasons I didn't try betelnut). The resulting
mixture is a mild stimulant (some people add tobacco to the
mix). The most interesting aspect, however, is that chewing
betelnut colors your mouth and teeth bright red.
You
don't
swallow
betelnut,
you
spit
it
out. You see the bright red stains on sidewalks and the
ground wherever you go. Most hotels will also have a large
sign near the entrance reminding guests not to chew betelnut
inside the hotel. You can read more about betelnut here.