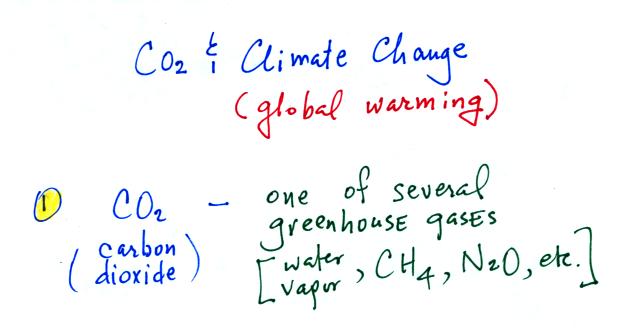
Carbon
dioxide
is
probably
the
best
known
of
the
greenhouse
gases
though
there
is
much
more water vapor in the atmosphere.
Much
of what we will say about CO2
applies to the other
greenhouse
gases as well.
Point
2.
Atmospheric CO2 concentrations
are
increasing, largely as a result of human activities.
This is generally accepted as fact. We'll look at some of
the evidence below.
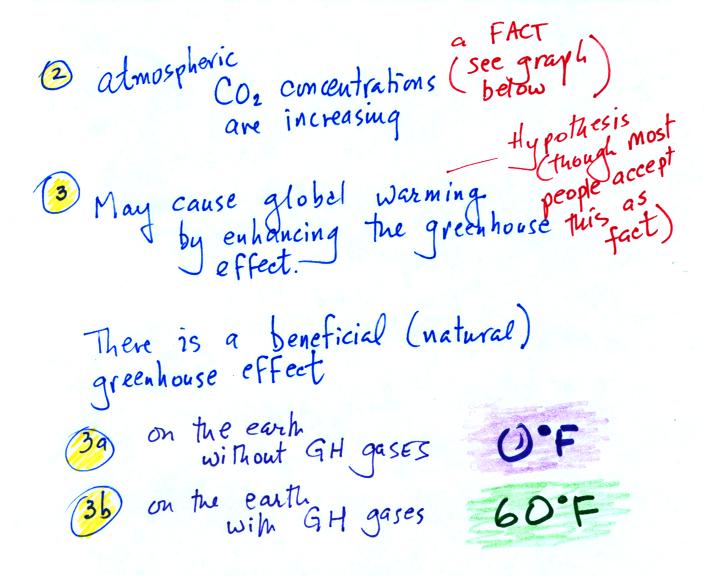
Point 3. The basic worry is that increasing greenhouse gas concentrations will strengthen the greenhouse effect and will cause the earth's surface to warm. This is a hypothesis, though many (perhaps the vast majority of) scientists regard this as fact and believe that enhanced greenhouse effect warming is already underway.
Before we look at enhancement of the greenhouse effect, it is important to remember that the greenhouse effect has a beneficial side. You might refer to this as the natural greenhouse effect (i.e. one that has not been affected or influenced by human activities)
Point 3a. If the earth's atmosphere did not contain any greenhouse gases, the global annual average surface temperature would be about 0o F. That's pretty cold.
Point 3b. The presence of greenhouse gases raises this average temperature to about 60o F and makes the earth a much more habitable place.
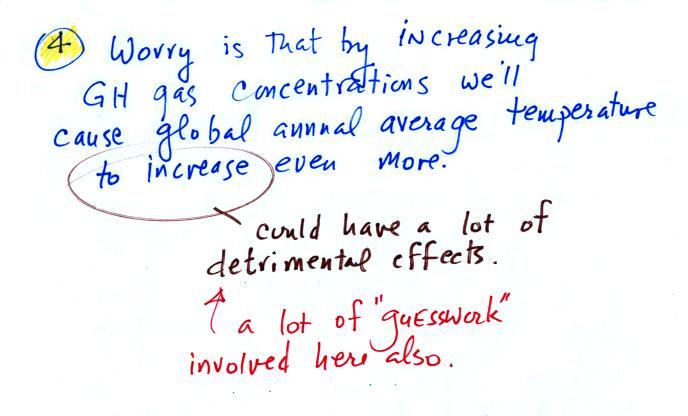
Point
4. The
concern is that increasing atmospheric greenhouse
gas concentrations might cause some additional warming (and we rely on
computer models to predict or estimate how much warming there will be
and how the amount of warming might depend on location). This
alone might not sound like a bad thing. However even a small
change in
average temperature might melt
polar ice and cause a rise in sea level that at the very
least might pose an environmental threat to coastal areas.
Warming might change weather patterns and
bring more precipitation to some areas and prolonged drought to other
places
(like
Arizona). Vectors that can carry serious tropical diseases (such
as malaria & dengue
fever) might spread
into more temperate areas. Plant and animal species might be
forced to
migrate in order to find a suitable environment; some might not
be able to adapt quickly enough and could go
extinct.
Now some of the experimental data that show atmospheric carbon dioxide concentrations are increasing.

The "Keeling" curve shows
measurements of CO2
that
were begun
(by a graduate student named Charles Keeling) in 1958 on top of the
Mauna Loa volcano in Hawaii (the air there is "clean" and not affected
by nearby cities and other sources of pollutants). Carbon dioxide
concentrations have increased from 315 ppm to about 385 ppm between
1958 and the present day. The small wiggles (one wiggle per year)
show that CO2
concentration
changes slightly during the course of a year (it probably also changes
slightly during the course of a day).
You'll find an up to date (and more carefully drawn) record of atmospheric CO2 concentration from the Mauna Loa observatory at the Scripps Institution of Oceanography site.
Once scientists saw this data they began to wonder about how CO2 concentrations might have been changing prior to 1958. But how could you now, in 2011 say, go back and measure the amount of CO2 in the atmosphere in the past? Scientists have found a very clever way of doing just that. It involves coring down into ice sheets that have been building up in Antarctica and Greenland for hundreds of thousands of years.
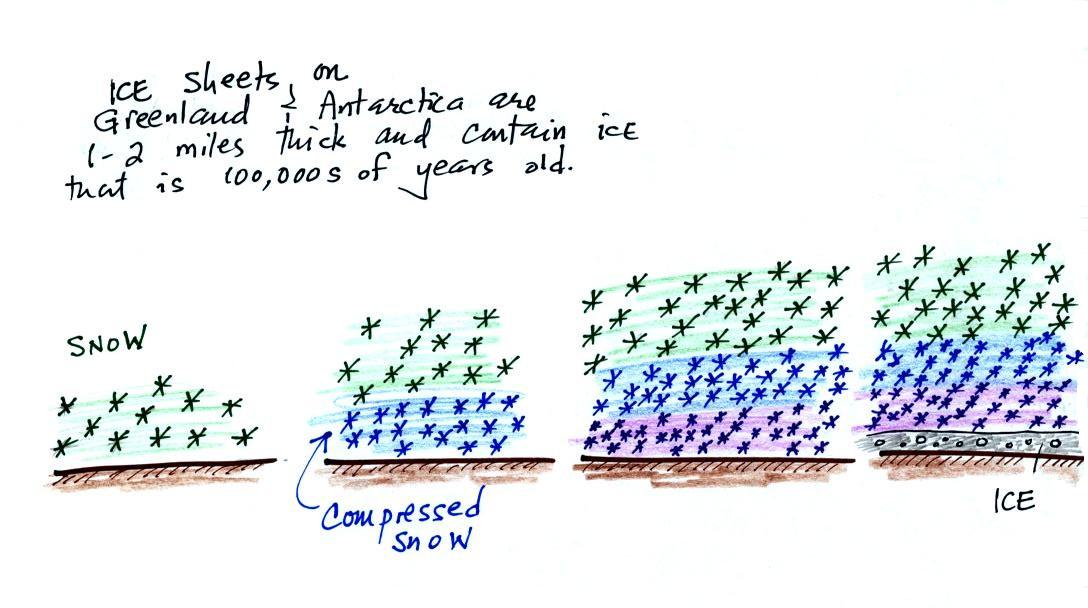
As layers of snow are piled on top of each other year after year, the snow at the bottom is compressed and eventually turns into a thin layer of solid ice. The ice contains small bubbles of air trapped in the snow, samples of the atmosphere at the time the snow originally fell. Scientists are able to date the ice layers and then take the air out of these bubbles and measure the carbon dioxide concentration. This isn't easy, the layers are very thin, the bubbles are small and it is hard to avoid contamination.
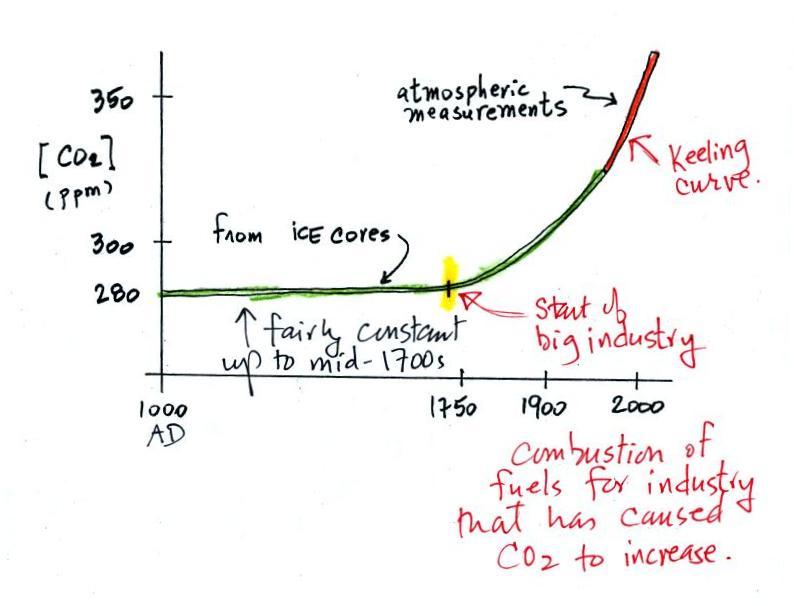
Using the ice core measurements scientists have determined that atmospheric CO2 concentration was fairly constant at about 280 ppm between 0 AD and the mid-1700s when it started to increase. The start of rising CO2 coincides with the beginning of the "Industrial Revolution." Combustion of fossil fuels needed to power factories began to add significant amounts of CO2 to the atmosphere.
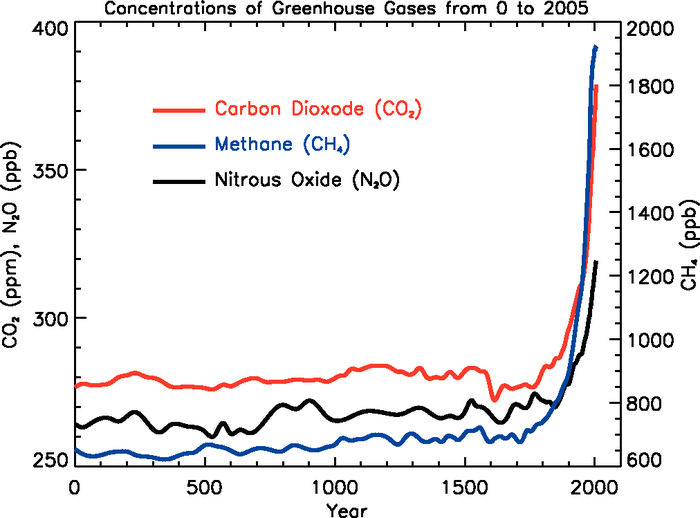
The figure with actual data from Climate
Change
2007,
IPCC
4th
Assessment
Report, shows that concentrations
of two other greeenhouse gases, methane and nitroux oxide, have been
increasing in much the same way CO2
has.
While most scientists attribute the current increase in CO2
to
human
activities,
natural
processes
can
also
cause
changes
in
atmospheric
CO2 concentration.
Only
several
hundred
years
of
ice
core
data
are
shown above, but the
data
actually extend back several hundred thousand years and CO2
concentrations vary between about 180 and 300 ppm. The
current increase is the largest and most rapid in the ice core record.
In order to understand why atmospheric carbon dioxide concentration is increasing, and before we look at what the earth's temperature has been doing during this period, we need to know how carbon dioxide is added to and removed from the atmosphere.
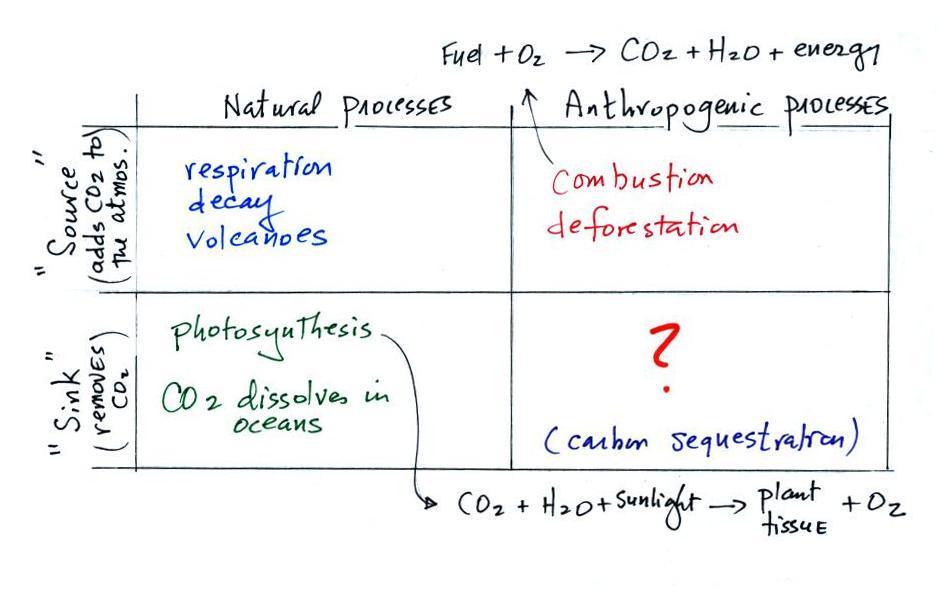
Carbon dioxide is added to the atmosphere naturally by respiration (animals breathe in oxygen and exhale carbon dioxide), decay, and volcanoes.
Combustion of fossil fuels, a human activity also adds CO2 to the atmosphere. Deforestation, cutting down and killing a tree will keep it from removing CO2 from the air by photosynthesis. The dead tree will also decay and release CO2 to the air.
CO2 is removed from the atmosphere by photosynthesis (the equation is shown above). CO2 also dissolves in the oceans.
The ? means your instructor is not aware of an anthropogenic process that removes significant amounts of carbon dioxide from the air. Though carbon sequestration (the capture/removal of CO2 from the air and storage) is something that is being considered to lessen or prevent global warming.
We are now able to better understand the yearly variation in atmospheric CO2 concentration (the "wiggles" on the Keeling Curve).

We assume that the release of CO2
to the air
remains constant throughout the year (the straight brown line
above). Photosynthesis (the green curve) will
change. Photosynthesis is highest in the summer when plants are
growing actively. It is lowest in the winter when many plants are
dead or dormant.
Atmospheric CO2 concentration will decrease as long as the rate of removal (photosynthesis) is greater than the rate of release (blue shaded portion above). Your bank account balance will drop as long as you spend more money than you deposit. The minimum occurs at the right end of the blue shaded portion where removal once again equals release.
The CO2 concentration will increase when release exceeds removal (red shaded section). The highest CO2 concentration occurs at the right end of the red shaded portion.
To really understand why human activities are causing atmospheric CO2 concentration to increase we need to look at the relative amounts of CO2 being added to and being removed from the atmosphere (like amounts of money moving into and out of a bank account and their effect on the account balance). A simplified version of the carbon cycle is shown below.

The carbon cycle show movement of carbon into and out of the atmosphere or ocean.
Here are the main points to take from this figure:
1. The underlined numbers show the amount of carbon stored in "reservoirs." For example 760 units* of carbon are stored in the atmosphere (predominantly in the form of CO2, but also in small amounts of CH4 (methane), CFCs and other gases; anything that contains carbon). Note that the atmosphere is a fairly small reservoir.
The other numbers show "fluxes," the amount of carbon moving into or out of the various reservoirs ( actually just into and out of the atmosphere ). Over land, respiration and decay add 120 units* of carbon to the atmosphere every year. Photosynthesis (primarily) removes 120 units every year.
2. Note the natural processes (color coded blue and green) are pretty much in balance (over land: 120 units added to the atmosphere and 120 units removed, over the oceans: 90 units added balanced by 90 units of carbon removed from the atmosphere every year). If these were the only processes present, the atmospheric concentration (760 units) wouldn't change.
3. Anthropogenic (man caused) emissions of carbon into the air are small compared to natural processes (orange in the figure). About 6.4 units are added during combustion of fossil fuels (and during the manufacture of cement) and 1.6 units are added every year because of deforestation (when trees are cut down they decay or are burned and add CO2 to the air, also because they are dead they aren't able to remove CO2 from the air by photosynthesis)
The rate at which carbon is added to the atmosphere by man is not balanced by an equal rate of removal: about half (4.6 of the 8) units added every year are removed (highlighted in yellow in the figure).
This small imbalance (8 - 4.6 = 3.6 units of carbon are added to the atmosphere every year) explains why atmospheric carbon dioxide concentrations are increasing with time. Note also that more carbon dioxide is added to the oceans every year than is removed. Addition of CO2 to the oceans might increase the acidity of the ocean water which might might make it more difficult for coral and sea shells to form (shells and coral are made of calcium carbonate CaCO3).
4. In the next 100 years or so, the 7500 units or so of carbon stored in the fossil fuels reservoir (lower left hand corner of the figure) might be dug up or pumped out of the ground and burned. That would add 7500 units of carbon to the air. The big question is how will the atmospheric concentration change and what effects will that have on climate? Carbon dioxide can move into and out of the atmosphere fairly quickly, movement into and out of some of the other reservoirs is slow. Thus it is difficult to say precisely how and how quickly the picture will change when it is perturbed.
*don't worry about the units. But here they are
just in case you are interested:
Reservoirs - Gtons
Fluxes - Gtons/year
A Gton = 1012 metric tons. (1 metric ton is 1000 kilograms or about 2200 pounds)
So here's where we're at.
Atmospheric CO2 concentration was fairly constant between 0 AD and the mid 1700s.
CO2 concentration has been increasing since the mid 1700s.
The obvious question is what has the temperature of the earth been doing during this period? In particular has there been any warming associated with the increases in greenhouse gases that have occurred since the mid 1700s?
We must address the temperature question in two parts.
First part:
Actual accurate measurements of temperature (on land and at sea)
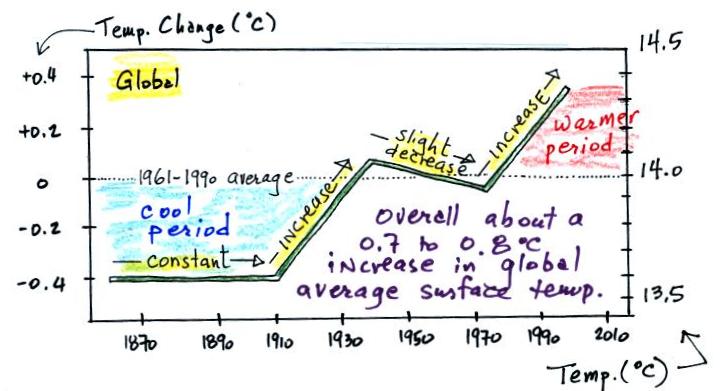
This figure is based on actual measurements of temperature made using reliable thermometers at many locations on land and sea around the globe. The left side of the figure shows how average temperatures at various time compare with the 1961 to 1990 average. The vertical axis on the right side of the plot shows actual global average surface tempeature values.
Temperature appears to have increased 0.7o to 0.8o C during this period. The increase hasn't been steady as you might have expected given the steady rise in CO2 concentration (and assuming that increasing CO2 is what's causing the earth to warm); temperature even decreased slightly between about 1940 and 1970. We can get some feel for how significant a 1oC change in global average temperature is by looking back perhaps 20,000 years when the earth was in the middle of a glacial period. At that time global average temperature was about 5o C cooler than at present and the Laurentide Ice Sheet covered most of Canada and a portion of the northern United States.
It is very difficult to detect a temperature change this small over this period of time. The instruments used to measure temperature have changed. The locations at which temperature measurements have been made have also changed (imagine what Tucson was like 130 years ago). About 2/3rds of the earth's surface is ocean and measurements were pretty sparce during much of this time period (sea surface temperatures can now be measured using satellites). Average surface temperatures naturally change a lot from year to year.
The year to year variation has been left out of the figure above so that the overall trend could be seen more clearly. The figure below does show the year to year variation (dotted black line) and the uncertainties (the green bars) in the yearly measurements (note how the uncertainty is lower in the more recent measurements).
Now some of the experimental data that show atmospheric carbon dioxide concentrations are increasing.
You'll find an up to date (and more carefully drawn) record of atmospheric CO2 concentration from the Mauna Loa observatory at the Scripps Institution of Oceanography site.
Once scientists saw this data they began to wonder about how CO2 concentrations might have been changing prior to 1958. But how could you now, in 2011 say, go back and measure the amount of CO2 in the atmosphere in the past? Scientists have found a very clever way of doing just that. It involves coring down into ice sheets that have been building up in Antarctica and Greenland for hundreds of thousands of years.
As layers of snow are piled on top of each other year after year, the snow at the bottom is compressed and eventually turns into a thin layer of solid ice. The ice contains small bubbles of air trapped in the snow, samples of the atmosphere at the time the snow originally fell. Scientists are able to date the ice layers and then take the air out of these bubbles and measure the carbon dioxide concentration. This isn't easy, the layers are very thin, the bubbles are small and it is hard to avoid contamination.
Using the ice core measurements scientists have determined that atmospheric CO2 concentration was fairly constant at about 280 ppm between 0 AD and the mid-1700s when it started to increase. The start of rising CO2 coincides with the beginning of the "Industrial Revolution." Combustion of fossil fuels needed to power factories began to add significant amounts of CO2 to the atmosphere.
In order to understand why atmospheric carbon dioxide concentration is increasing, and before we look at what the earth's temperature has been doing during this period, we need to know how carbon dioxide is added to and removed from the atmosphere.
Carbon dioxide is added to the atmosphere naturally by respiration (animals breathe in oxygen and exhale carbon dioxide), decay, and volcanoes.
Combustion of fossil fuels, a human activity also adds CO2 to the atmosphere. Deforestation, cutting down and killing a tree will keep it from removing CO2 from the air by photosynthesis. The dead tree will also decay and release CO2 to the air.
CO2 is removed from the atmosphere by photosynthesis (the equation is shown above). CO2 also dissolves in the oceans.
The ? means your instructor is not aware of an anthropogenic process that removes significant amounts of carbon dioxide from the air. Though carbon sequestration (the capture/removal of CO2 from the air and storage) is something that is being considered to lessen or prevent global warming.
We are now able to better understand the yearly variation in atmospheric CO2 concentration (the "wiggles" on the Keeling Curve).
Atmospheric CO2 concentration will decrease as long as the rate of removal (photosynthesis) is greater than the rate of release (blue shaded portion above). Your bank account balance will drop as long as you spend more money than you deposit. The minimum occurs at the right end of the blue shaded portion where removal once again equals release.
The CO2 concentration will increase when release exceeds removal (red shaded section). The highest CO2 concentration occurs at the right end of the red shaded portion.
To really understand why human activities are causing atmospheric CO2 concentration to increase we need to look at the relative amounts of CO2 being added to and being removed from the atmosphere (like amounts of money moving into and out of a bank account and their effect on the account balance). A simplified version of the carbon cycle is shown below.
The carbon cycle show movement of carbon into and out of the atmosphere or ocean.
Here are the main points to take from this figure:
1. The underlined numbers show the amount of carbon stored in "reservoirs." For example 760 units* of carbon are stored in the atmosphere (predominantly in the form of CO2, but also in small amounts of CH4 (methane), CFCs and other gases; anything that contains carbon). Note that the atmosphere is a fairly small reservoir.
The other numbers show "fluxes," the amount of carbon moving into or out of the various reservoirs ( actually just into and out of the atmosphere ). Over land, respiration and decay add 120 units* of carbon to the atmosphere every year. Photosynthesis (primarily) removes 120 units every year.
2. Note the natural processes (color coded blue and green) are pretty much in balance (over land: 120 units added to the atmosphere and 120 units removed, over the oceans: 90 units added balanced by 90 units of carbon removed from the atmosphere every year). If these were the only processes present, the atmospheric concentration (760 units) wouldn't change.
3. Anthropogenic (man caused) emissions of carbon into the air are small compared to natural processes (orange in the figure). About 6.4 units are added during combustion of fossil fuels (and during the manufacture of cement) and 1.6 units are added every year because of deforestation (when trees are cut down they decay or are burned and add CO2 to the air, also because they are dead they aren't able to remove CO2 from the air by photosynthesis)
The rate at which carbon is added to the atmosphere by man is not balanced by an equal rate of removal: about half (4.6 of the 8) units added every year are removed (highlighted in yellow in the figure).
This small imbalance (8 - 4.6 = 3.6 units of carbon are added to the atmosphere every year) explains why atmospheric carbon dioxide concentrations are increasing with time. Note also that more carbon dioxide is added to the oceans every year than is removed. Addition of CO2 to the oceans might increase the acidity of the ocean water which might might make it more difficult for coral and sea shells to form (shells and coral are made of calcium carbonate CaCO3).
4. In the next 100 years or so, the 7500 units or so of carbon stored in the fossil fuels reservoir (lower left hand corner of the figure) might be dug up or pumped out of the ground and burned. That would add 7500 units of carbon to the air. The big question is how will the atmospheric concentration change and what effects will that have on climate? Carbon dioxide can move into and out of the atmosphere fairly quickly, movement into and out of some of the other reservoirs is slow. Thus it is difficult to say precisely how and how quickly the picture will change when it is perturbed.
Reservoirs - Gtons
Fluxes - Gtons/year
A Gton = 1012 metric tons. (1 metric ton is 1000 kilograms or about 2200 pounds)
So here's where we're at.
Atmospheric CO2 concentration was fairly constant between 0 AD and the mid 1700s.
CO2 concentration has been increasing since the mid 1700s.
The obvious question is what has the temperature of the earth been doing during this period? In particular has there been any warming associated with the increases in greenhouse gases that have occurred since the mid 1700s?
We must address the temperature question in two parts.
First part:
Actual accurate measurements of temperature (on land and at sea)
This figure is based on actual measurements of temperature made using reliable thermometers at many locations on land and sea around the globe. The left side of the figure shows how average temperatures at various time compare with the 1961 to 1990 average. The vertical axis on the right side of the plot shows actual global average surface tempeature values.
Temperature appears to have increased 0.7o to 0.8o C during this period. The increase hasn't been steady as you might have expected given the steady rise in CO2 concentration (and assuming that increasing CO2 is what's causing the earth to warm); temperature even decreased slightly between about 1940 and 1970. We can get some feel for how significant a 1oC change in global average temperature is by looking back perhaps 20,000 years when the earth was in the middle of a glacial period. At that time global average temperature was about 5o C cooler than at present and the Laurentide Ice Sheet covered most of Canada and a portion of the northern United States.
It is very difficult to detect a temperature change this small over this period of time. The instruments used to measure temperature have changed. The locations at which temperature measurements have been made have also changed (imagine what Tucson was like 130 years ago). About 2/3rds of the earth's surface is ocean and measurements were pretty sparce during much of this time period (sea surface temperatures can now be measured using satellites). Average surface temperatures naturally change a lot from year to year.
The year to year variation has been left out of the figure above so that the overall trend could be seen more clearly. The figure below does show the year to year variation (dotted black line) and the uncertainties (the green bars) in the yearly measurements (note how the uncertainty is lower in the more recent measurements).
These data are from the
NASA Goddard
Institute for Space Studies site.
These temperatures are compared to a different, 1951-1980, thirty year mean.
Temperatures prior to about 1930 were colder than the 1951-1980 mean and temperatures after 1980 were warmer.
Here's another plot of global temperature change over a slightly longer time period
from the University of East Anglia Climatic Research Unit
The
overall tendency seems to be the same
in both cases.
We should mention that the observed warming has not been uniformly distributed over the surface of the earth. Data from the 2000-2009 period shows the that greatest warming occurred in the Arctic.
Second Part
Now it would be interesting to know how temperature was changing prior to the mid-1800s. This is similar to what happened when the scientists wanted to know what carbon dioxide concentrations looked like prior to 1958. In that case they were able to go back and analyze air samples from the past (air trapped in bubbles in ice sheets).
That doesn't work with temperature. To understand why, imagine putting some air in a bottle, sealing the bottle, putting the bottle on a shelf, and letting it sit for 100 years. In 2111 you could take the bottle down from the shelf, carefully remove the air, and measure what the CO2 concentration in the air had been in 2011 when the air was sealed in the bottle. You couldn't, in 2111, use the air in the bottle to determine what the temperature of the air was when it was originally put into the bottle in 2011.
With temperature you need to use proxy data. You need to look for something else whose presence, concentration, or composition depended on the temperature at some time in the past.
Here's a proxy data "example."
Let's say you want to determine how many students are living in a house near a university.
We should mention that the observed warming has not been uniformly distributed over the surface of the earth. Data from the 2000-2009 period shows the that greatest warming occurred in the Arctic.
Second Part
Now it would be interesting to know how temperature was changing prior to the mid-1800s. This is similar to what happened when the scientists wanted to know what carbon dioxide concentrations looked like prior to 1958. In that case they were able to go back and analyze air samples from the past (air trapped in bubbles in ice sheets).
That doesn't work with temperature. To understand why, imagine putting some air in a bottle, sealing the bottle, putting the bottle on a shelf, and letting it sit for 100 years. In 2111 you could take the bottle down from the shelf, carefully remove the air, and measure what the CO2 concentration in the air had been in 2011 when the air was sealed in the bottle. You couldn't, in 2111, use the air in the bottle to determine what the temperature of the air was when it was originally put into the bottle in 2011.
With temperature you need to use proxy data. You need to look for something else whose presence, concentration, or composition depended on the temperature at some time in the past.
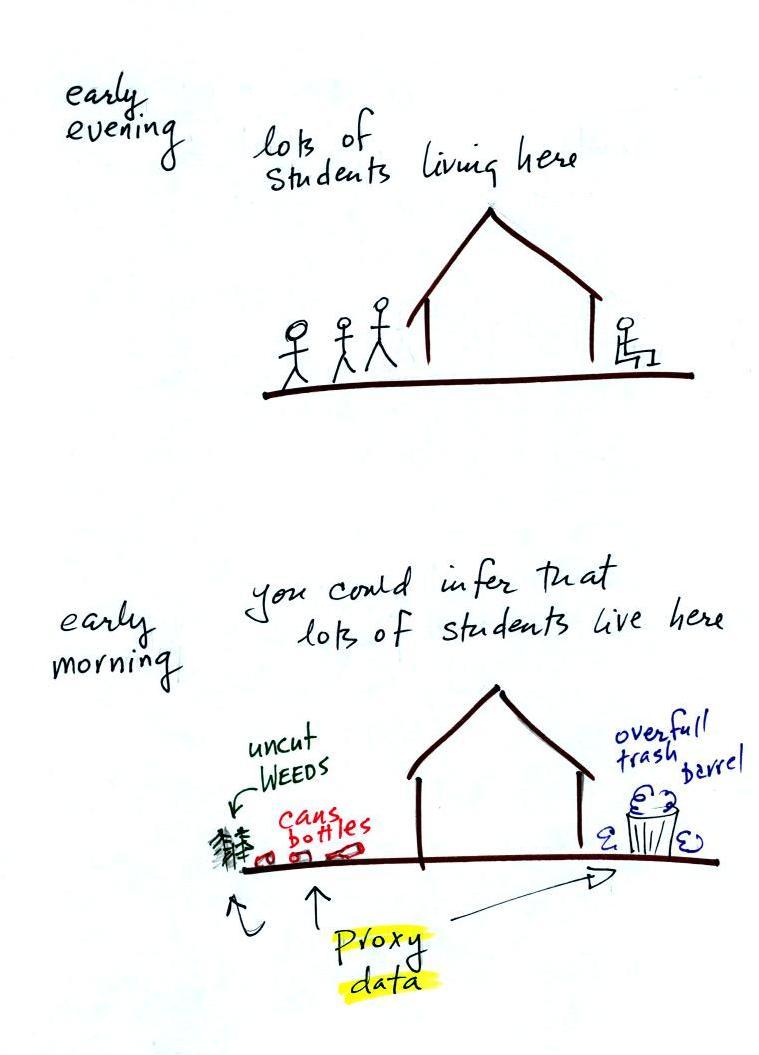
Let's say you want to determine how many students are living in a house near a university.
You
could walk by the house late in
the afternoon, when the students would likely be outside, and count
them.
That
would be a direct measurement (this would be like measuring temperature
with a thermometer). There could still be some errors in your
measurement (some students might be inside the house and might not be
counted, some of
the people outside might not live at the house).
If you were to walk by early in the morning it is likely that the students would be inside sleeping. In that case you might look for other clues (such as the number of empty bottles in the yard) that might give you an idea of how many students lived in that house. You would use these proxy data to come up with an estimate of the number of students inside the house.
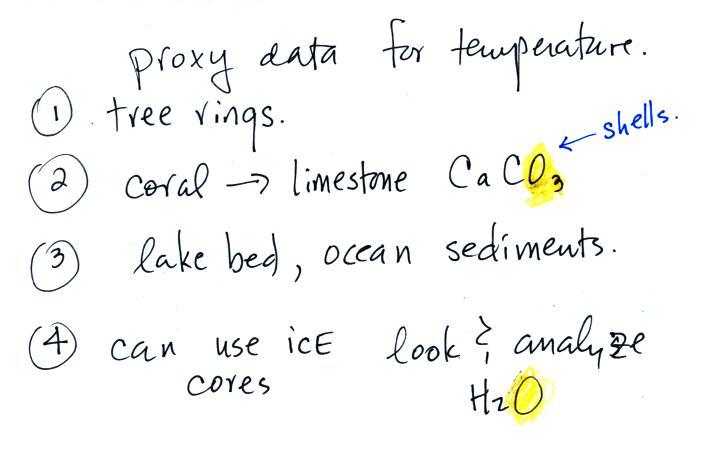
In the case of temperature scientists look
at a variety of
things.
They look at tree rings.
If you were to walk by early in the morning it is likely that the students would be inside sleeping. In that case you might look for other clues (such as the number of empty bottles in the yard) that might give you an idea of how many students lived in that house. You would use these proxy data to come up with an estimate of the number of students inside the house.
They look at tree rings.
The
width
of
each
yearly
ring
depends
on
the
depends
on
the
temperature
and
precipitation
at the time the ring formed.
They
analyze
coral.
Coral
is
made
up
of
calcium
carbonate,
a
molecule
that
contains
oxygen.
The
relative
amounts of the oxygen-16 and
oxygen-18
isotopes depends
on the temperature that existed at the time the coral grew.
Scientists
can analyze lake bed and ocean
sediments.
The
types
of
plant
and
animal
fossils
that
they
find
depend
on
the
water
temperature at the time.
They can
even use the ice
cores.
The
ice,
H2O,
contains
oxygen
and the relative
amounts of oxygen and hydrogen isotopes depends on the temperature at
the time the ice
fell from the sky as snow.
Here's an
idea of how oxygen isotope data
can be used to determine past
temperature.
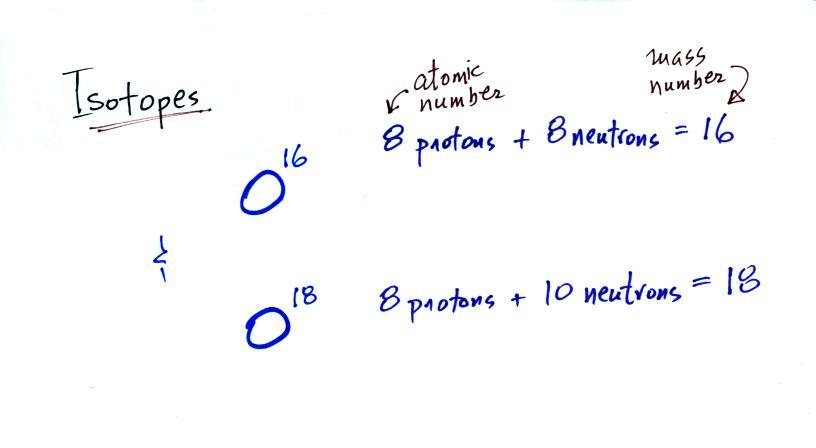
The
two isotopes
of
oxygen contain different numbers of neutrons in their
nuclei. Both atoms have the same number of protons.
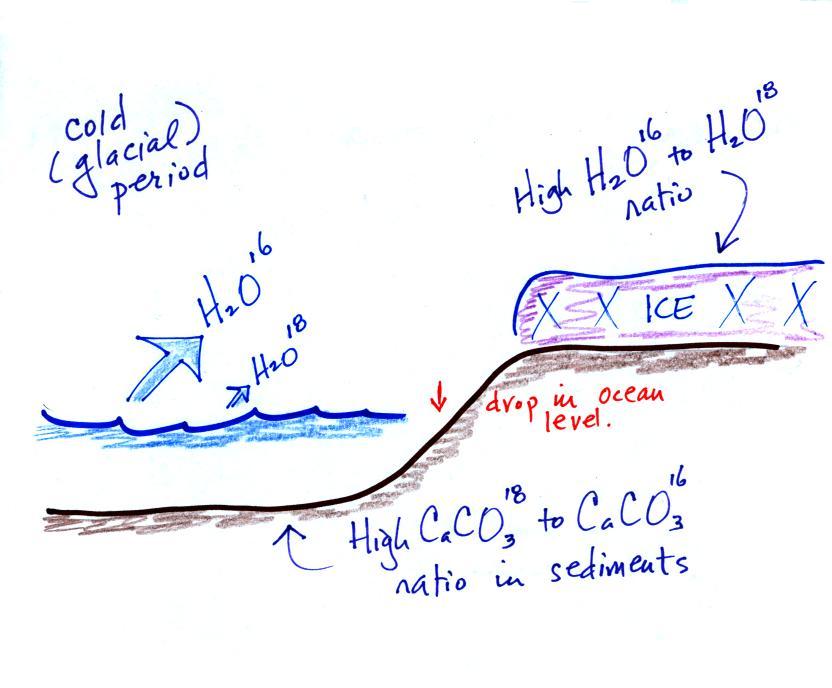
During a cold
period,
the H2O16 form of
water
evaporates more rapidly
than the H2O18
form. You would find
relatively large
amounts of O16 in glacial
ice. Since most of the H2O18
remains in
the ocean, it is found in relatively high amounts in calcium carbonate
in ocean sediments. Note
also the drop in ocean levels during
colder periods when much of the ocean water is found in ice sheets on
land.
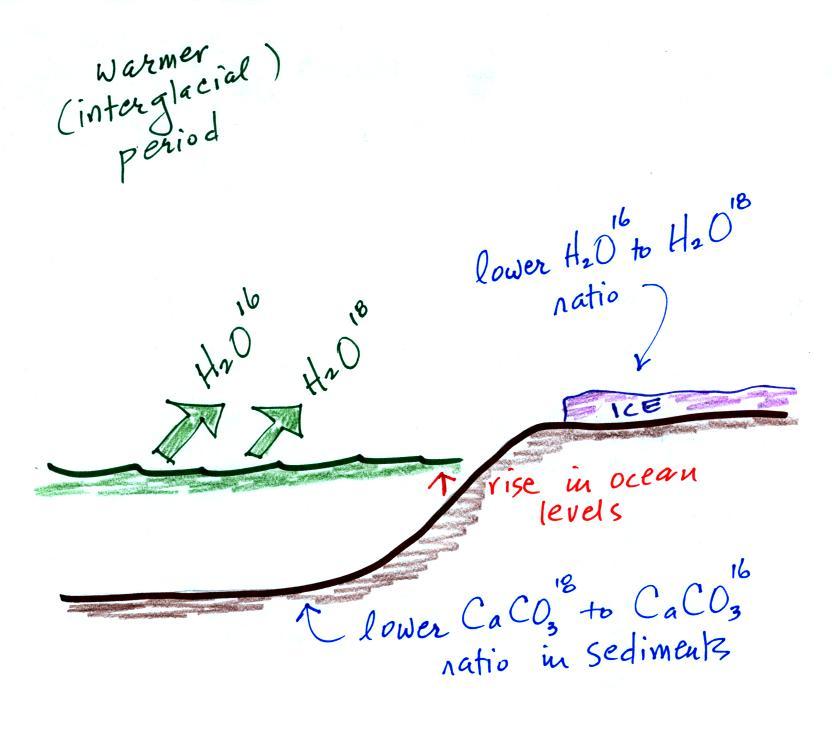
The reverse is
true
during warmer periods.
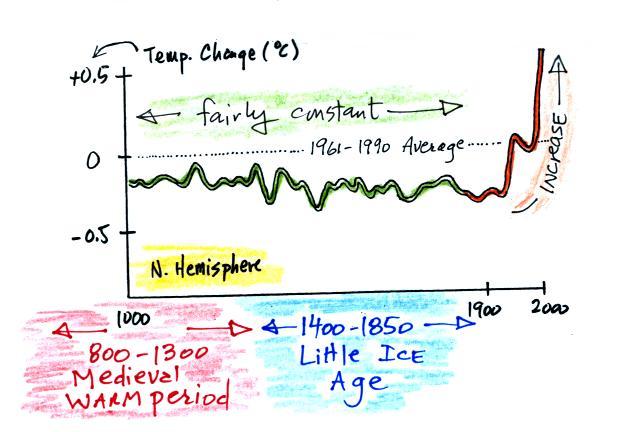
Using proxy data scientists have been able to estimate average surface temperatures for 100,000s of years into the past. The next figure shows what temperature has been doing since 1000 AD. This is for the northern hemisphere only, not the globe.
Using proxy data scientists have been able to estimate average surface temperatures for 100,000s of years into the past. The next figure shows what temperature has been doing since 1000 AD. This is for the northern hemisphere only, not the globe.
The
major portion of the figure shows the estimates of temperature (again
relative to the 1961-1990 mean) derived from proxy data. The
instrumental measurements were made between about 1850 and the present
day. The figure above just shows the overall trend in
temperatures during the past 1000 years. The actual data that the
curve above is based on is shown below.
This is the so called "Hockey Stick Plot" originally published in 1999 by Mann, Bradley, and Hughes (and included in Climate Change 2001 - The Scientific Basis, Contribution of Working Group I to the 3rd Assessment Report of the Intergovernmental Panel on Climate Change (IPCC)).
Many scientists would argue that this graph is strong support of a connection between rising atmospheric greenhouse gas concentrations and recent global warming. Early in this time interval when CO2 concentration was constant, there is only modest changes in temperature change. The largest overall change in temperature begins in about 1900 when we know an increase in atmospheric carbon dioxide concentrations was underway. The second half of the 20th century is the warmest period in at least the past 1000 years.
Some scientists have questioned the statistical methods used in the study. Additionally there is historical evidence in Europe of a medieval warm period lasting from 800 AD to - 1300 AD or so and a cold period, the "Little Ice Age, " which lasted from about 1400 AD to the mid 1800s. These are not clearly apparent in the temperature plot above. This leads some scientists to question the validity of this temperature reconstruction. Scientists also suggest that if large changes in climate such as the Medieval warm period and the Little Ice Age can occur naturally, then maybe the warming that is occurring at the present time also has a natural cause.
The so-called Year Without a Summer occurred in 1816, toward the end of the Little Ice Age. The unusally cold summer temperatures were apparently caused by a very large volcanic eruption the year before. Here's a short explanation of how volcanoes can cause short term climate changes.
More recent temperature reconstructions have confirmed the overall trend shown in the figure above.
This is from the University of East Anglia Climatic Research Unit again. The following figure (source) extends the temperature reconstruction back 2000 years.

There are somewhat larger temperature variations associated with the Medieval Warm Period and the Little Ice Age (though there is some question whether these were global and not global events) in these two figures. In both figures again the late 20th century has the warmest temperatures in the period.
We'll end this first lecture at this point. Here's a brief summary of where we stand:
There is general agreement that atmospheric CO2 and other greenhouse gas concentrations are increasing and that the earth is warming
Not everyone agrees on the causes (natural or manmade) of the warming.
In the next lecture we will look at estimates of how much additional warming there will be and at some of the effects that the predicted warming will have.
This is the so called "Hockey Stick Plot" originally published in 1999 by Mann, Bradley, and Hughes (and included in Climate Change 2001 - The Scientific Basis, Contribution of Working Group I to the 3rd Assessment Report of the Intergovernmental Panel on Climate Change (IPCC)).
Many scientists would argue that this graph is strong support of a connection between rising atmospheric greenhouse gas concentrations and recent global warming. Early in this time interval when CO2 concentration was constant, there is only modest changes in temperature change. The largest overall change in temperature begins in about 1900 when we know an increase in atmospheric carbon dioxide concentrations was underway. The second half of the 20th century is the warmest period in at least the past 1000 years.
Some scientists have questioned the statistical methods used in the study. Additionally there is historical evidence in Europe of a medieval warm period lasting from 800 AD to - 1300 AD or so and a cold period, the "Little Ice Age, " which lasted from about 1400 AD to the mid 1800s. These are not clearly apparent in the temperature plot above. This leads some scientists to question the validity of this temperature reconstruction. Scientists also suggest that if large changes in climate such as the Medieval warm period and the Little Ice Age can occur naturally, then maybe the warming that is occurring at the present time also has a natural cause.
The so-called Year Without a Summer occurred in 1816, toward the end of the Little Ice Age. The unusally cold summer temperatures were apparently caused by a very large volcanic eruption the year before. Here's a short explanation of how volcanoes can cause short term climate changes.
More recent temperature reconstructions have confirmed the overall trend shown in the figure above.
This is from the University of East Anglia Climatic Research Unit again. The following figure (source) extends the temperature reconstruction back 2000 years.
There are somewhat larger temperature variations associated with the Medieval Warm Period and the Little Ice Age (though there is some question whether these were global and not global events) in these two figures. In both figures again the late 20th century has the warmest temperatures in the period.
We'll end this first lecture at this point. Here's a brief summary of where we stand:
There is general agreement that atmospheric CO2 and other greenhouse gas concentrations are increasing and that the earth is warming
Not everyone agrees on the causes (natural or manmade) of the warming.
In the next lecture we will look at estimates of how much additional warming there will be and at some of the effects that the predicted warming will have.