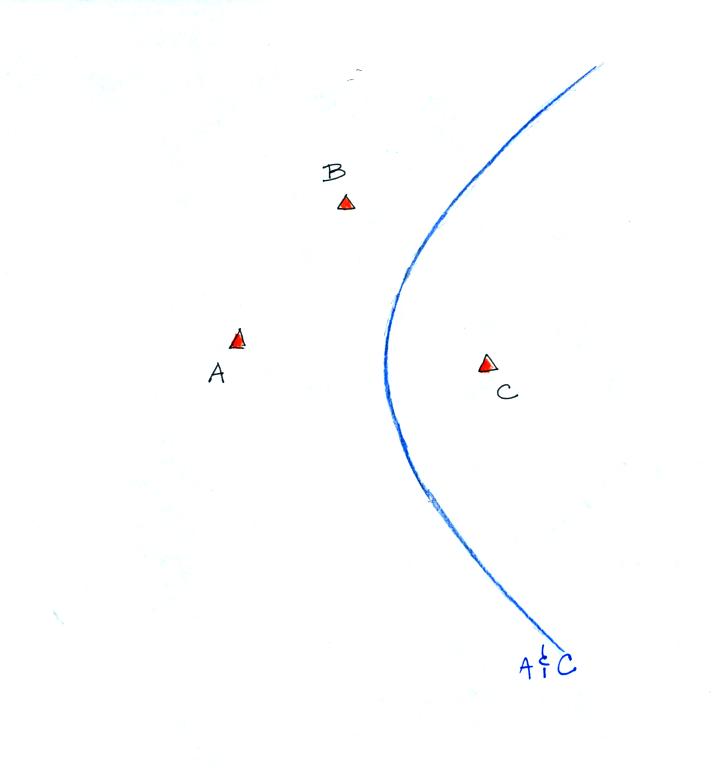
The difference in the
times of arrival at Sensors A & C will be the same for lightning
striking anywhere along the blue line.
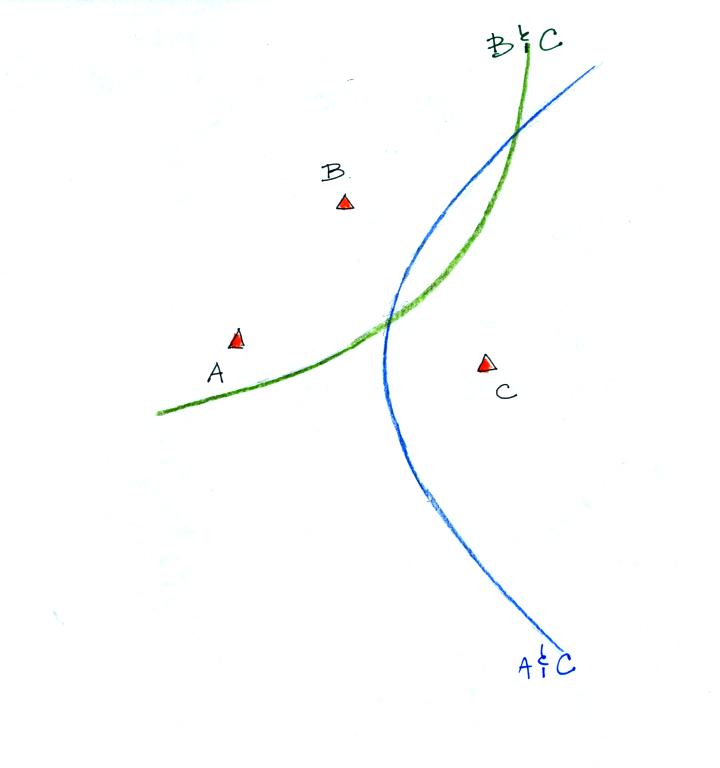

We've added the hyperbola of
constant TOA difference for Sensors B & C. But there are two
intersections.
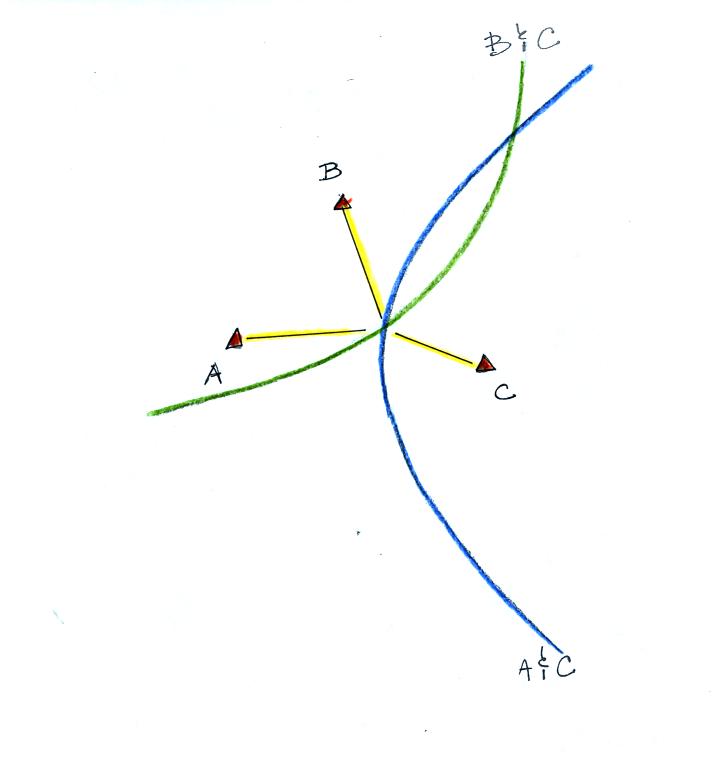

You could resolve the location
uncertainty using magnetic bearing angles from the 3 sensors.
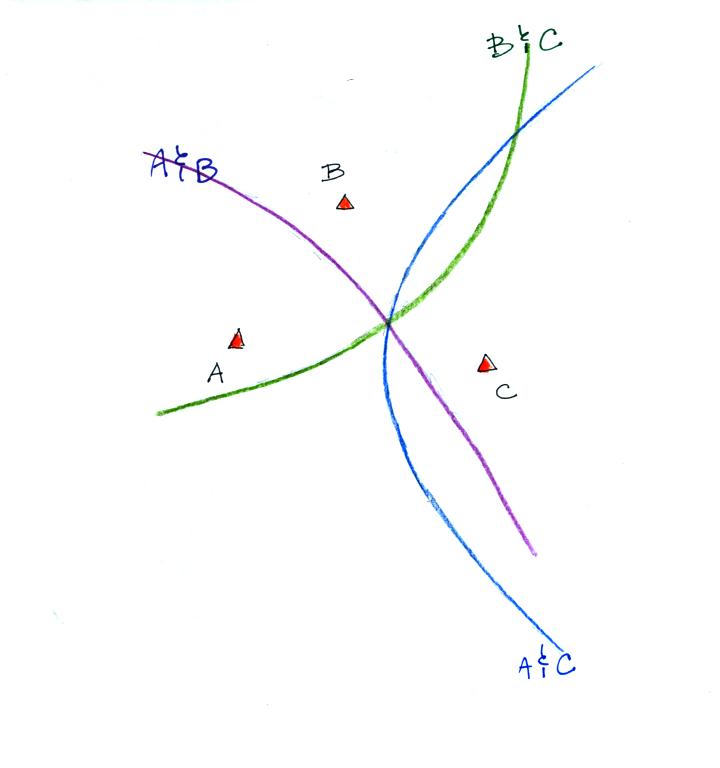

Or you could draw another hyperbola
- the curve of constant TOA difference for sensors A & B.

Or you could do all of the above.

Example of a strike detected by 5 sensors. The 3 IMPACT
sensors provide bearing angle and TOA information, the LPATS sensors
just TOA data.
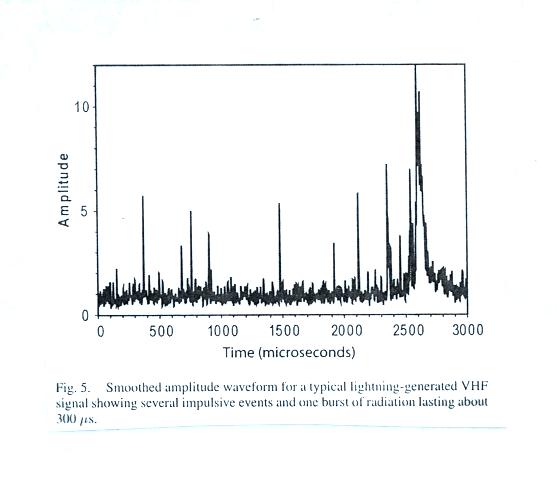
An important RF signal example


An important RF signal example

RF signals were sent to the central
station using microwave links. The data were displayed on
oscilloscopes and photographed.
"After about 2 years experience a good data reader can unscramble the pulses emitted by no less than 4 simultaneous flashes, or widely spaced branches of the same flash with a considerable degree of confidence."
"Even those who enjoy reading reading records that can be deciphered easily found that reading the more complicated variety was a mild from of torture, and that it took about one man-month's effort to locate 100 sources correctly."
On average they located the source of one pulse in every 70 microseconds of record.

2-D TOA locating using 3 stations on a straight baseline. To get 3-D locations, you need a second baseline.
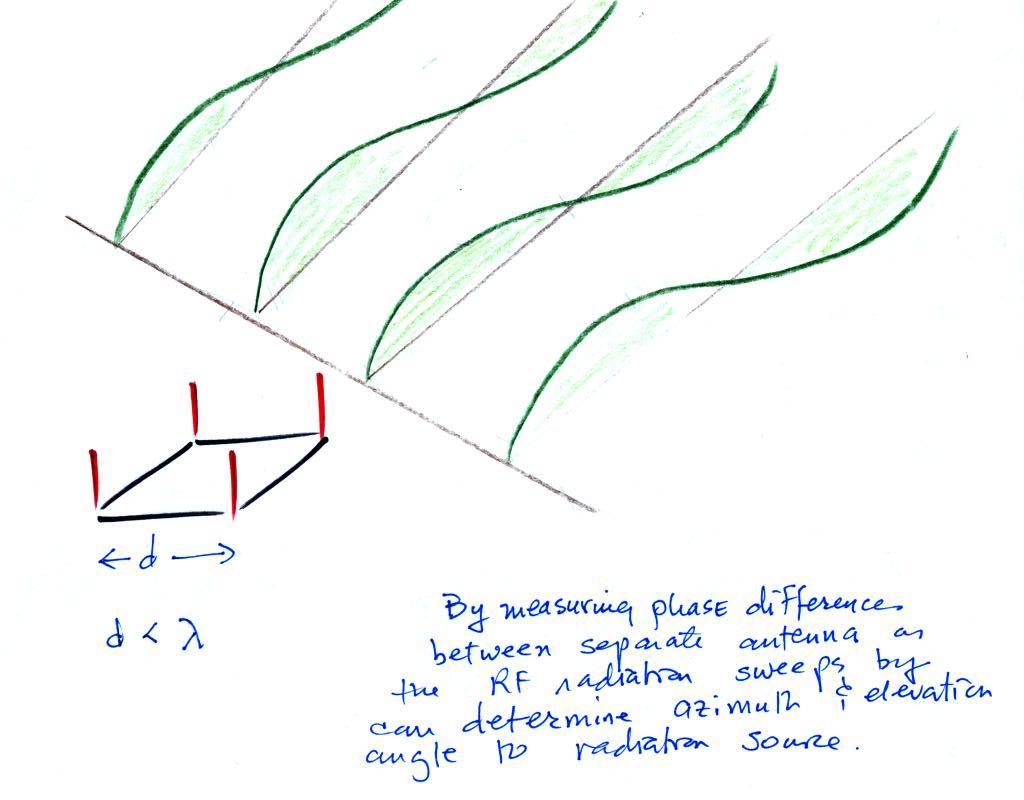
Vaisala sensors
New Mexico Tech Lightning Mapping Array
"After about 2 years experience a good data reader can unscramble the pulses emitted by no less than 4 simultaneous flashes, or widely spaced branches of the same flash with a considerable degree of confidence."
"Even those who enjoy reading reading records that can be deciphered easily found that reading the more complicated variety was a mild from of torture, and that it took about one man-month's effort to locate 100 sources correctly."
On average they located the source of one pulse in every 70 microseconds of record.

2-D TOA locating using 3 stations on a straight baseline. To get 3-D locations, you need a second baseline.

Vaisala sensors
New Mexico Tech Lightning Mapping Array