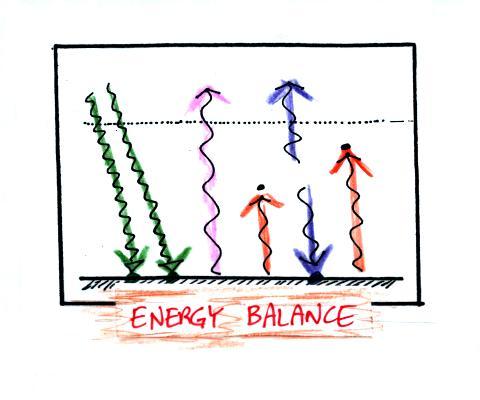
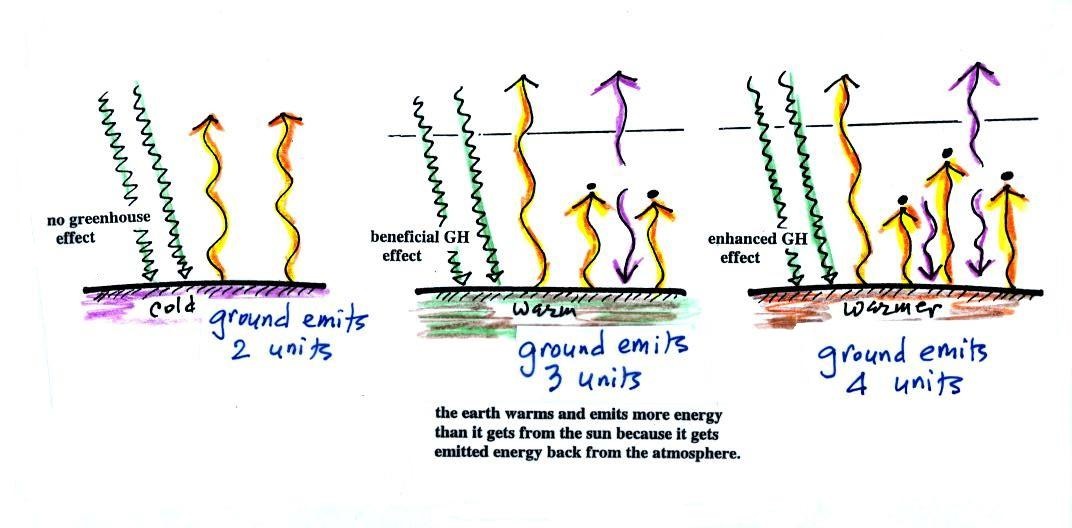
The figure (p. 72c in the photocopied Class
Notes) on the left shows energy balance on the earth without
an atmosphere (or with an atmosphere that doesn't contain
greenhouse gases). The ground achieves energy balance by
emitting only 2 units of energy to balance out what it is
getting from the sun. The ground wouldn't need to be
very warm to do this, only 0 F.
If you add an atmosphere and greenhouse gases, the
atmosphere will begin to absorb some of the outgoing IR
radiation. The atmosphere will also begin to emit IR
radiation, upward into space and downward toward the
ground. After a period of adjustment you end up with a
new energy balance. The ground is warmer and is now
emitting 3 units of energy even though it is only getting 2
units from the sun. It can do this because it gets a
unit of energy from the atmosphere. This is what I refer
to as the beneficial greenhouse effect. It makes the
earth more habitable by raising the average surface
temperature to 60 F.
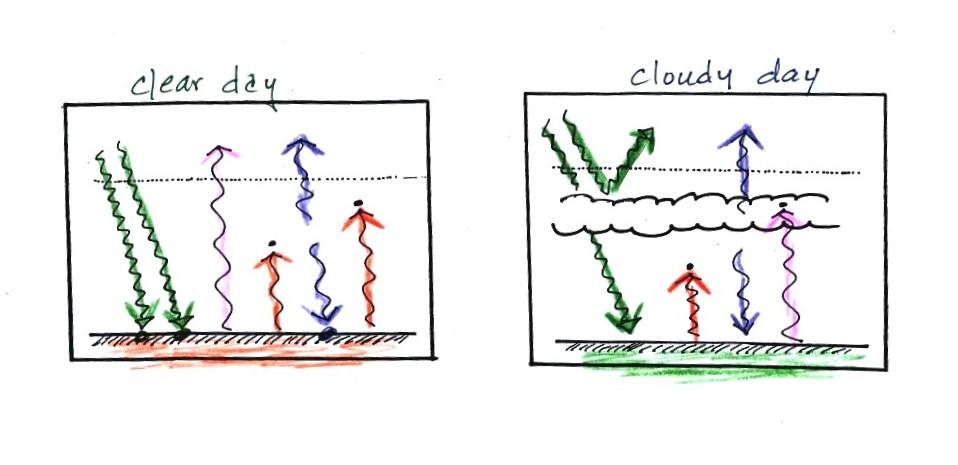
In the right figure the concentration of greenhouse gases
has increased even more (due to human activities). The
earth might find a new energy balance. In this case the
ground would be warmer and could be emitting 4 units of
energy, but still only getting 2 units from the sun.
With more greenhouse gases, the atmosphere is now able to
absorb 3 units of the IR emitted by the ground. The
atmosphere sends 2 back to the ground and 1 up into
space. A new balance is achieved but the earth's surface
is warmer. How much warmer? That's the big
question.
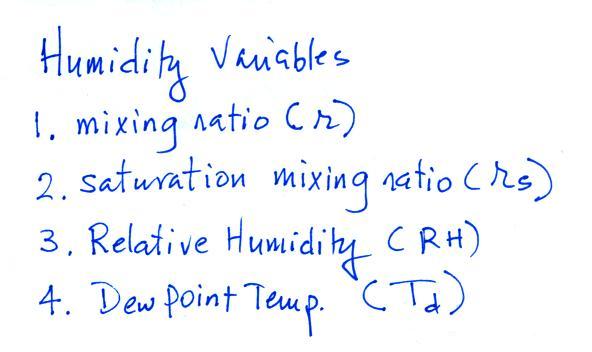
Next a new topic: humidity
variables
Now a new block
of material on humidity and an introduction to
humidity variables. This topic and
the terms that we will be learning are probably new
and might be confusing. That's the reason for
this introduction. We will be mainly
be interested in 4 variables:
Your task will be to learn the
"jobs" of these variables, their units, and what can cause
them to change value.
An In-Class
Optional Assignment was handed out in class. You
were supposed to complete and turn in the assignment at the
end of class. If you weren't in class you can download
the assignment and turn it in before the start of class on
Thursday.
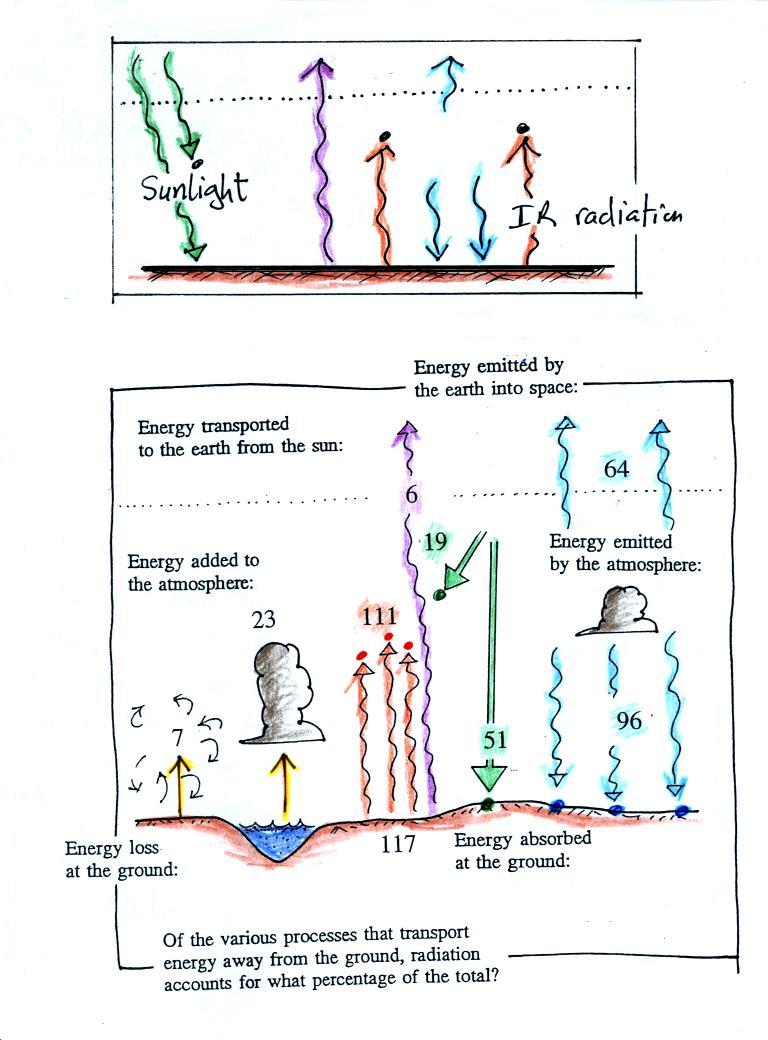
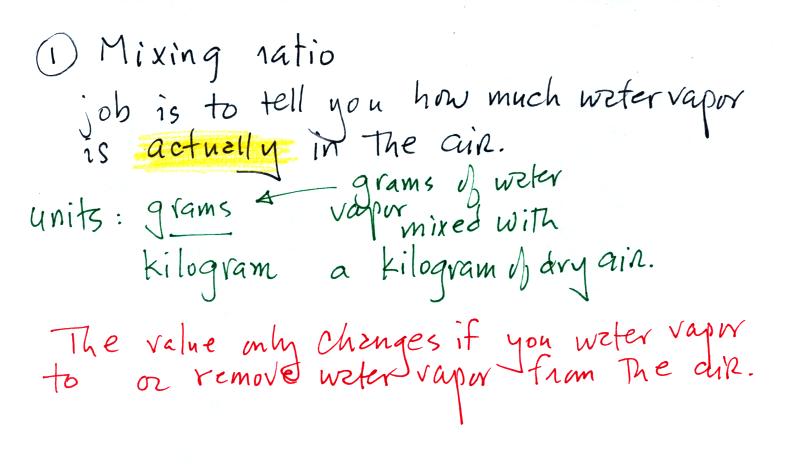
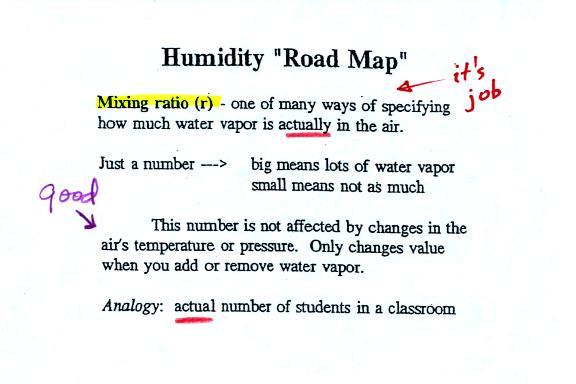
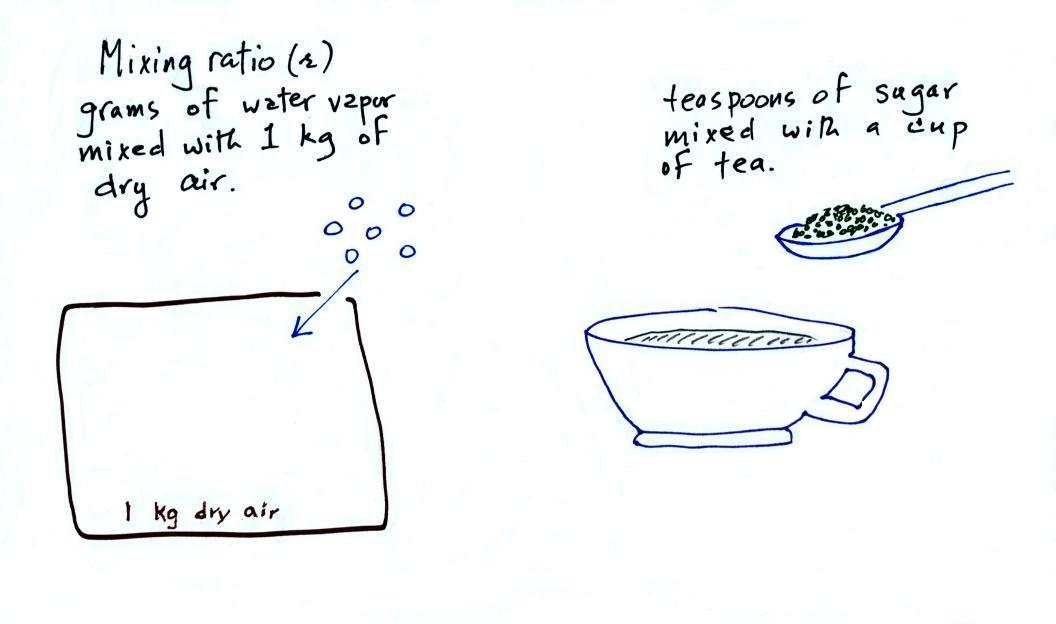
Mixing ratio
The bottom half of the figure below can be found on p. 83 in
the ClassNotes.
Mixing ratio tells you how much water vapor
is actually
in the air. Mixing ratio has units of grams of
water vapor per kilogram of dry air (the amount of water vapor
in grams mixed with a kilogram of dry air). A kilogram
of air is about one cubic meter of air (about one cubic yard
of air). Mixing ratio is basically the same idea as teaspoons
of sugar mixed in a cup of tea.
The value of the mixing
ratio won't change unless you add water vapor to or remove
water vapor from the air. Warming the air won't
change the mixing ratio. Cooling the air won't
change the mixing ratio (with one exception - when the air is
cooled below its dew point temperature and water vapor
starts to condense). Since the mixing ratio's job is
to tell you how much water vapor is in the air, you don't
want it to change unless water vapor is actually added to
or removed from the air.
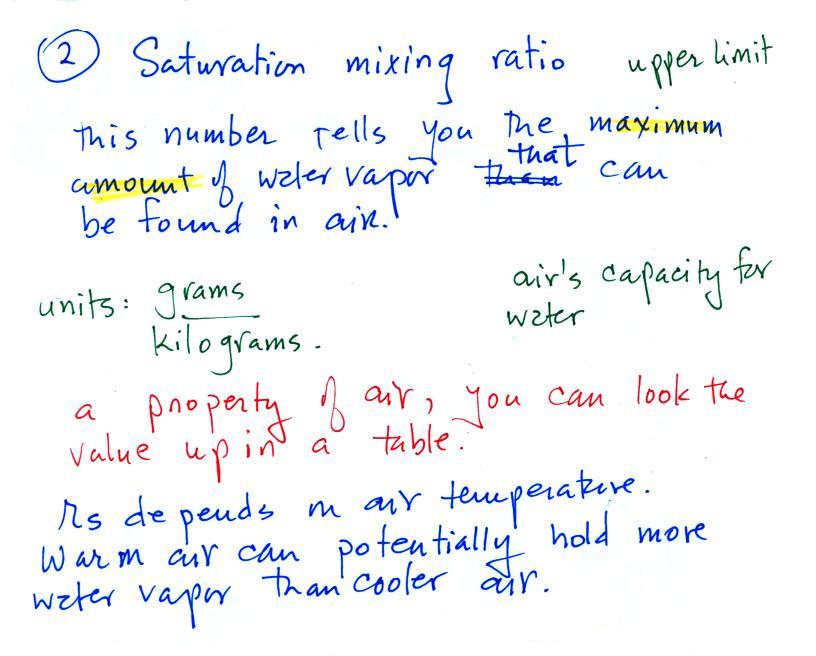
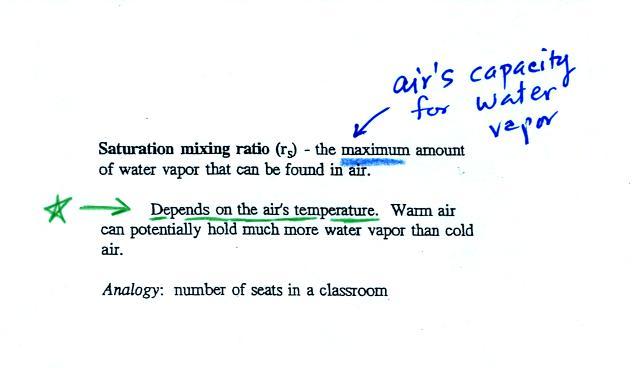
Saturation mixing ratio
Saturation mixing ratio is just an upper limit to
how much water vapor can be found in air, the air's capacity for
water vapor. It's a property of air and depends on the
air's temperature; warm air can potentially hold more water vapor than cold air.
It doesn't say anything about how much water vapor is
actually in the air (that's the mixing ratio's
job). This variable has the same units:
grams of water vapor per kilogram of dry air.
Saturation mixing ratio values for different air
temperatures are listed and graphed on p. 86 in the
ClassNotes.
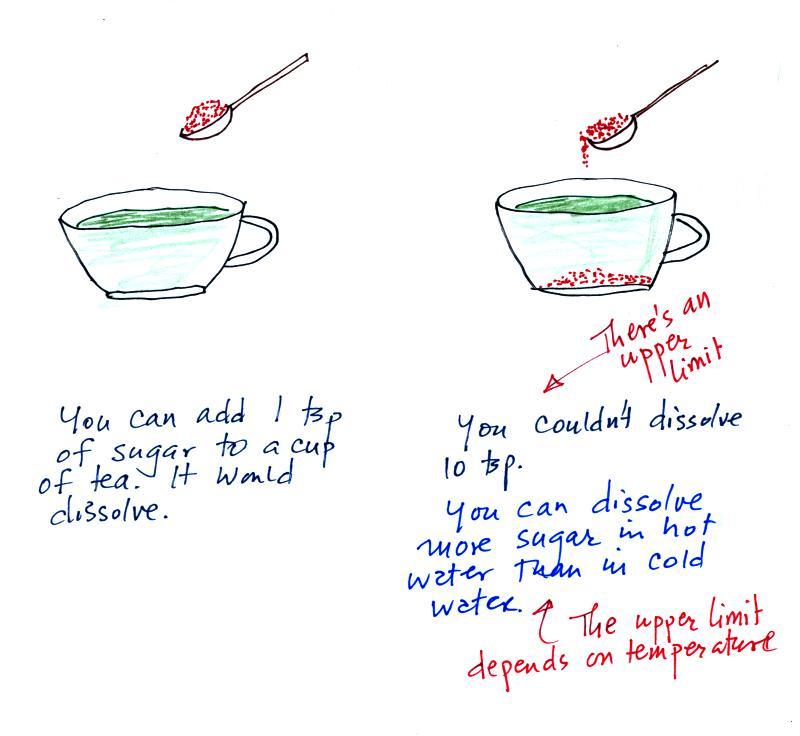
The sugar dissolved in tea analogy is still helpful.
Just as is the case with water vapor in air, there's a limit
to how much sugar can be dissolved in a cup of hot
water. And not only that, the amount depends on
temperature: you can dissolve more sugar in hot water than in cold
water.
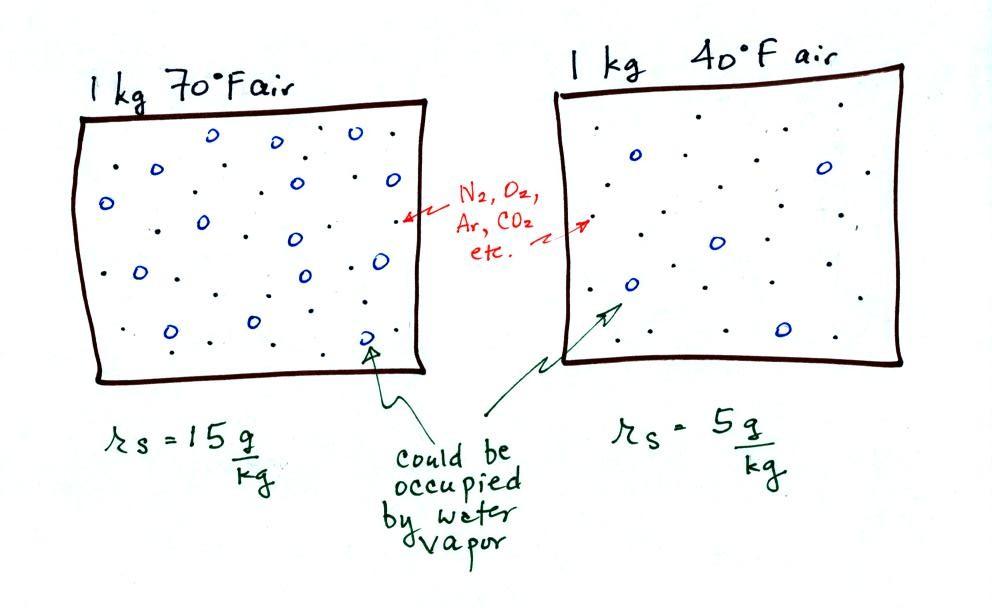
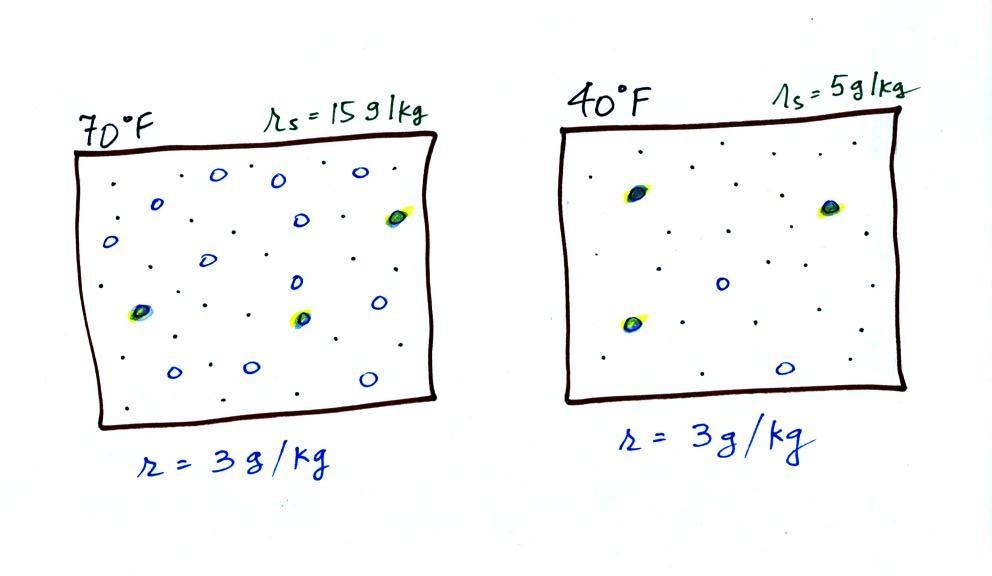
The dependence of saturation mixing ratio on air
temperature is illustrated below:
The small specks represent all
of the gases in air except for the water vapor. Each of
the open circles represents 1 gram of water vapor
that the air could potentially hold. There are 15 open
circles drawn in the 1 kg of 70 F air; each 1 kg of 70 F air
could hold up to 15 grams of water vapor. The 40 F air
only has 5 open circles; this cooler air can
only hold up to 5 grams of water vapor per kilogram of dry
air. The numbers 15 and 5 came from the table on p. 86.
Now we have gone and actually
put some water vapor into the volumes of 70 F and 40 F air
(the open circles are colored in). The same amount, 3
grams of water vapor, has been added to each volume of
air. Three of the open circles have been colored
in. The mixing ratio, r, is 3 g/kg in both cases.
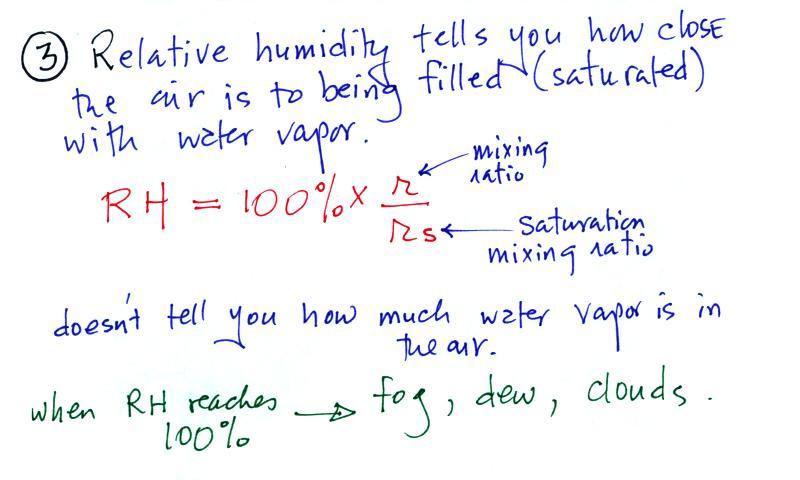
Relative humidity
After looking at the figure above you might be able to figure
out what relative humidity is
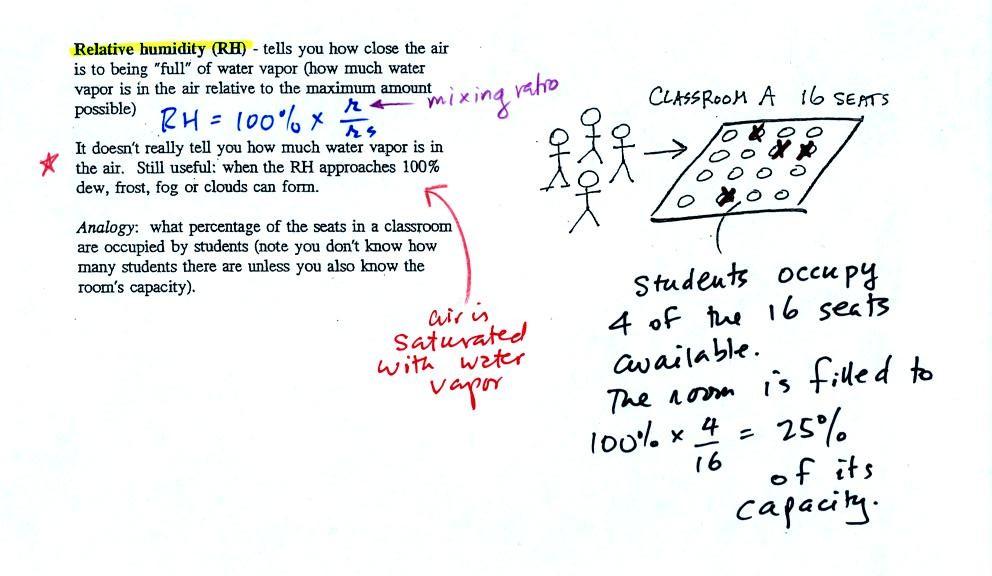 |
The relative humidity is the
variable most people are familiar with. It tells you how
"full" the air is with water vapor, how close it is to
being filled to capacity with water vapor, how
close the air is to being "saturated" with water
vapor. RH has units of %.
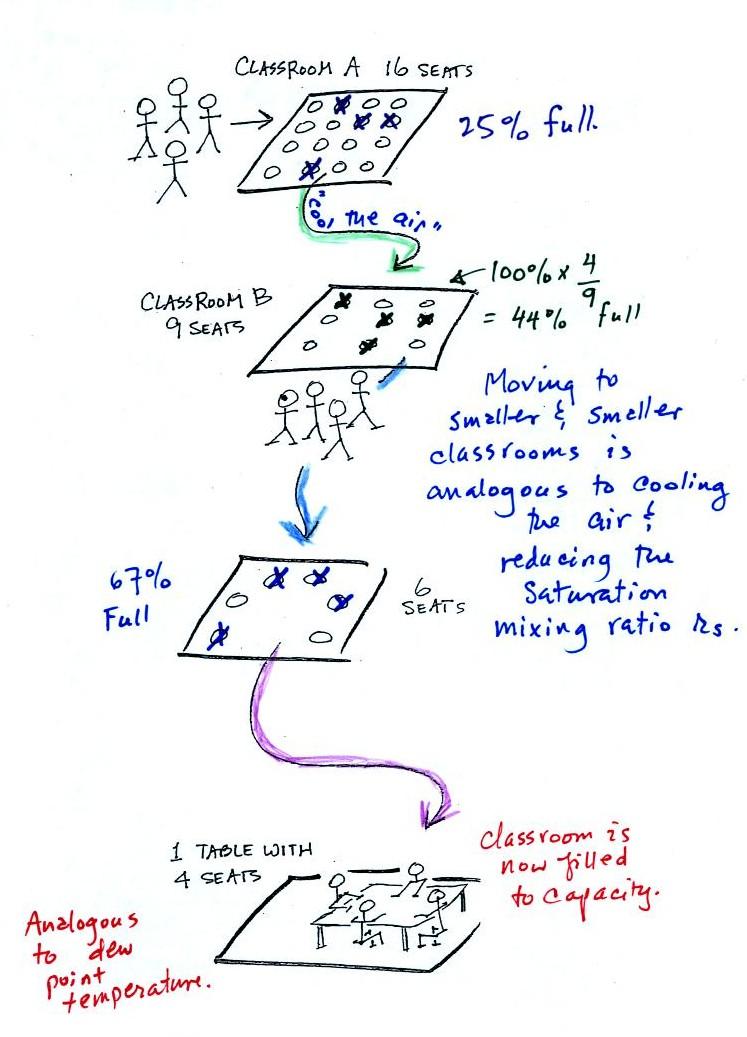
In the analogy (sketched on the right hand side of p. 83 in
the photocopied notes) 4 students wander into Classroom A
which has 16 empty seats. Classroom A is
filled to 25% of its capacity. You can think
of 4, the actual number of students, as being analogous to the
mixing ratio. The classroom capacity is analogous to the
saturation mixing ratio. How full the room is is
analogous to the relative humidity.
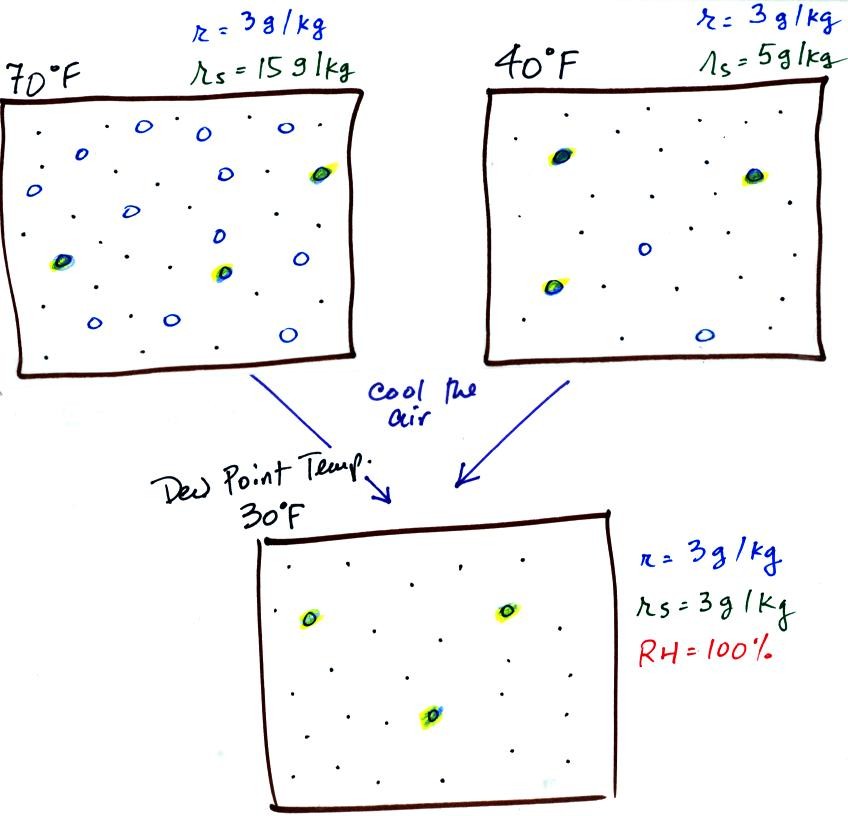
The figure below goes back to the volumes (1 kg each) of 70
F and 40 F air that could potentially hold 15 grams or 5 grams
of water vapor.
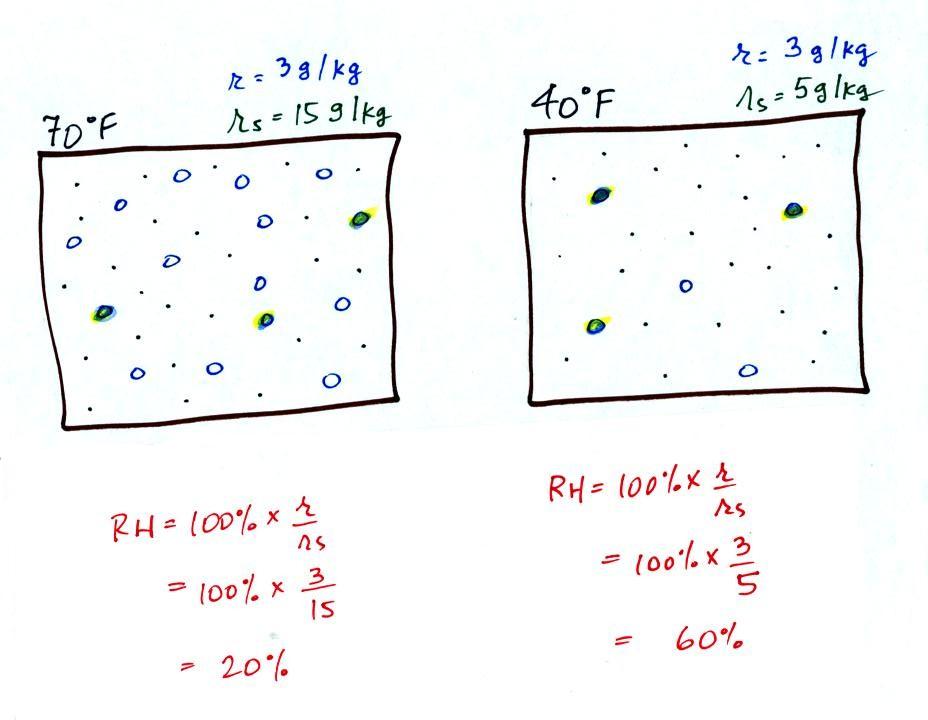
Both the 70 F and the 40 F air each contain
3 grams of water vapor. The 70 F air is only filled to
20% of capacity (3 of the 15 open circles is colored in)
because this warm air's capacity, the saturation mixing ratio,
is large. The RH in the 40 F is 60% even though it has
the same actual amount of water vapor because the 40 F air
can't hold as much water vapor and
is closer to being saturated.
Something important to note: RH doesn't really
tell you how much water vapor is actually in the air.
The two volumes of air above contain the same amount of water
vapor (3 grams per kilogram) but have very different values of
relative humidity. You could just as easily have two
volumes of air with the same relative humidity but different
actual amounts of water vapor.
What is the RH good for if it doesn't tell you how much
moisture is in the air? When the RH reaches 100% dew,
fog, and clouds form. RH tells you whether clouds or fog
are about to form or not.
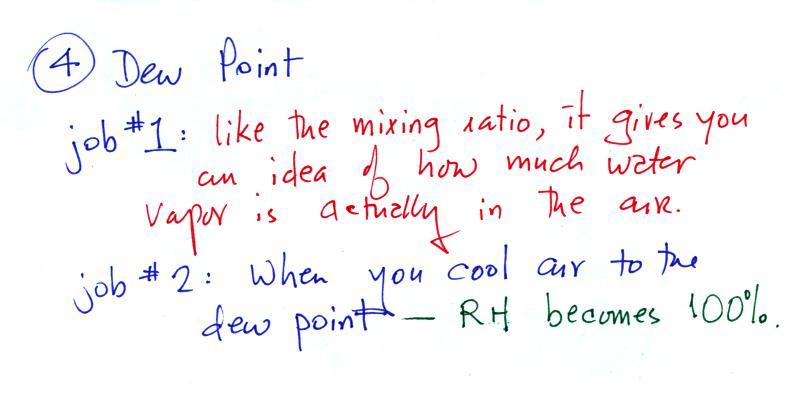
Dew point temperature
|
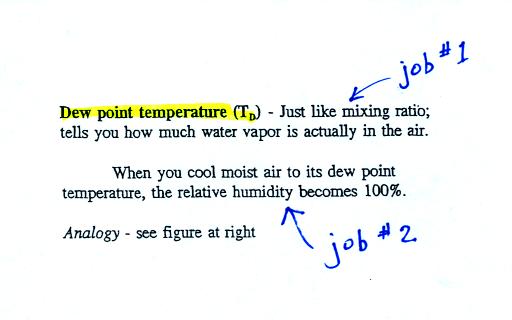 |
The dew point temperature has
two jobs. First it gives you an idea of the actual
amount of water vapor in the air. In this respect
it is just like the mixing ratio. If the dew point
temperature is low the air doesn't contain much water
vapor. If it is high the air contains more water
vapor. This is something we learned early in the
semester.
The dew point is a temperature and has units of
oF or oC
Second the dew point tells you how much
you must cool the air in order to raise the RH to 100% (at
which point a cloud, or dew or frost, or fog would
form). This idea of cooling the air until the RH
increases to 100% is important and is something we will use a
lot.
If we cool the 70 F air or the 40 F
air to 30 F we would find that the saturation mixing ratio
would decrease to 3 grams/kilogram. Since the air
actually contains 3 g/kg, the RH of the 30 F air would become
100%. The 30 F air would be saturated, it would be
filled to capacity with water vapor. 30 F is the dew
point temperature for 70 F air that contains 3 grams of water
vapor per kilogram of dry air. It is also the dew point
temperature for 40 F air that contains 3 grams of water vapor
per kilogram of dry air. Because
both volumes of air had the same amount of water vapor, they both also have the same dew
point temperature.
Now back to the
student/classroom analogy.
The 4 students move into classrooms of
smaller and smaller capacity. The decreasing capacity of
the classrooms is analogous to the decrease in
saturation mixing ratio that occurs when you cool air.
Eventually the students move into a classroom that they just
fill to capacity. This is analogous to
cooling the air to the dew point.
We're going to work 4 example
problems. I was going to do the first of them today but
we were running short on time. So we finished up with a
quick look at an example grade like the one you should have
received in class today.
Grade summary example
Doe_J
quiz1 -59.0 (190.0 pts
possible) 68.9%
quiz2 -48.0 (150.0 pts
possible) 68.0%
1.1 EC points (1.8 pts
possible)
writing scores: 34.0
(expt/book report) + 14.0 (1S1P pts)
writing percentage grade estimate: 87.3%
average (no quiz scores dropped): 72.2 + 1.1 = 73.4%
average (lowest quiz score dropped): 73.5% + 1.1 = 74.7
The first two items (green)
are your scores on the quizzes.
This is followed by the number of extra credit (EC) points
(purple) you've earned
so far. If you've done all the Optional Assignments
(and selected the extra credit points option on the two
recent surface weather map analysis and upper level charts
assignments) you could have earned up to 1.8 pts so
far. There will be at least 3 pts possible by the
end of the semester. You can also see whether they
enter into your overall grade.
Your writing score (red)
is next. This is made up of your experiment report
grade (up to 40 pts) and the number of 1S1P pts you've
earned so far (this should be 45 pts by the end of the
semester). Many of you haven't done an experiment or
have turned in a report that hasn't yet been graded.
In these cases your grade summary shows a 0 but the
computation of your writing percentage grade assumes an
average score. This is just to show you how the
writing grade can help your overall average.
Finally two overall averages are computed:
(i) the first doesn't drop any quiz scores. This is
the score that must be 90.0 or above at the end of the
semester in order to be exempt from the Final Exam.
(ii) the lowest quiz score when computing the 2nd average.
These grade estimates attempt to predict the grade you
will end up with at the end of the semester if you keep on
doing as you have done so far. A student that ends
up with a 74.7% average on the last day of classes will
have to take the Final Exam. The student would need
to score 52% on the Final to keep the C grade that they
currently have. They would need to score 88% on the
Final Exam to raise their overall average to a B.
If you're happy with your overall average, you need to
keep up the quality of work you have done so far.
If your score is lower than you'd like there is still
plenty of time for improvement. Improved scores on
the remaining two quizzes can change
your overall average dramatically. Also be sure to
turn in an experiment report and earn 45 1S1P pts (the
max. no. allowed). The writing
percentage grade has the same weight as a quiz and there
is no reason it shouldn't be near or even above 100%.
Finally be sure to check that all of the information on
your grade summary is correct.