1.
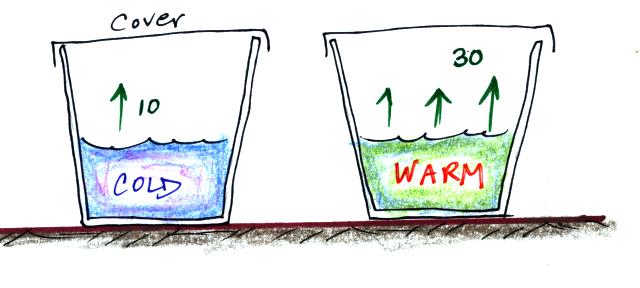
The first step is to realize that warm water will evaporate more rapidly than cool water. You probably know that already. If a cup of iced tea were set next to a cup of hot tea you probably be able to tell which was which by just looking at them. You wouldn't need to touch the cups or taste the tea or look for ice cubes.

You might notice that one of
the cups of tea was steaming (the cup on the right
above). That would be the hot tea. The steam
that you see is not actually water vapor. Rather water
vapor is evaporating so quickly that it is filling the
cooler air above with more moisture than it can handle (the
relative humidity is over 100%, the air is supersaturated
with moisture). The excess water vapor condenses
(bringing the relative humidity down to 100%) and forms a
cloud of very small drops of water. That's what you
are seeing.
Now we'll redraw the picture and cover both cups so that water vapor can begin to buildup in the air above the water in both cups.
Now we'll redraw the picture and cover both cups so that water vapor can begin to buildup in the air above the water in both cups.

2.
Water vapor will start to buildup in the air above each cup. And, even though it has just evaporated, some of the water vapor will condense and rejoin the water at the bottom of each cup. Let's just assume that 1% of the water vapor molecules will condense (again just a made up number).
The amount of water vapor in each glass will increase until it reaches a point where
water evaporation rate =
water vapor condensation rate
for the cup of cold water
10 = 0.01 x water
vapor concentration
The 0.01 is 1% expressed in decimal form. Solving this equation gives you a water vapor concentration of 1000. The air is saturated when you reach this point and the RH = 100%. The one arrow of evaporation is balanced by one arrow of condensation.

If you repeat the calculation for the cup at right with the higher rate of evaporation you get a water vapor concentration of 3000.
The air is saturated in both glasses (RH = 100% in both glasses) but there is more water vapor in the warm glass.
3.
The fact that the rates of evaporation and condensation are equal when air is saturated (RH = 100%) is something we'll be using later when we study the formation of precipitation. Here's a picture of how that would look inside a cloud (the air inside a cloud is just like the air in the covered glasses above)

4.
Here's something to test your understanding of this material. Turn in correct answers to at least three of the four questions below by the start of class next Tuesday (March 31) and I'll give you a Green Card that you can use on the next quiz.

Here are the 4 questions:
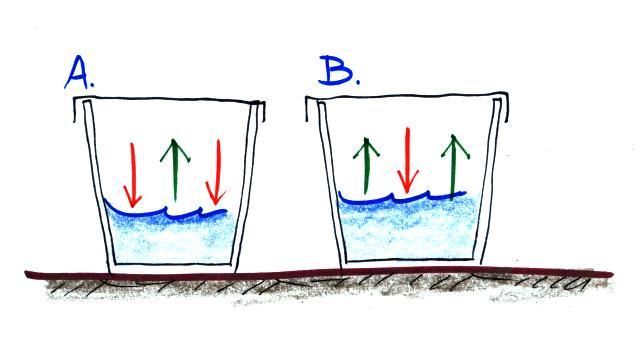
(i) Is the water in Glass A WARMER or COLDER than in Glass B?
(ii) Is there MORE or LESS water vapor in the air in Glass A than in Glass B?
(iii) Is the relative humidity in each glass MORE than 100%, LESS than 100% or is it EQUAL to 100%.
(iv) The rates of evaporation and condensation aren't equal in either glass, so the pictures will change with time. What will the glasses look once they have reached equilibrium?
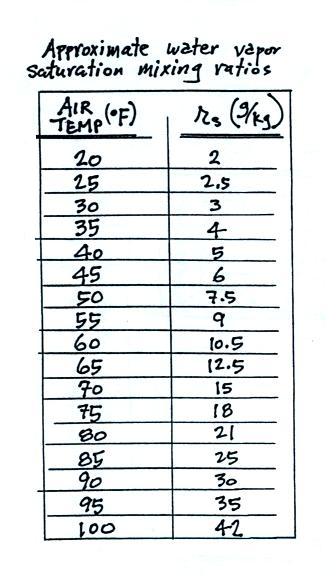
We'll end this section with a table that shows the dependence of saturation mixing ratio on air temperature.

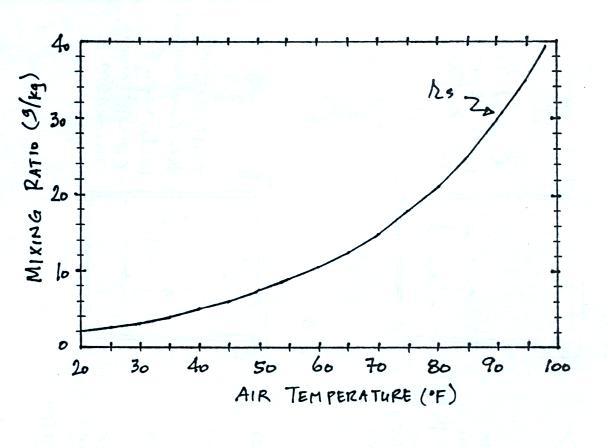
Note that the value of the
saturation mixing ratio doubles for every 20 F increase in
temperature. The same data are shown in graphical
form below.

