Wednesday, Apr. 20, 2016

Tesoro "Malaguena Salerosa" (5:23), "Instinto Animal" (3:59), "Mirame Mi Amor" (3:55), "Tentadora" (3:53)

Tornado life cycle
Hopefully the next time you see a tornado either in person or on video you'll be able to say whether it is early or late in its life cycle and whether it appears to be a stronger or weaker than average tornado.


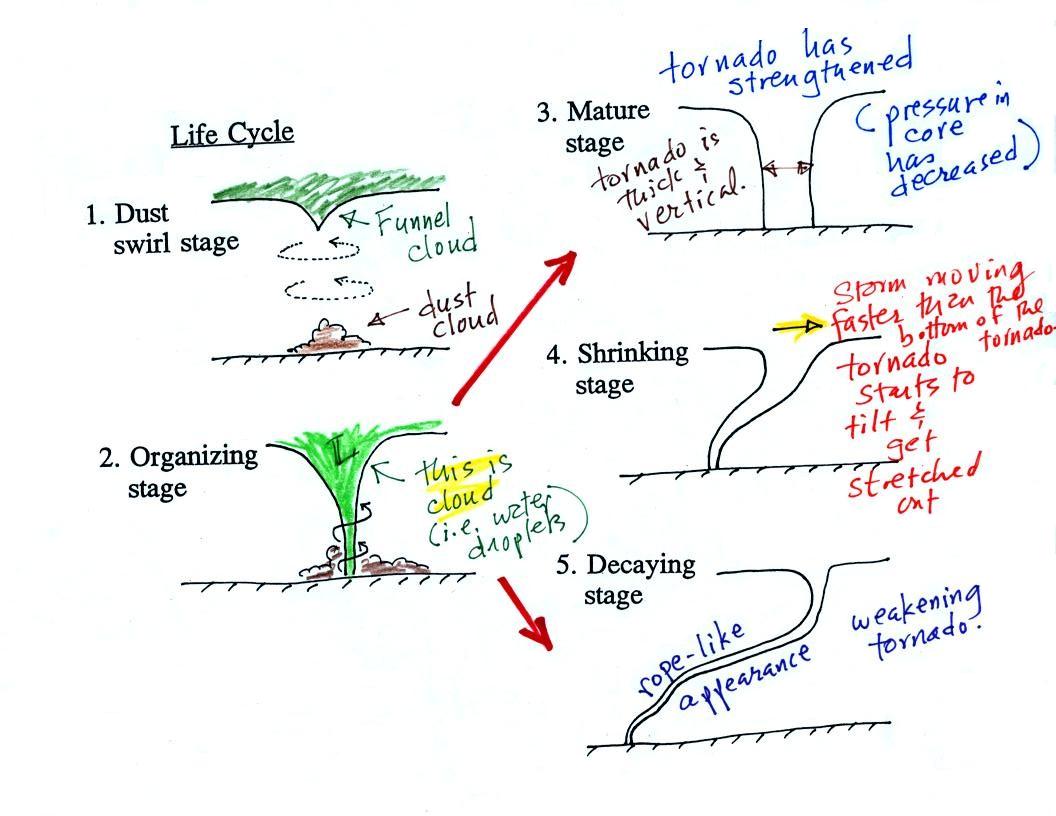
Tornadoes begin in and descend from a thunderstorm.  You would usually see a funnel cloud dropping from the base of the thunderstorm.  Spinning winds will probably be present between the cloud and ground before the tornado cloud becomes visible.  The spinning winds can stir up dust at ground level.  The spinning winds might also be strong enough at this point to produce some minor damage. 

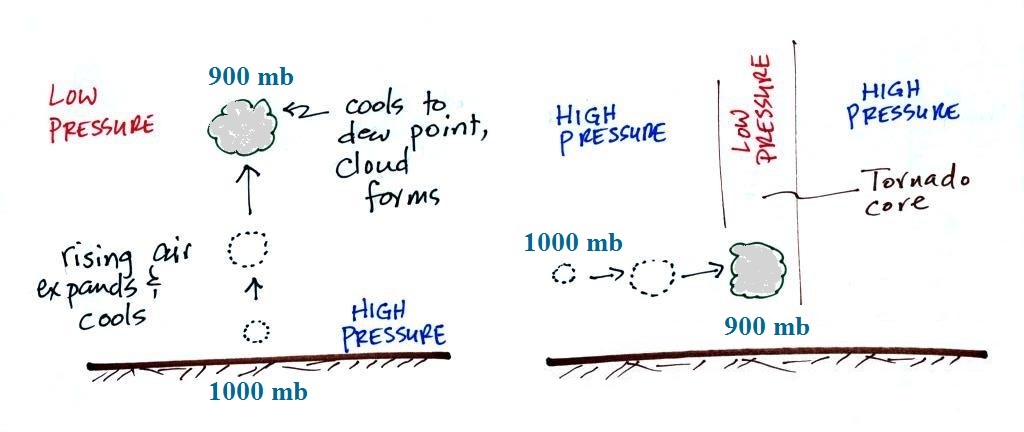
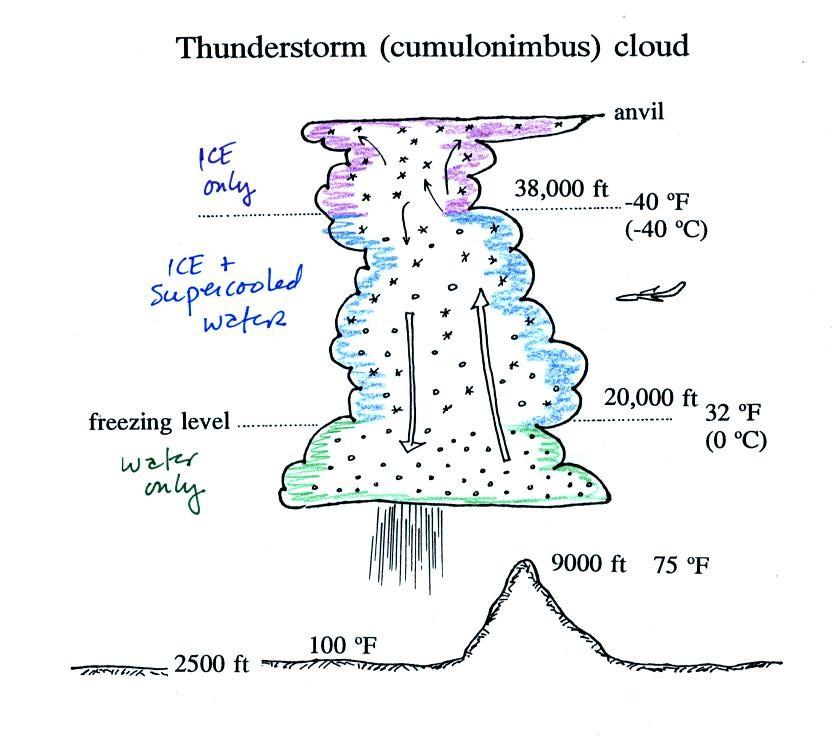
In Stage 2, moist air moves horizontally toward the low pressure in the core of the tornado.  This sideways moving air will expand and cool just as rising air does (see figure below).  Once the air cools enough (to the dew point temperature) a cloud will form. 

Tornadoes can go from Stage 2 to Stage 3 (this is what the strongest tornadoes do) or directly from stage 2 to stage 4 or 5.  Note a strong tornado is usually vertical and thick as shown in Stage 3.  "Wedge tornadoes" actually appear wider than they are tall.

Here is video of the Laverne Oklahoma tornado that was shown in class and that shows the initial dust swirl stage up to the mature stage very well. 

The thunderstorm and the top of the tornado will move faster than the surface winds and the bottom of the tornado.  This will tilt and stretch the tornado.  The rope like appearance in Stage 5 is usually a sign of a weakening (though still a dangerous) tornado.


A tornado cloud forms is mostly the same way that ordinary clouds do.  In an ordinary cloud (left figure above) rising air moves into lower pressure surroundings and expands.  Expansion cools the air.  If the air expands and cools enough (to the dew point) a cloud forms.  In a tornado air moves horizontally into lower pressure at the core of the tornado.  The air expands and cools just like rising air does.  If the air cools enough a cloud appears.

Tornado intensity and the Fujita Scale

It is very hard to actually measure the speed of the rotating winds in a tornado.  Researchers usually survey the damage caused by the tornado and assign a Fujita Scale rating.  The original scale, introduced in 1971 by Tetsuya (Ted) Fujita.  A simplified, easy to remember version is shown below.  A very basic and grossly oversimplified idea of the damage that each level can produce is included.  This is simple enough that I can remember it and can use it to estimate tornado intensity when I see damage on the television news.


The fact that the interior walls in a home as the last to go in a tornado means this is probably the best location to seek shelter from a tornado if a better location (such as an underground storm cellar) is not available. 

The Fujita (F) Scale probably overestimated the wind speeds in tornadoes.
It has been replaced by the Enhanced Fujita (EF) scale.


Here are simplified, easy to remember, versions of both


Here is a comparison of the actual scales (I didn't show this figure in class)


There's also a much more detailed set of guidelines for determining the EF scale rating from a survey of tornado.  Different objects and structures react differently when subjected to tornado (or microburst) strength winds.

The EF scale has 28 "damage indicators" that can be examined to determine tornado intensity.  You can think of these as being different types of structures or objects that could be damaged by lightning.
Examples include:


Damage Indicator
Description
2
1 or 2 family residential home
3
Mobile home (single wide)
10
Strip mall
13
Automobile showroom
22
Service station canopy
26
Free standing light pole
27
Tree (softwood)
Then for each indicator is a standardized list of "degrees of damage" that an investigator can look at to estimate the intensity of the tornado.  For a 1 or 2 family home for example


degree of damage
description
approximate
wind speed (MPH)
1
visible damage
65
2
loss of roof covering material
80
3
broken glass in doors & windows
95
4
lifting of roof deck, loss of more than 20% of roof material, collapse of chimney, garage doors collapse inward, destruction of porch roof or carport
100
5
house slides off foundation
120
6
large sections of roof removed, most walls still standing
120
7
exterior walls collapse (top story)
130
8
most interior walls collapse (top story)
150
9
most walls in bottom floor collapse except small interior rooms
150
10
total destruction of entire building
170


You'll find the entire set of damage indicators and lists of degrees of damage here.

Here's some recent video of damage being caused by a tornado as it happened (caught on surveillance video).    It shows a house roof being lifted intact off a house.  If you listen to the news commentators, there was someone in a pickup truck in the street that survived the tornado.  The tornado struck West Liberty, Kentucky, on March 2, 2012.

Here are photographs of some actual tornado damage and the EF Scale rating that was assigned to each

EF2 Damage
roof is gone, but all walls still standing
EF4 Damage
only the strong reinforced concrete basement walls (part of the wall was below ground) are left standing.  It doesn't look like there would have been anywhere in this building that would have provided protection from a tornado this strong.
EF5 Damage
complete destruction of the structure


At this point we watched the last of the tornado video tapes.  It showed a tornado that occurred in Pampa, Texas.  Here is a pretty similar video that I found online.  It's missing the commentary that was on the video shown in class.   Near the end of the segment, video photography showed several vehicles (pick up trucks and a van) that had been lifted 100 feet or so off the ground and were being thrown around at 80 or 90 MPH by the tornado winds (the large dark objects seen between about 5:40 and 6:10 on the video).  Winds speeds of about 250 MPH were estimated from the video photography (though the wind speeds were measured above the ground and might not have extended all the way to the ground).


Multiple vortex tornadoes
And finally, something that was initially something of a puzzle to tornado researchers.


Several levels of damage (EF1 to about EF3) are visible in the photograph above.  It was puzzling initially how some homes could be nearly destroyed while a home nearby or in between was left with only light damage.  One possible explanation is shown below.


Some big strong tornadoes may have smaller more intense "suction vortices" that spin around the center of the tornado (they would be hard to see because of all the dust in the tornado cloud.  Tornado researchers have actually seen the damage pattern shown above scratched into the ground by the multiple vortices in a strong tornado.


The sketch above shows a tornado located SW of a neighborhood.  As the tornado sweeps through the neighborhood, the suction vortex will rotate around the core of the tornado.


The homes marked in red would be damaged severely.  The others would receive less damage.  Just one suction vortex was used here, there are usually several.  But the tornado diameter is probably larger than shown here.


There was about 10 minutes left in the class period so we spend a little time looking ahead toward the topic that we will be covering next: lightning.


A typical summer thunderstorm in Tucson is shown in the figure above (p. 165 in the photocopied ClassNotes).   Even on the hottest day in Tucson in the summer a large part of the middle of the cloud is found at below freezing temperatures and contains a mixture of super cooled water droplets and ice crystals.  This is where precipitation forms and is also where electrical charge is created.  Doesn't it seem a little unusual that electricity, static electricity, can be created in the wet interior of a thunderstorm?

1.  What produces the electrical charge needed for lightning?
2.  Different types of lightning


Collisions between precipitation particles produce the electrical charge needed for lightning.  When temperatures are colder than -15 C (above the dotted line in the figure above), graupel becomes negatively charged after colliding with a snow crystal.  The snow crystal is positively charged and, because it is smaller and lighter, is carried up toward the top of the cloud by the updraft winds.  At temperatures warmer than -15 (but still below freezing), the polarities are reversed.  A large volume of positive charge builds up in the top of the thunderstorm.  A layer of negative charge accumulates in the middle of the cloud.  Some smaller volumes of positive charge are found below the layer of negative charge.  Positive charge also builds up in the ground under the thunderstorm (it is drawn there by the large layer of negative charge in the cloud).

Air is normally an insulator, but when the electrical attractive forces between the volumes of charge in the cloud gets gets high enough lightning occurs.  Most lightning (2/3 rds, maybe even 3/4) stays inside the cloud and travels between the main positive charge center near the top of the cloud and the layer of negative charge in the middle of the cloud; this is intracloud lightning (Pt. 1).  About 1/3 rd of all lightning flashes strike the ground.  These are called cloud-to-ground discharges (actually negative cloud-to-ground lightning).  We'll spend most of the class learning about this particular type of lightning (Pt. 2).  It's what kills people and starts forest fires. 

Positive polarity cloud to ground lightning (Pt. 3) accounts for a few percent of lightning discharges.  Positive cloud-to-ground lightning is "more powerful" and potentially more destructive than negative cloud-to-ground lightning.  Upward lightning is the rarest form of lightning (Pt. 4).