Monday, Mar. 7, 2016
School of Seven Bells "Open Your
Eyes" (4:19), "On My Heart"
(4:17), Au Revoir Simone "Gravitron"
(4:56), "The
Lead is Galloping" (3:11),
"Just Like a
Tree" (4:49)
How would you describe Tucson's climate? Hot
and dry? You're basically conveying information about
temperature and precipitation. Here we'll mainly concern
ourselves with temperature.
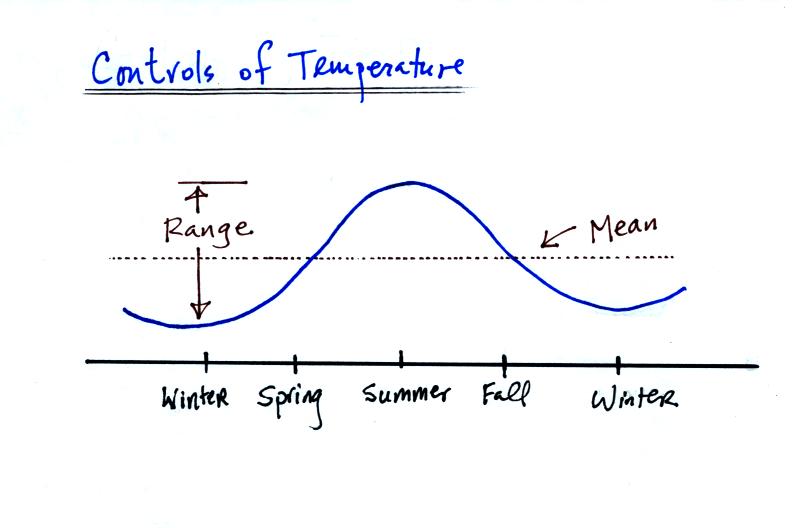
With just two numbers, the annual mean or annual average
temperature and the annual range of temperature, you can give
someone a pretty complete idea of the temperature in Tucson
(or some other location) and how it changes during the year.
Before we look at the factors that determine annual
mean and range of temperature, here are some average
temperature and precipitation data for Tucson.
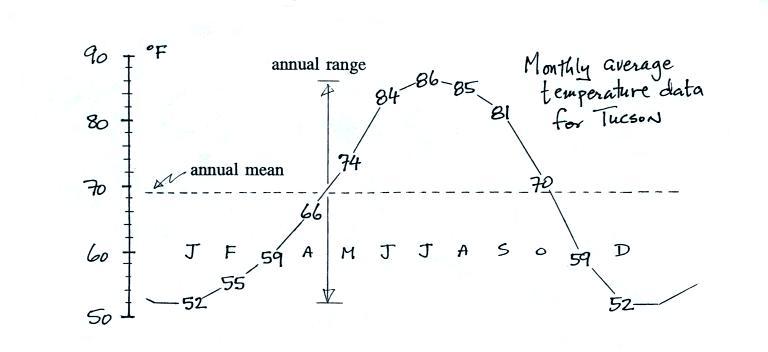
1. Monthly average temperatures are plotted
here. To determine the annual mean temperature add the
twelve monthly average temperatures and divide by 12 (68.5 F for
the data shown here). You can get a pretty good estimate of
the annual mean temperature by adding the highest and lowest
average monthly temperature values and dividing by 2 (69 F).
Average Monthly Temperature
and Precipitation data for Tucson
Average
Monthly Temp
|
Month
|
Average
Max Temp
|
Average
Min Temp
|
Difference
|
Precipitation
|
52
|
Jan
|
64
|
39
|
25
|
0.99
|
55
|
Feb
|
68
|
42
|
26
|
0.88
|
59
|
Mar
|
73
|
45
|
28
|
0.81
|
66
|
Apr
|
82
|
50
|
32
|
0.28
(see Note 2)
|
74
|
May
|
90
|
59
|
31
|
0.24
|
84
|
Jun
|
100
|
68
|
32
|
0.24
|
86
|
Jul
|
100
|
73
|
27
|
2.07
(see Note 3)
|
85
|
Aug
|
97
|
72
|
25
|
2.30
|
81
|
Sep
|
94
|
68
|
26
|
1.45
|
70
|
Oct
|
84
|
57
|
27
|
1.21
|
59
|
Nov
|
72
|
45
|
27
|
0.67
|
52
|
Dec
|
65
|
39
|
26
|
1.07
(see Note 4)
|
Notes
2. April, May, and June is generally the driest time
of year in Tucson. This is reflected in the low montly
average precipitation values. It is fairly common to go a
month or more without rain at this time of year.
Because the air is dry and the
skies are cloud free, there is generally a large difference
between daytime high and nighttime low temperatures.
3. The summer thunderstorm season usually begins in
early July when the daily average dew point temperature remains 54
F or above for three days in a row. July, Aug, and Sept. are
usually the wettest months of the year in Tucson. Tucson
gets nearly half its annual rainfall during the summer
thunderstorm season.
Note how the difference between
daytime high and nighttime low temperatures decreases once the
summer thunderstorm season gets underway. This is due to the
increase in humidity and cloud cover. Clouds will lower the
daytime high temperature and raise the nighttime minimum
temperature.
4. During the winter, middle latitude storms will
occasionally drop far enough south to bring precipitation to
southern Arizona. Sometimes these storms will pull up
moisture from the tropics and rainfall amounts can be significant.
There are three or four main factors that determine a region's
annual mean and annual temperature range.
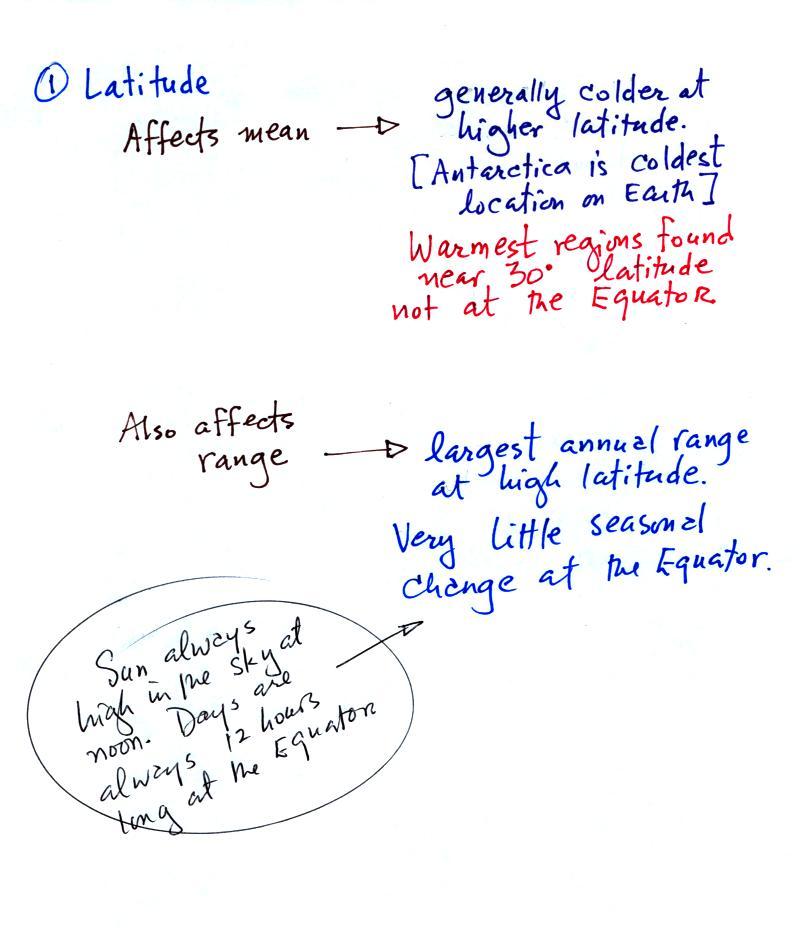
Latitude affects both the annual mean and the annual range of
temperature. The polar regions have colder annual
average temperatures than any other location on earth.
The South Pole is in the middle of a large land mass
(Antarctica), the North Pole is ocean. Much of
Antarctica is found at high altitude. These factors work
together to make Antarctica and the South Pole colder than the
North Pole. The hottest regions on earth are found near
30 latitude, not at the Equator. This is, if you
remember, where the optimal combination of sun elevation angle
and length of day delivers the greatest amount of sunlight
energy to the ground.
The annual range of temperature increases with increasing
latitude. There is little or no seasonal change at the
Equator.

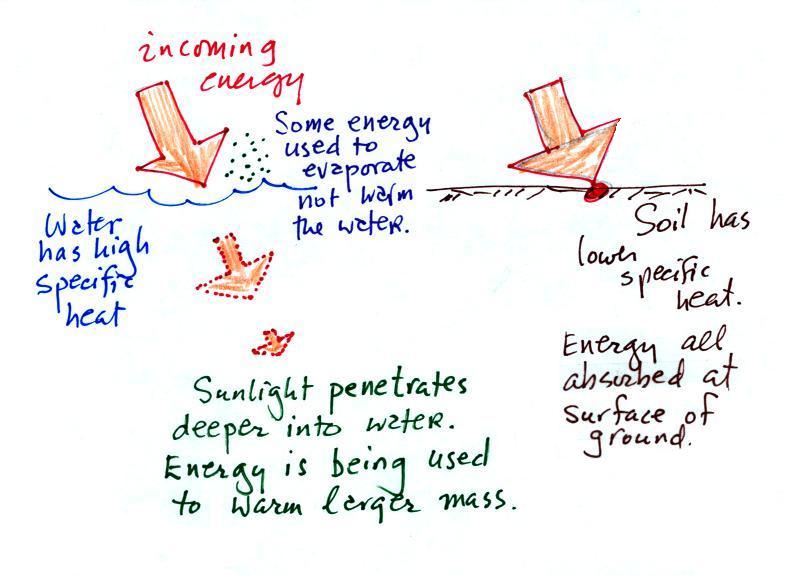
Water has a higher specific heat. Some of the
incoming energy is used to evaporate rather than warm
water. Incoming sunlight penetrates into a body of water
and is used to try to warm a larger mass of water. These
three factors mean that water will warm more slowly and won't
get as hot during the summer as land. There is also a
larger diurnal temperature range over land than over
ocean. If you've ever been to the beach in the summer
you probably remember that the sand on the beach gets
much hotter during the day than the ocean water. We'll
see this effect in action in a later lecture on satellite
photographs.
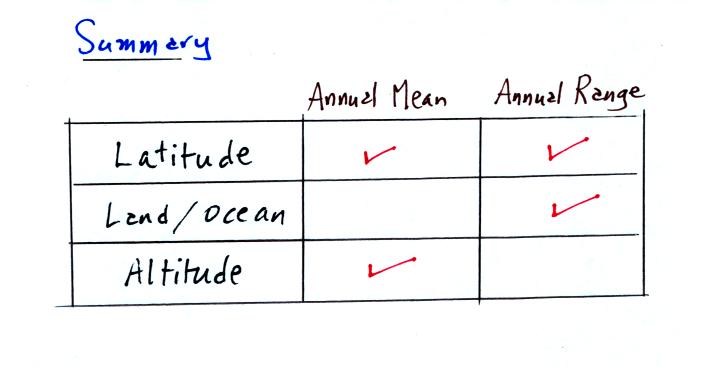
The table below summarizes the three controls of
temperature that we have covered so far. One of them
affects both the annual mean and annual range, one affects
just the mean, and the other just the annual range.
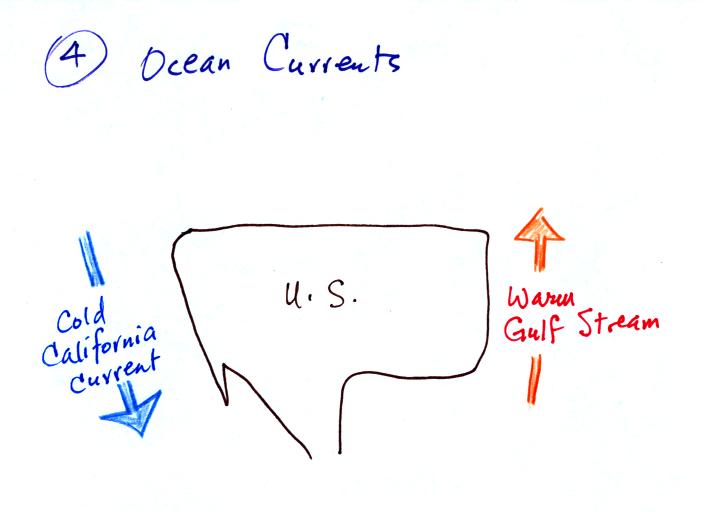
One final factor:
Cities on the west coast and east coast of the US
can have very different climates even if they are at the same
latitude and altitude. A cold southward flowing ocean
current is found along the West Coast. The warm Gulf
Stream current flows northward along the East Coast.
Winds at middle latitudes generally blow from west to
east. The city on the West Coast will feel the full
moderating effect of the ocean. The city on the East
Coast will be affected by the Gulf Stream current and also by
winds blowing across the interior of the US.
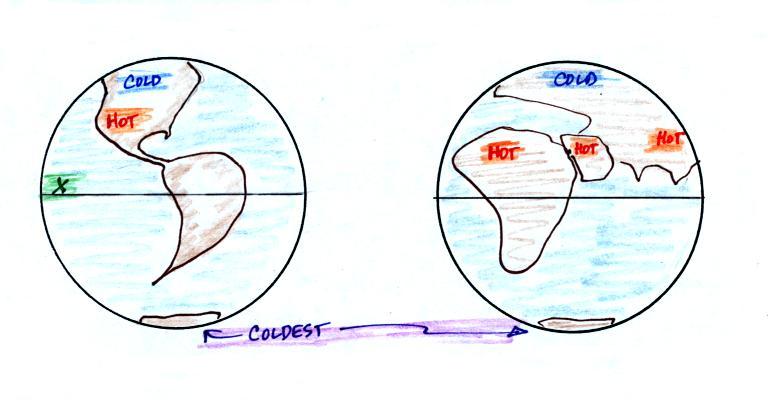
A graphical summary. You find cold locations
over land at high latitudes (Northern Canada, Siberia).
Antarctica is the coldest region because it is found at high
latitude, is a land mass, and much of Antarctica is high
altitude. The hottest regions on earth are found at low
altitude in the middle of land masses near 30 latitude.
What kind of climate would you expect to find at Point X in the figure
above. I.e. at a point near the Equator in the middle of
the Pacific Ocean? The answer to the question
includes a short story that features such things as carved
wooden pigs, tropical island beverages, and something called
betelnut.
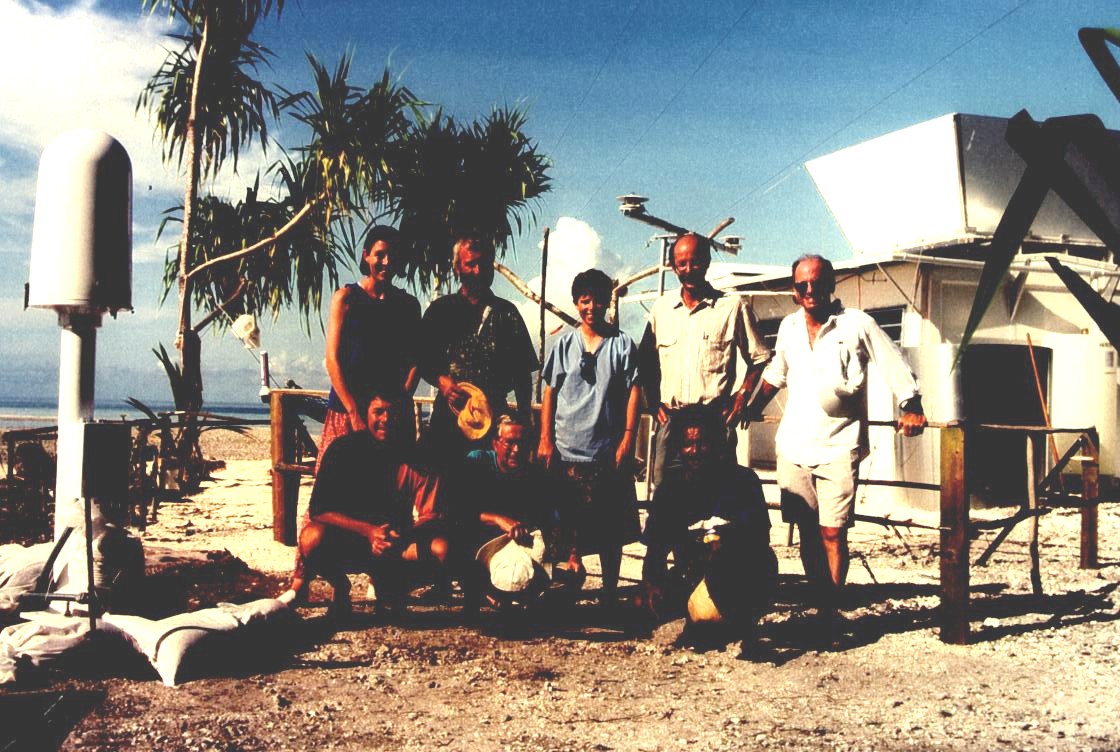
The photograph above, taken on Kapingamarangi Atoll,
shows a group of people that were participating in a very large
international project called the Tropical Ocean Global
Atmosphere/Coupled Ocean Atmosphere Response Experiment. The
instructor of this course and one of the other people in the
photograph had just installed and tested the tall white lightning
detector seen at the edge of the photograph. They were about
to leave Kapingamarangi and travel to Papua New Guinea to install
detectors at two additional sites.
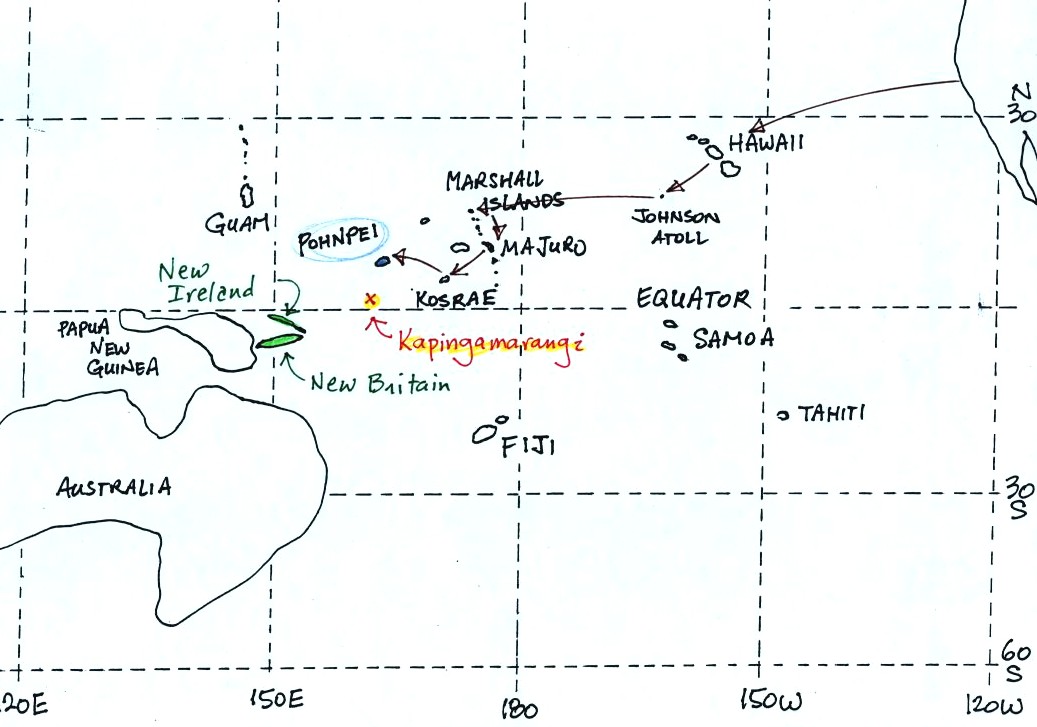
To get to Kapingamarangi you first need to fly to Pohnpei (an
island in the Federated States of Micronesia). The route is
shown above. Then you take a cargo ship for about a 4 day
sail to Kapingamarangi. We had intended to fly to Pohnpei,
set sail for Kapinga the next day, and then spend about a month on
Kapingamarangi. The ship however was delayed 3 weeks.
That gave us plenty of time to visit the island of Pohnpei but
ultimately meant we could only spend a few days on
Kapingamarangi. Here's a picture
of the airport at Pohnpei. Note the runway runs from
one edge of a small island to the opposite edge.
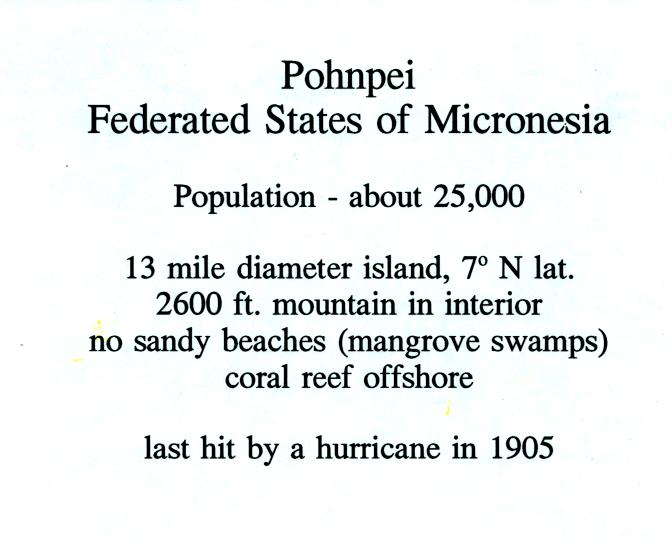
Pohnpei is a fairly large island and, together with
some of the other Micronesian islands, is a popular, world-class,
snorkeling and scuba diving destination. Here's a
picture of Kolonia (the airport is at the left end of the
causeway in the photo), the largest town on Pohnpei. Kolonia
has a weather station that is operated by the US National
Atmospheric and Oceanic Administration (NOAA).
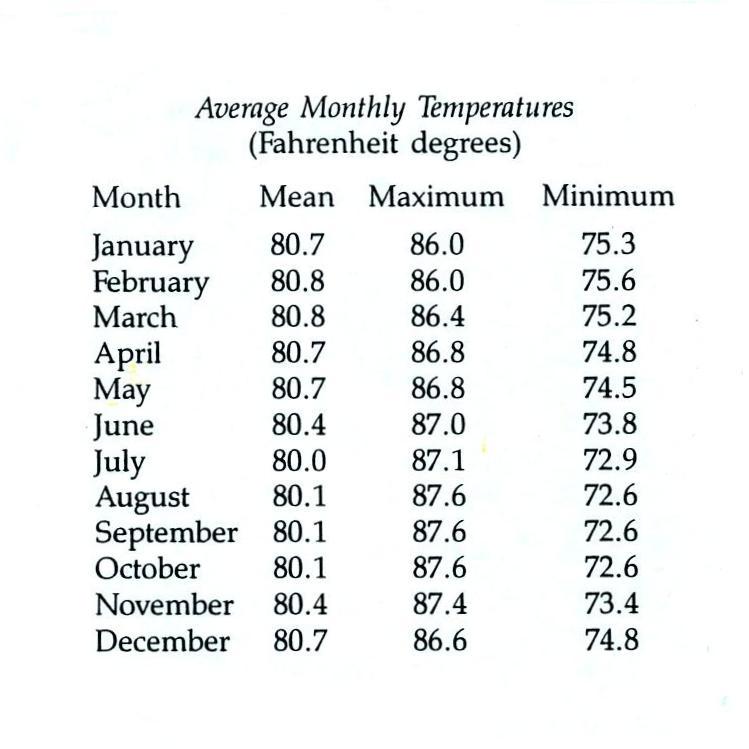
Pohnpei is located at low latitude in the middle of the Pacific
Ocean. Both of those factors will reduce the annual range of
temperature. The annual range is less than one
degree (it is about 34 F in Tucson)!
The average monthly temperatures in Pohnpei range from a high
of 80.8 F in February and March to a low of 80.0 F in July.
The all-time record high temperature is 96 F, it has never dropped
below 66 F on Pohnpei.The controls of temperature that
we have learned about can have quite an effect.
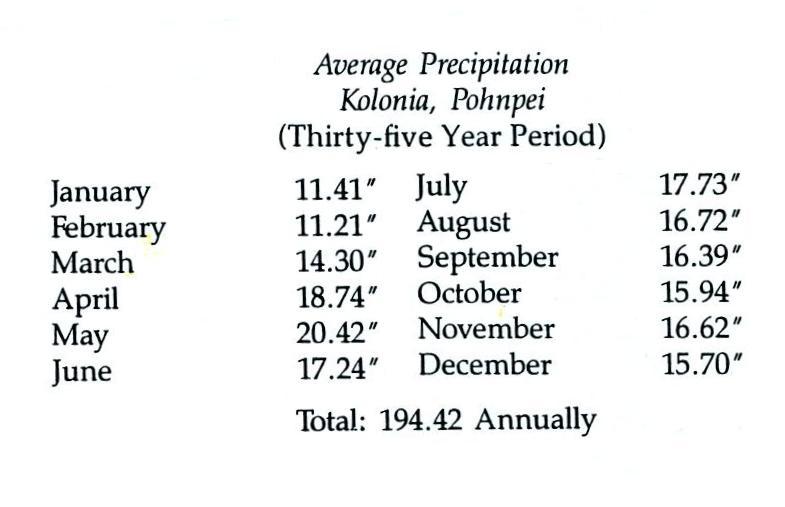
The following precipitation data for Kolonia, the largest
town on the island, show that Pohnpei is also one of the rainiest
locations on earth
Close to 400 inches of rain may fall in the interior of
Pohnpei. The rainiest location on earth is in Hawaii with
about 460 inches of rain per year.
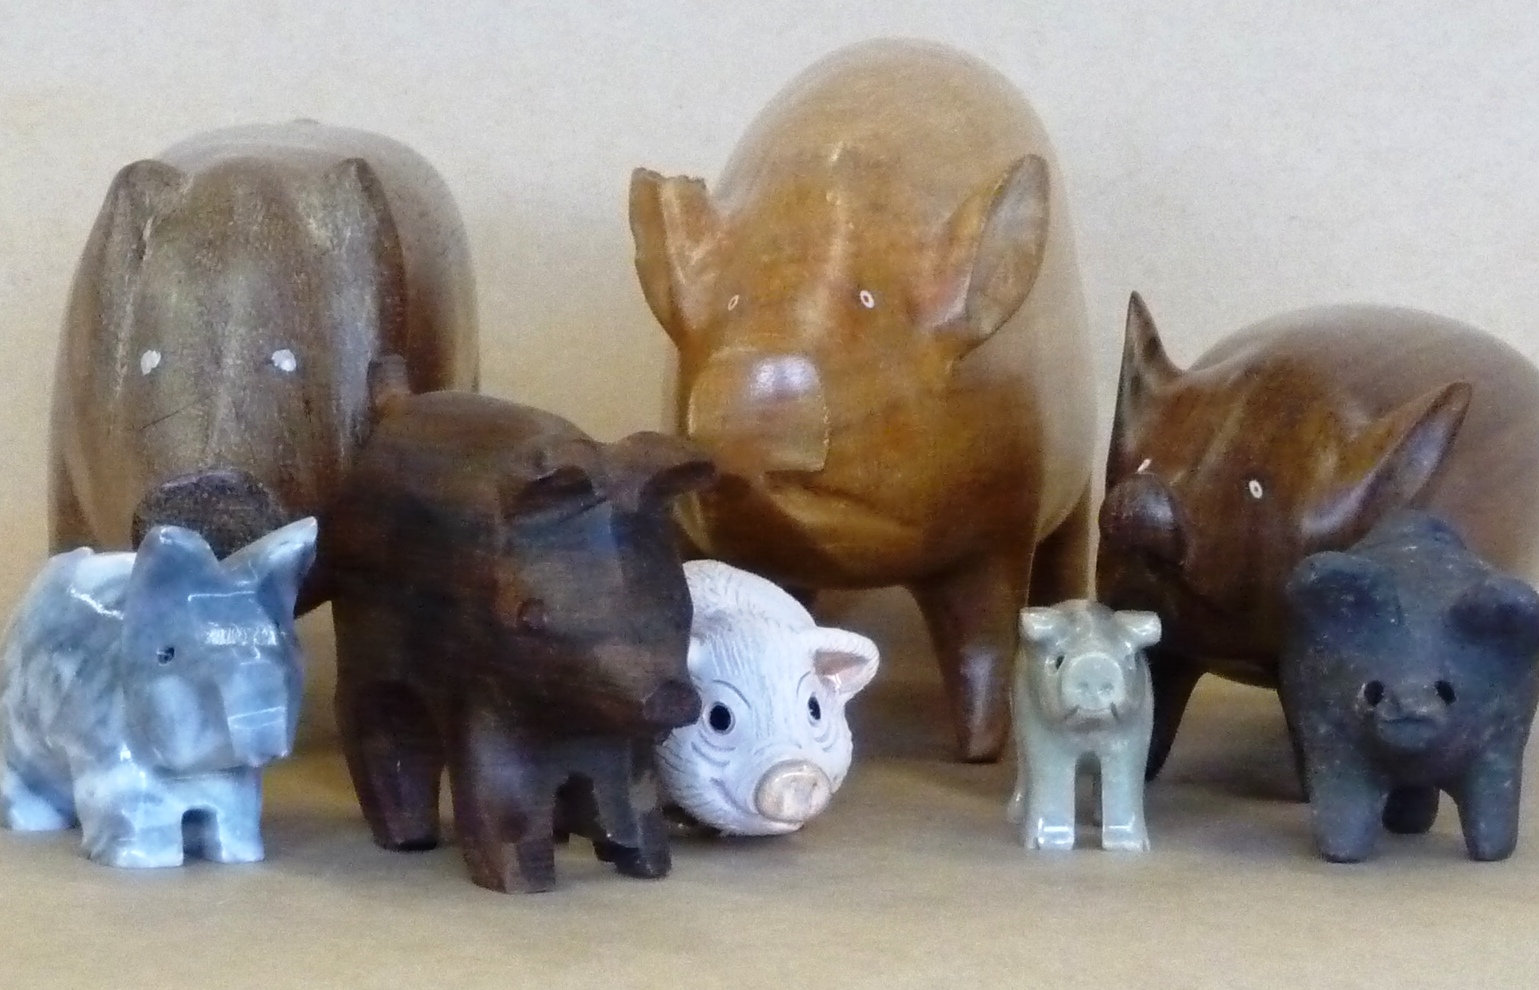
We learned quite a bit more about life in the tropics during our 3
weeks on Pohnpei. For example we saw a lot of pigs and
learned about their importance in the local culture and economy.
Pigs
The
most prized animals on Pohnpei; there
are an estimated 6000 pigs on the
island.
They are an economic asset as well
as a
prestige symbol at traditional
feasts. Their
longevity is directly related to the
number of
funeral feasts and traditional
celebrations that
take place at any given time.
Except around
Kolonia where they are penned in
piggeries,
most roam free. They are fed
minimally in the
morning by their owners, and then
allowed to
forage for themselves.
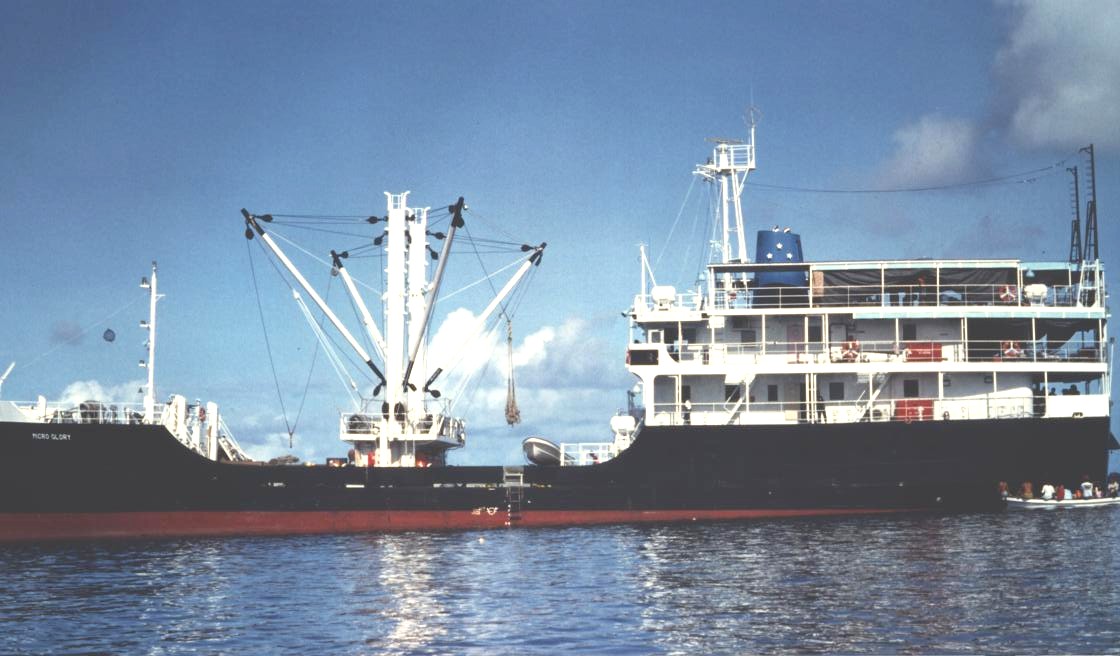
The Micro Glory (shown below) is the ship that carried us from
Pohnpei to Kapingamarangi and back. The ship carries
supplies to the people on Kapingamarangi and some other small
islands along the way. The islanders pay for the supplies
with pigs (the pigs are later sold on Pohnpei). We shared
deck space on the Micro Glory on the trip back to Pohnpei with 20
to 30 pigs (they were hoisted aboard in nets).
Most of the lower deck in the photo above (under the hoists)
was occupied by pigs on the return trip. One of the pigs
died on the return trip - that was a very serious matter.
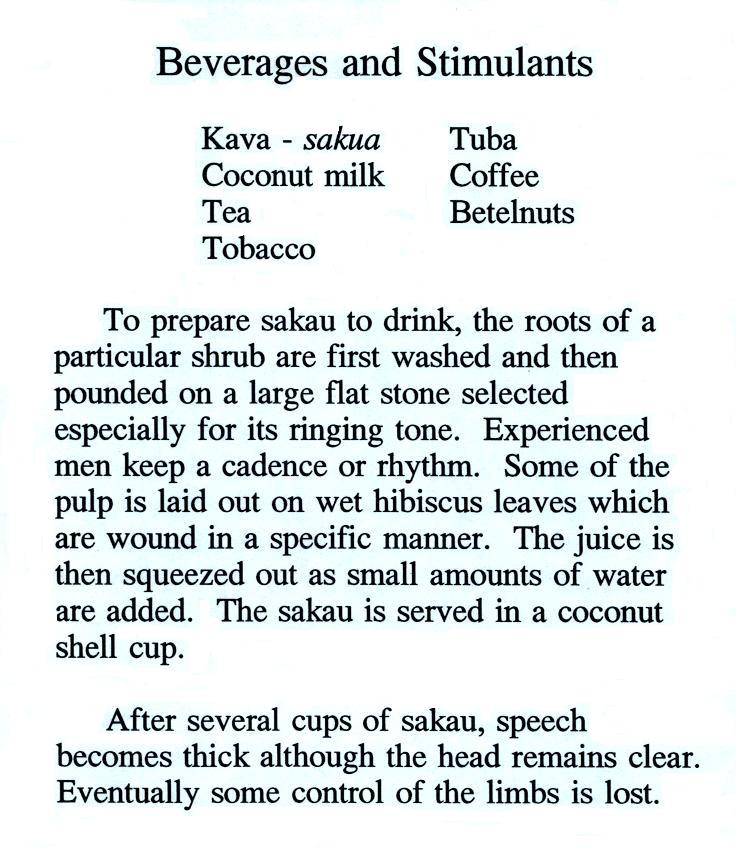
We also had a chance to sample some of the local beverages.
Drinking kava or sakau (as it is called on Pohnpei) turns your
mouth and throat numb. It is supposed to relax you, make you
sleep more fully, and doesn't seem to have any after
effects. Until fairly recently you could buy kava in pill
form at local supermarkets. However, because of reports that
it can cause serious liver problems, that is no longer the
case. There are no reports of liver problems when drinking
kava that has been prepared in the traditional way. Here is a link to a
Wikipedia article on kava.
We never tried betelnut. Areca nuts are wrapped in betel
leaves and chewed together with lime (lime is pretty caustic, that
is one of the reasons I didn't try betelnut). The resulting
mixture is a mild stimulant (some people add tobacco to the
mix). The most interesting aspect, however, is that chewing
betelnut colors your mouth and teeth bright red. You don't
swallow betelnut, you spit it out. You see the bright red
stains on sidewalks and the ground wherever you go. Most
hotels will also have a large sign near the entrance reminding
guests not to chew betelnut inside the hotel. You can read
more about betelnut here.