Monday, Mar. 21, 2016
Elle King: "Can't be
Loved" (3:47), "Good For
Nothin' Woman" (3:02), "Playing
for Keeps" (4:15), "In the
Water" (4:01), "See You
Again" (3:26), "Make You
Smile" (2:31)
The Experiment #1 revised reports, all but about 25 of
the 1S1P reports on Ultraviolet Light, Quiz #2 have all been
graded. Also "mid term" grade summaries were prepared
over the break and were available for pickup in class
today. You'll find more information about the grade
summaries at the end of today's notes.
I forgot to mention a couple of
things before class:
1. A few students
have reached the 45 pt. maximum number of points allowed on
1S1P reports. You can't earn more than 45 pts so there
is no reason to write any
additional 1S1P reports.
2. There is a new
1S1P Topic available for your consideration. The
tentative due date is Wed., Mar. 30 (I may extend that until
Fri., Apr. 1 given that I forgot to
mention this in class today)
Between now and Quiz #3
we'll learn about humidity variables. These are ways of
measuring and tracking the amount of moisture in the
air. We'll learn a little bit about how clouds form and
will learn how to identify and name clouds. Only 2 of
the 10 basic cloud types are able to produce significant
amounts of precipitation. It's not as easy to produce
precipitation as you might think. This is something else
we'll be looking at.
There was a short in-class Optional Assignment
handed out in class today. If you weren't in class
and would like to do the assignment and turn it in at the
start of class on Wed., you can download
a copy here.
Today: humidity variables
Humidity = moisture
(water vapor) in the air.
This
topic and the terms that we will be learning are probably
new and might be confusing. So here's an
introduction. We will be mainly be
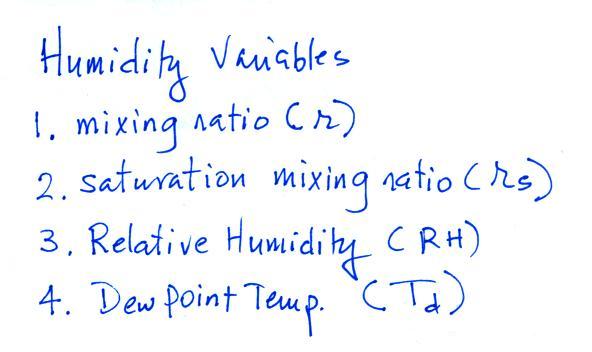
interested in 4 variables:
Your task will be to learn the
"jobs" of these variables, their units, and what can cause them
to change value.
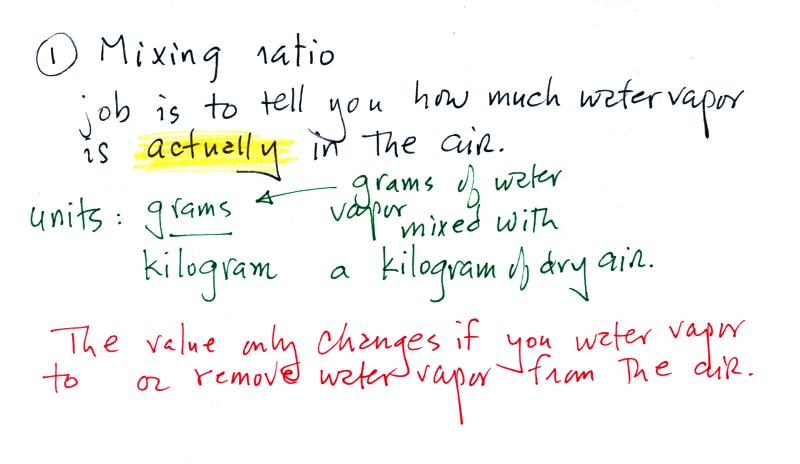
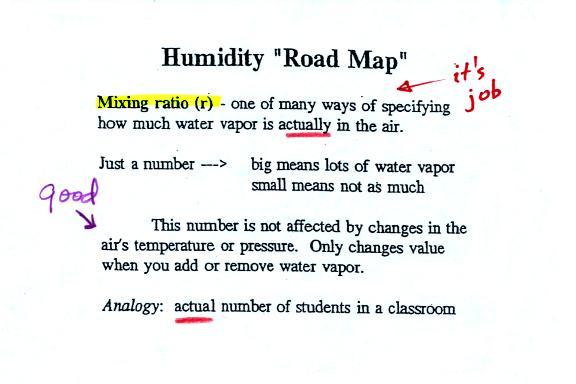
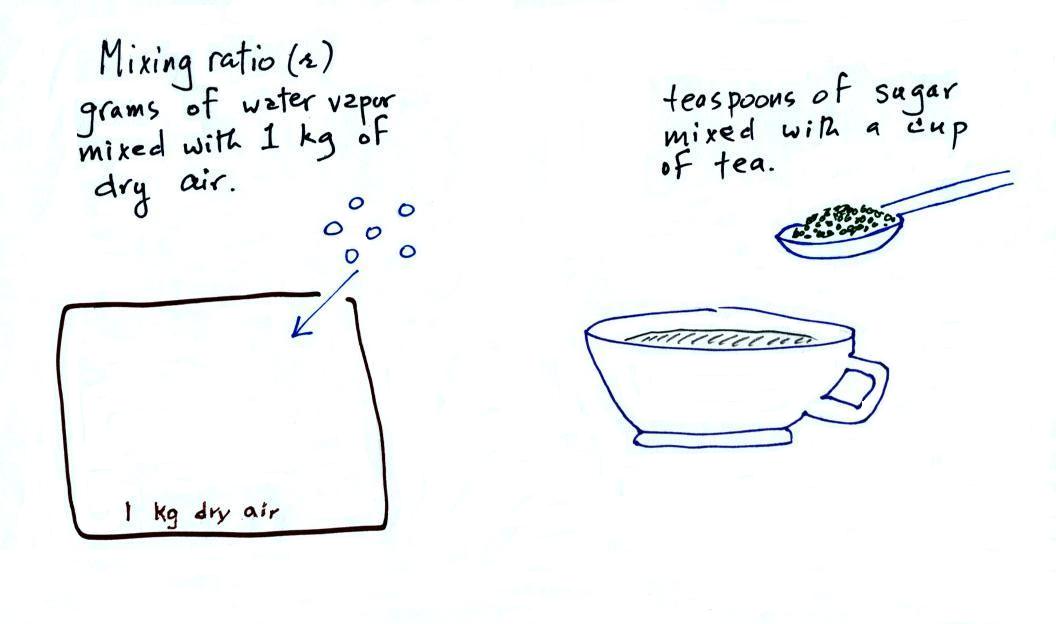
Mixing ratio ( r )
The bottom half of the figure below can
be found on p. 83 in the ClassNotes.
Mixing ratio tells you how much water vapor
is actually
in the air. Mixing ratio has units of grams of
water vapor per kilogram of dry air (the amount of water vapor
in grams mixed with a kilogram of dry air). A kilogram
of air is about one cubic meter of air (about one cubic yard
of air). Mixing ratio is basically the same idea as teaspoons
of sugar mixed in a cup of tea. We'll use a lower case r
to represent mixing ratio.
The value of the mixing ratio won't change
unless you add water vapor to or remove water vapor from the
air. Warming the air won't change the mixing
ratio. Cooling the air won't change the mixing ratio (with one exception
- when the air is cooled below its dew point temperature and
water vapor starts to condense). Since the mixing
ratio's job is to tell you how much water vapor is in the air,
you don't want it to change unless water vapor is actually
added to or removed from the air.
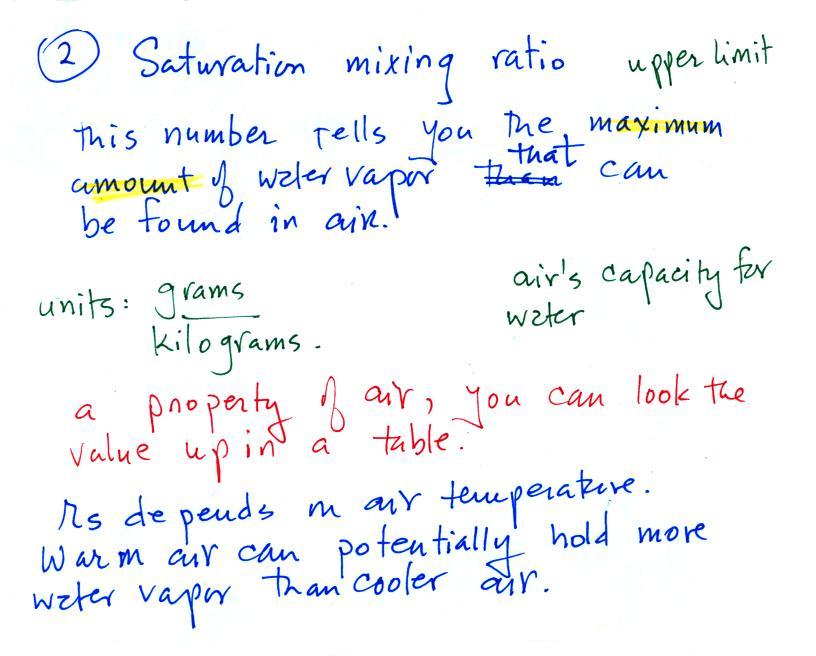
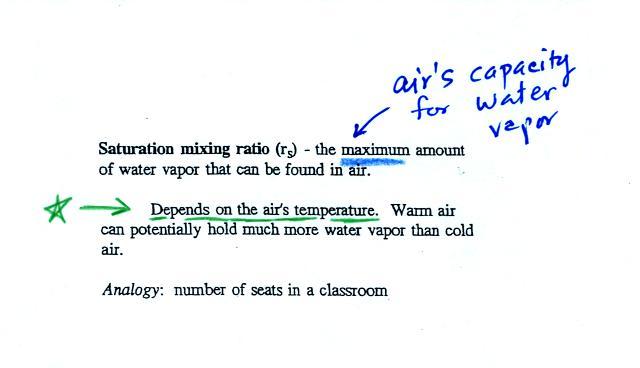
Saturation mixing ratio ( rS )
Saturation mixing ratio is just an upper limit
to how much water vapor can be found in air, the air's capacity
for water vapor. It's a property of air and depends on
the air's temperature; warm air can potentially hold
more water vapor than cold air. It doesn't
say anything about how much water vapor is actually in the air
(that's the mixing ratio's job). This
variable has the same units: grams of water vapor per kilogram
of dry air. Saturation mixing ratio values for different
air temperatures are listed and graphed on p. 86 in the
ClassNotes.
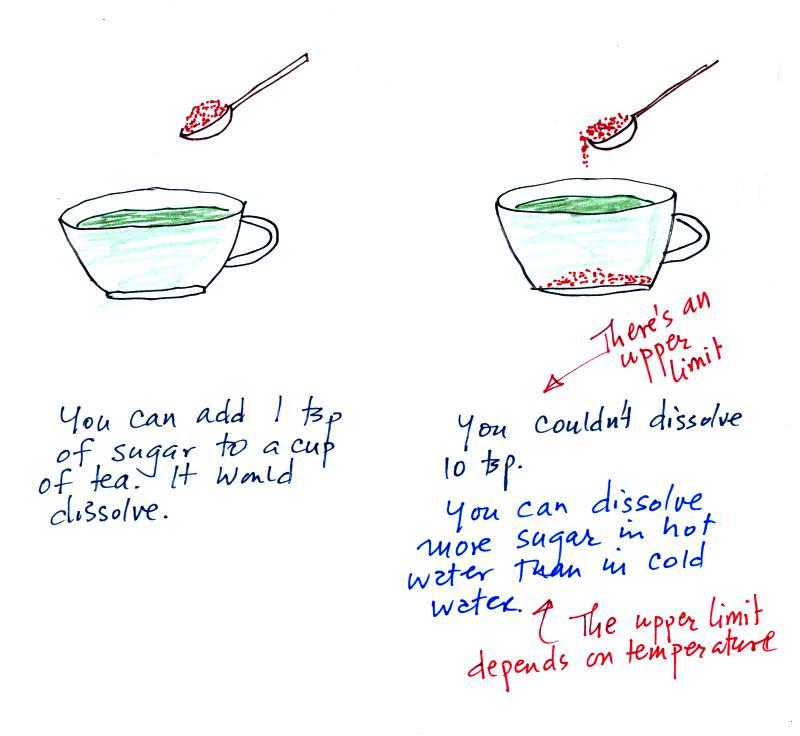
The sugar dissolved in tea analogy is still
helpful. Just as is the case with water vapor in air,
there's a limit to how much sugar can be dissolved in a cup of
hot water. And not only that, the amount depends on
temperature: you can dissolve more sugar in hot water than in cold
water.
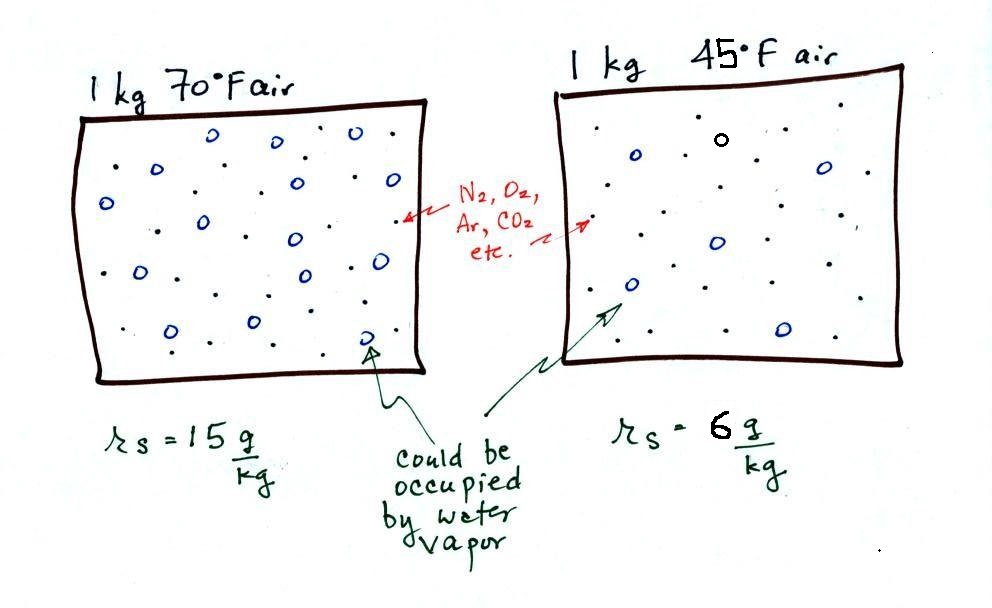
The dependence of saturation mixing ratio on air
temperature is illustrated below:
The small specks represent all
of the gases in air except for the water vapor. Each of
the open circles represents 1 gram of water vapor
that the air could potentially hold. There are 15 open
circles drawn in the 1 kg of 70 F air; each 1 kg of 70 F air
could hold up to 15 grams of water vapor. The 45 F air
only has 6 open circles; this cooler air can only
hold up to 5 grams of water vapor per kilogram of dry air.
The numbers 15 and 5 came from the table on p. 86.
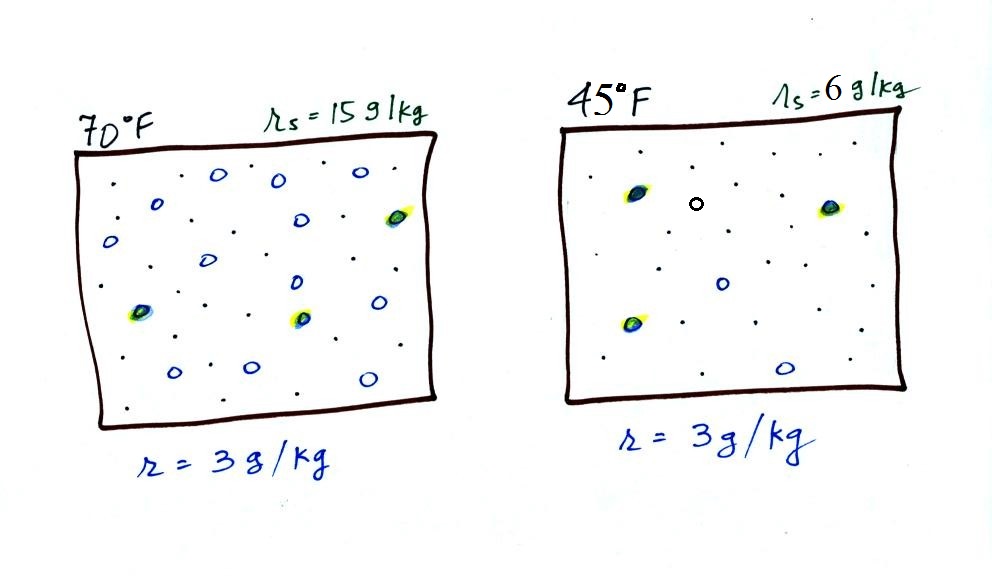
Now we have gone and actually
put some water vapor into the volumes of 70 F and 40 F air (the
open circles are colored in). The same amount, 3 grams of
water vapor, has been added to each volume of air. Three
of the open circles have been colored in. The mixing
ratio, r, is 3 g/kg in both cases. One of the
figures is almost filled to capacity, with water vapor the other
is not. That's basically what the 3rd humidity variable,
relative humidity, tells us
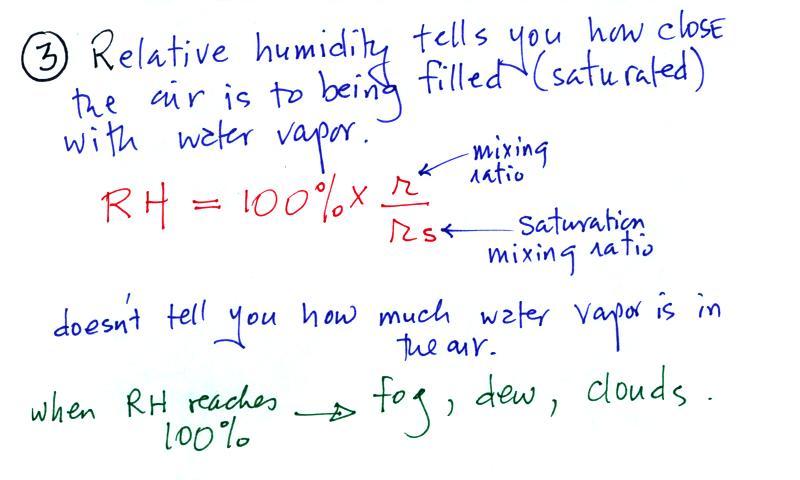
Relative humidity (RH)
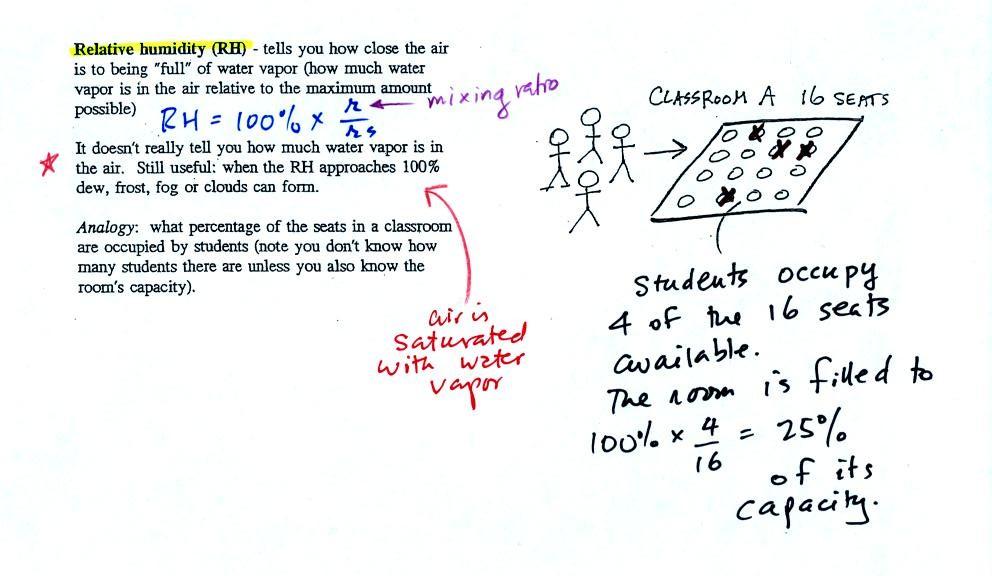 |
The relative humidity is the
variable most people are familiar with. It tells you how
"full" the air is with water vapor, how close it is to
being filled to capacity with water vapor, how
close the air is to being "saturated" with water
vapor. RH has units of %.
In the analogy (sketched on the right hand side of p. 83 in
the photocopied notes) 4 students wander into Classroom A which
has 16 empty seats. Classroom A is filled to
25% of its capacity. You can think of 4, the
actual number of students, as being analogous to the mixing
ratio. The classroom capacity is analogous to the
saturation mixing ratio. How full the room is is analogous
to the relative humidity.
The figure below goes back to the volumes (1 kg each) of 70 F
and 40 F air that could potentially hold 15 grams or 5 grams of
water vapor.

Both the 70 F and the 40 F air each contain 3 grams of water
vapor. The 70 F air is only filled to 20% of capacity (3 of
the 15 open circles is colored in) because this warm air's
capacity, the saturation mixing ratio, is large. The RH in
the 40 F is 60% even though it has the same actual amount of water
vapor because the 40 F air can't hold as much water
vapor and is closer to being saturated.
Something important to note: RH doesn't
really tell you how much water vapor is actually in the air.
The two volumes of air above contain the same amount of water
vapor (3 grams per kilogram) but have very different values of
relative humidity. You could just as easily have two volumes
of air with the same relative humidity but different actual
amounts of water vapor.
What is the RH good for if it doesn't tell you how much
moisture is in the air? When the RH reaches 100% dew, fog,
and clouds form. RH tells you whether clouds or fog are
about to form or not.
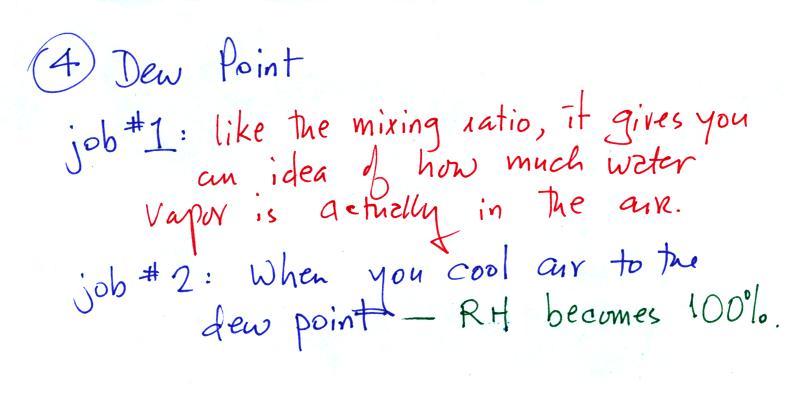
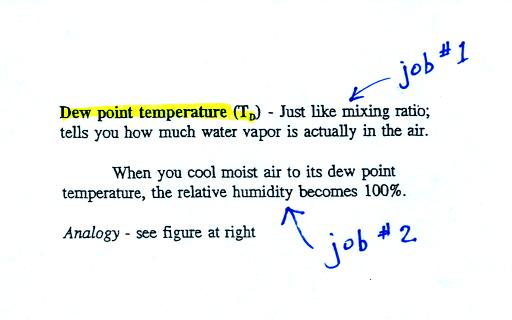
Dew point temperature
The dew point temperature has
two jobs. First it gives you an idea of the actual amount
of water vapor in the air. In this respect it is
just like the mixing ratio. If the dew point temperature
is low the air doesn't contain much water vapor. If it is
high the air contains more water vapor. This is something
we learned early in the semester.
The dew point is a temperature and has units of
oF or oC
Second the dew point tells you how much you
must cool the air in order to raise the RH to 100% (at which
point a cloud, or dew or frost, or fog would form). This
idea of cooling the air until the RH increases to 100% is
important and is something we will use a lot.
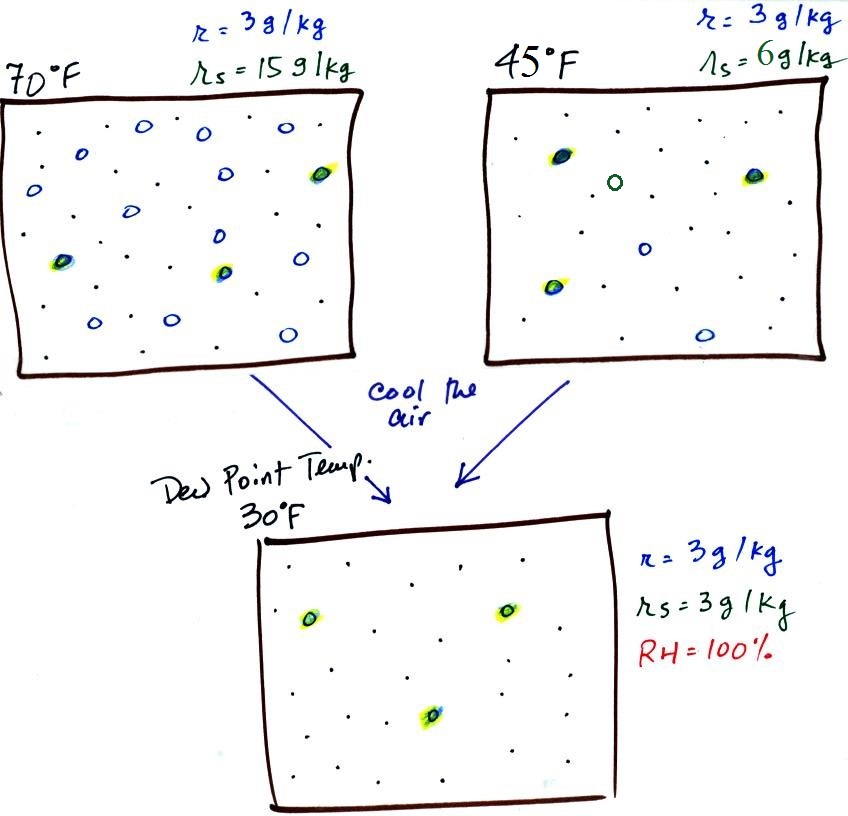
If we cool the 70 F air or the 40 F air to 30
F we would find that the saturation mixing ratio would decrease
to 3 grams/kilogram. Since the air actually contains 3
g/kg, the RH of the 30 F air would become 100%. The 30 F
air would be saturated, it would be filled to capacity with
water vapor. 30 F is the dew point temperature for 70 F
air that contains 3 grams of water vapor per kilogram of dry
air. It is also the dew point temperature for 40 F air
that contains 3 grams of water vapor per kilogram of dry air.
Because both volumes of air had the same amount of water
vapor, they both also have
the same dew point temperature.
Now back to the
student/classroom analogy.
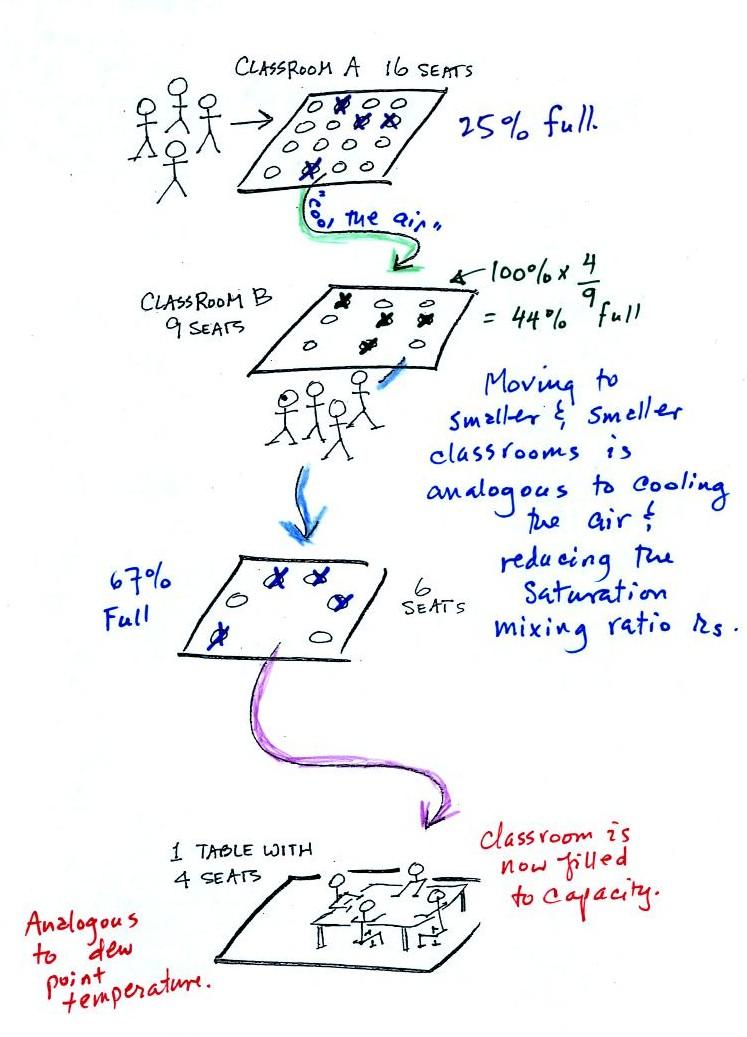
The 4 students move into classrooms of
smaller and smaller capacity. The decreasing capacity of
the classrooms is analogous to the decrease in
saturation mixing ratio that occurs when you cool air.
Eventually the students move into a classroom that they just
fill to capacity. This is analogous to
cooling the air to the dew point.
Example grade summary
Grade summaries were handed out in class today. Here's an
example (most of the values are class averages)
quiz1 -54.0 (215.0 pts possible) 76.7%
quiz2 -49.0 (170 pts possible) 71.2%
1.5 EC points (2.45 pts possible)
writing scores: 0.0 (expt/book report) + 27.0 (1S1P pts)
writing percentage grade estimate: 98.8%
average (no quiz scores dropped): 78.9% + 1.5 = 80.4
average (lowest quiz score dropped): 82.2% + 1.5 = 83.7%
* because you haven't completed the experiment or book report
yet (or your report hasn't been graded yet) an average score of
34 was
used to compute your writing grade
The first two items are your scores on the
quizzes. If you did the Upper Level Charts Optional
Assignment and chose to have points added to your Quiz #2
score they have been included. There are two more
quizzes left this semester.
The next line shows the Extra Credit points earned so far this
semester.
Your writing score and writing percentage grade are
next. This is made up of your experiment report grade
(up to 40 pts) and the number of 1S1P pts you've earned so far
(this should be 45 pts by the end of the semester). If
you turned in an Expt. #1 or Expt. #2 report the grade summary
will show the grade you received (the revised Expt. #1 reports
have been graded and were included). A score of 0 is
shown for everyone else. If you haven't received credit
for an experiment report yet, the computer has assumed an
average score of 34 out of 40 points just to show you the
effect that your writing grade will have on your overall
grade. The computer has also taken into account the fact
that most students haven't earned 45 1S1P pts at this point in
the semester (the average student has earned 27 points so
far). The writing percentage grade has the same weight
as a quiz. You should end up with a writing percentage
grade near 100% by the end of the semester.
The 1S1P reports on Ultraviolet Light have been graded and are
included in the points total. The reports on the
Equinoxes or the Seasons haven't been graded yet.
Finally two overall averages are computed:
(i) the first doesn't drop any quiz scores. This is the
score that must be 90.0 or above at the end of the semester in
order to be exempt from the Final Exam.
(ii) the lowest quiz score is dropped when computing the 2nd
average. If you do have to take the Final Exam, this is
the grade you would have going into the Final Exam. Your
overall grade for the class would be based on this average and
the score you receive on the Final Exam.
These grade estimates attempt to predict the grade you will
end up with at the end of the semester if you keep on doing as
you have done so far. If you're happy with your overall
average, you need to keep up the quality of work you have done
so far. If your score is lower than you'd like there is
still plenty of time for improvement.
Be sure to check that all of the information on your grade
summary is correct.