El Niño

You may have heard mention, in recent weeks, of the
El Niño weather phenomenon that appears to affecting winter weather across the US this year.  The unusually strong El Niño is probably largely responsible for the wetter than normal conditions this winter in southern Arizona.  The goal of this 1S1P topic is to provide a basic explanation of what El Niño is and to give you some idea of the weather changes these events bring, not just in the desert southwest but across the US and in other parts of the world.

The term
El Niño was originally used to refer to the annual appearance of warm water off the coast of Peru and Ecuador.  Ordinarily there is a northward-flowing current along the west coast of South America.  It's a cold current because it originates at polar latitudes (a cold southward-flowing current, the California current, is found along the west coast of North America).  Also, for reasons that we won't discuss, the motion of this current along the coast produces upwelling (water from deeper in the ocean moves to the ocean surface).  This cold water is rich in nutrients that nourish sea life in the area and fishing is an important part of many local coastal communities. 


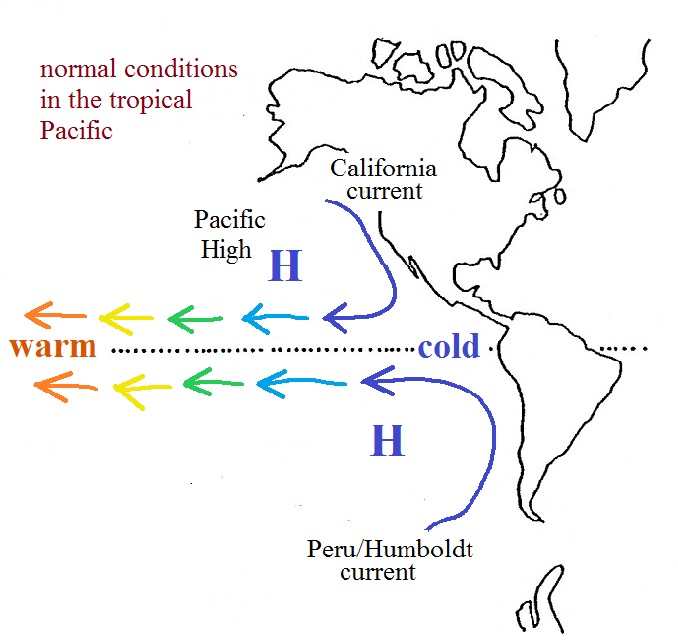
Winds spinning around the semi permanent subtropical High pressure centers (clockwise around the Pacific high in the northern hemisphere and counterclockwise around its counterpart in the southern hemisphere) drive the California current and the Peru/Humboldt current.  At the 
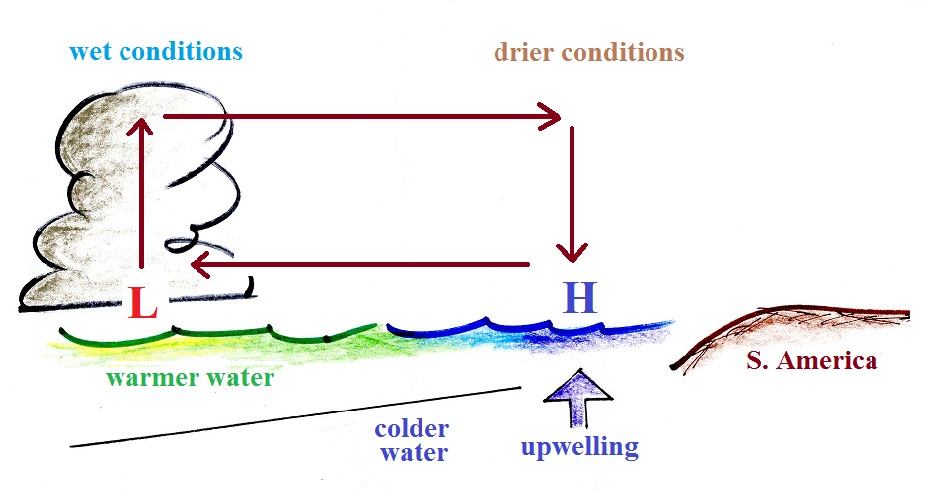
equator the easterly trade winds carry water from the eastern Pacific toward the west (sea level in the western Pacific is slightly higher than in the eastern Pacific).  Sunlight warms the water as it moves westward and some of the warmest ocean water in the world is normally found in the western tropical Pacific (almost 10 C warmer than in the eastern Pacific).  The westward moving north equatorial and south equatorial currents are shown above.  Not shown in the figure is a return current, the eastward flowing equatorial countercurrent that transports water in the opposite direction.


Here's how the normal situation might look in cross-section.  Colder water in the east, warmer water in the west.  Notice the surface L and H pressure over the warm and cold parts of the picture and the air circulation pattern that is established.  This circulation pattern resembles thermal circulations that form on much smaller scales and a topic that we will cover later in the semester.  This circulation is known as the Walker Circulation, named after Gilbert Walker, a British scientist who worked for a time in India trying to predict the Indian Monsoon.  Rising air in the west tends to produce wet conditions there.  It is generally drier in the east where sinking air motions are found.

Back to the coast of South America.  Around Christmas-time every year, a southward-flowing current develops along the coast of South America and brings in warmer water.  Upwelling is reduced and there is a decline in the fish catch. 
This yearly disruption was given the name El Niño, Spanish for the "Christ Child," because it usually occurs around around Christmas.  The warming of the coastal waters is usually limited to a small region off the coasts of Peru and Ecuador and conditions usually return to normal by March or April.


Every few years, a much larger and longer lasting disruption occurs.  The trade winds weaken or reverse direction, the equatorial countercurrent strengthens, and warm water from the western Pacific moves eastward, sometimes reaching the west coast of north and south America.  We now use the term El Niño to refer to these larger, longer lasting, every-few-year events.


This is a plot of the actual Sea Surface Temperature Anomolies (anomoly just means departure from normal, how do these temperatures compare to average temperatures).  The band of orange and red color in the center of the picture indicates sea surface temperatures near the Equator extending from the central to eastern Pacific running perhaps 3 to 4 C warmer than normal.  Ocean surface temperatures in the western Pacific are about average or just slightly cooler than average.  An updated version of this figure and information about El Niño  can be found at the National Oceanic and Atmospheric Administration's El Niño website:  http://www.elnino.noaa.gov/  .


Here's how the switch to El Niño conditions appears in cross-section.  Note the surface pressure pattern has reversed.  Rising air and wetter than normal conditions are now found in the eastern Pacific.  In Australia and Indonesia in the western Pacific an El Niño event often brings severe drought.

The change in the sea level pressure pattern
is known as the Southern Oscillation.    You'll often see ENSO (El Niño Southern Oscillation) used to denote an El Niño event because the eastward movement of warm water and a reversal of the sea level pressure pattern usually occur together.

The El Niño that is currently underway is developing into one of the strongest ever.  The figure below gives you an idea of the timing and intensity of El Niño events that have occurred in the past 60 years or so (from: http://www.nwfsc.noaa.gov/research/divisions/fe/estuarine/oeip/cb-mei.cfm )


Red on this figure indicates warmer than normal conditions in the eastern equatorial Pacific (El Niño), blue indicates colder than normal temperatures (we won't be discussing these La Niña events).  This year's event may rival the 1982-83 and the 1997-98 events, which were the strongest in this period (strong events also occurred in 1957-58, 1965-66, and 1972-73).


source of this data:

http://www.esrl.noaa.gov/psd/cgi-bin/enso/enso.pl?output=2&variable=cdtemp&region=usa&event=e&season=win&type=a


source of this data:

http://www.esrl.noaa.gov/psd/cgi-bin/enso/enso.pl?output=2&variable=cdprcp&region=usa&event=e&season=win&type=a


These two figures provide some idea of how this year's El Niño might impact the US.  The figure at left shows temperature anomolies (oF), i.e. how did November - March temperatures during 9 El Niño years compare with non-El Niño years.  Generally speaking it is cooler than average in the southern tier of states and warmer than normal in the northern tier of states. 

In the desert southwest, we usually expect (hope) an
El Niño to bring wetter than normal conditions.  That is borne out in the figure at right which shows precipitation anomolies (inches of precipitation above or below normal).  Wetter than normal in the southern most states (much wetter than normal along the California coast, the Gulf Coast, and in Florida).  The figure below (from an article in the Los Angeles Times) shows that nearly a year's worth of rain fell in Los Angeles in February during the 1997-98 El Niño.  The fact that rainfall peaked in February might mean that the best/worst from this year's
El Niño might still be to come.


The figure below provides some explanations of what causes these changes in temperature and precipitation amounts (source: https://www.climate.gov/news-features/blogs/enso/united-states-el-ni%C3%B1o-impacts-0).


In the west the polar jet stream, the boundary between frigid polar air and somewhat warmer air at middle latitudes, moves north of its normal position.  This accounts for the warmer and drier than normal conditions in the Pacific northwest.  The subtropical jet stream extends and move further eastward and brings more storms than normal to California, the desert southwest, and the southeastern states.

The final figure in this hastily assembled introduction to El Niño provides some idea of its effects elsewhere in the world (source of the figure:

https://www.climate.gov/news-features/blogs/enso/how-enso-leads-cascade-global-impacts )