Friday, April 29, 2016
Gaelic Storm "Before
the Night is Over" (4:53), "Samurai Set"
(3:50), "Black
is the Colour" (5:32), De Dannan "Hibernian
Rhapsody" (6:48)
A tropical disturbance is just a localized cluster of
thunderstorms that a meteorologist might see on a satellite
photograph. But this would merit observation because of the
potential for further development. Signs of rotation would
be evidence of organization and the developing storm would be
called a tropical depression.
In order to be called a tropical storm the storm must
strengthen a little more, and winds must increase to 35
knots. The storm receives a name at this point.
Finally when winds exceed 75 MPH (easier to remember than 65 knots
or 74 MPH) the storm becomes a hurricane. You don't need to
remember all these names, just try to remember the information
highlighted above.
Generally speaking the lower the surface pressure at the center
of a hurricane the stronger the storm and the faster the surface
winds will blow.
This figure tries to show the relationship between surface
pressure and surface wind speed. The world
record low sea level pressure reading, 870 mb, was set by Typhoon
Tip off the SE Asia coast in 1979. Sustained winds in
that storm were 190 MPH. Three 2005 Atlantic hurricanes:
Wilma, Rita, and Katrina had pressures in the 880 mb to 900 mb
range and winds ranging from 170 to 190 MPH. I
will have to update this figure at some point to include hurricane
Patricia from Fall 2015.
Hurricane features: eye, eye wall, spiral
rain bands
A crossectional view of a mature hurricane (top) and a picture
like you might see on a satellite photograph (below).
Sinking air in the very center of a hurricane produces the
clear skies of the eye, a hurricane's most distinctive
feature. The eye is typically a few 10s of miles across,
though it may only be a few miles across in the strongest
hurricanes. Generally speaking the smaller the eye, the
stronger the storm.
A ring of strong thunderstorms, the eye wall, surrounds the
eye. This is where the hurricane's strongest winds are
found.
Additional concentric rings of thunderstorms are found as you
move outward from the center of the hurricane. These are
called rain bands. These usually aren't visible until you
get to the outer edge of the hurricane because they are covered by
high altitude layer clouds.
Hurricane Katrina making
landfall on Aug. 29, 2005. (source)
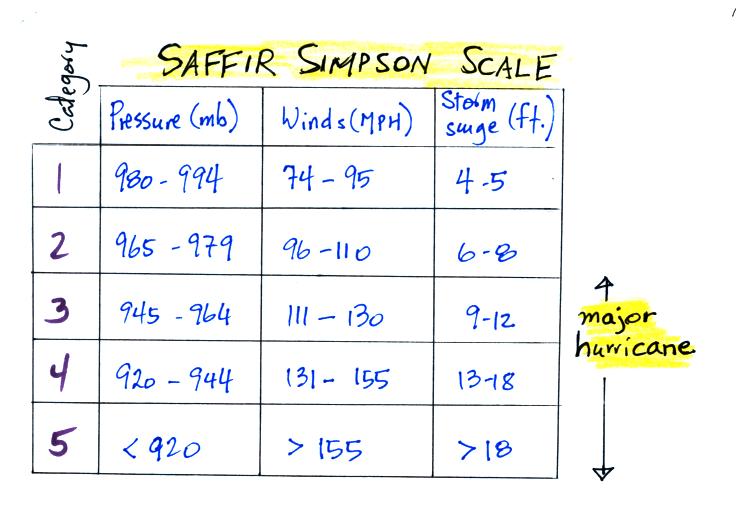
The Saffir Simpson Scale is used to rate
hurricane intensity (just as the Fujita Scale is used for
tornadoes). The scale runs from 1 to 5. Remember that
a hurricane must have winds of 74 MPH or above to be considered a
hurricane. Category 3,4, and 5 hurricanes are considered
"major hurricanes" (in other parts of the world the term super
typhoon is used for category 4 or 5 typhoons).
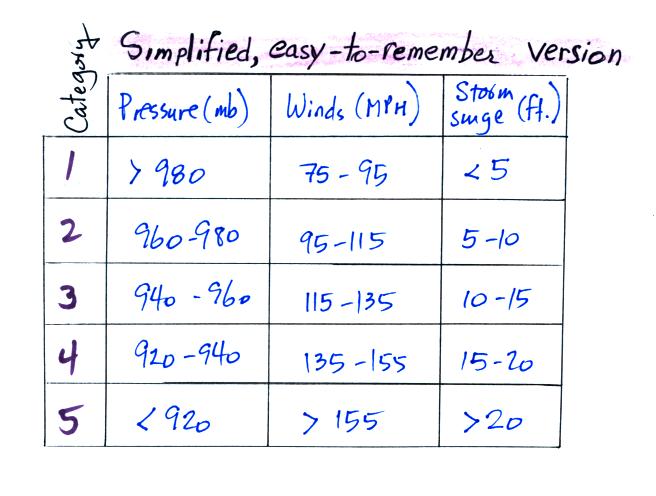
Here's an easy-to-remember
version of the scale
Pressure decreases by 20 mb, wind speeds increase by 20 MPH,
and the storm surge increases by 5 feet with every change in level
on the scale.
Caution: don't get the various scales mixed up
Scale
|
Phenomenon
|
Beaufort
|
Wind speed
|
Fujita
|
Tornado intensity
|
Kelvin
|
Temperature
|
Richter
|
Earthquakes
|
Saffir-Simpson
|
Hurricane intensity
|
Storm surge
The storm surge listed above is a rise in ocean level when a
hurricane makes landfall. This causes the most damage and
the greatest number of fatalities near a coast.
The converging surface winds associated with a hurricane sweep
surface water in toward the center of a hurricane and cause it to
pile up. The water sinks and, in deeper water, returns to
where it came from. This gets harder and harder to do as the
hurricane approaches shore and the ocean gets
shallower. So the piled up water gets deeper and
the return flow current gets stronger.
The National Weather Service has developed the SLOSH computer
model that tries to predict the height and extant of a hurricane
storm surge (SLOSH stands for Sea, Lake, and Overland Surges from Hurricanes). You can see some
animations of SLOSH predictions run for hurricanes of historical
interest (including the Galveston 1900) hurricane at a National
Hurricane Center website (http://www.nhc.noaa.gov/surge)
While watching the animations, you might notice the storm
surge is generally larger on the right hand side of the
approaching hurricane. This is something than can be
explained fairly easily.
In this figure a hurricane with 100 MPH winds is traveling from
east to west at a speed of 15 MPH.

On the north side of the hurricane, the
spinning winds and the motion of the hurricane are in the same
direction and add together. This is where you would
expect to find the strongest winds and the highest storm
surge.


