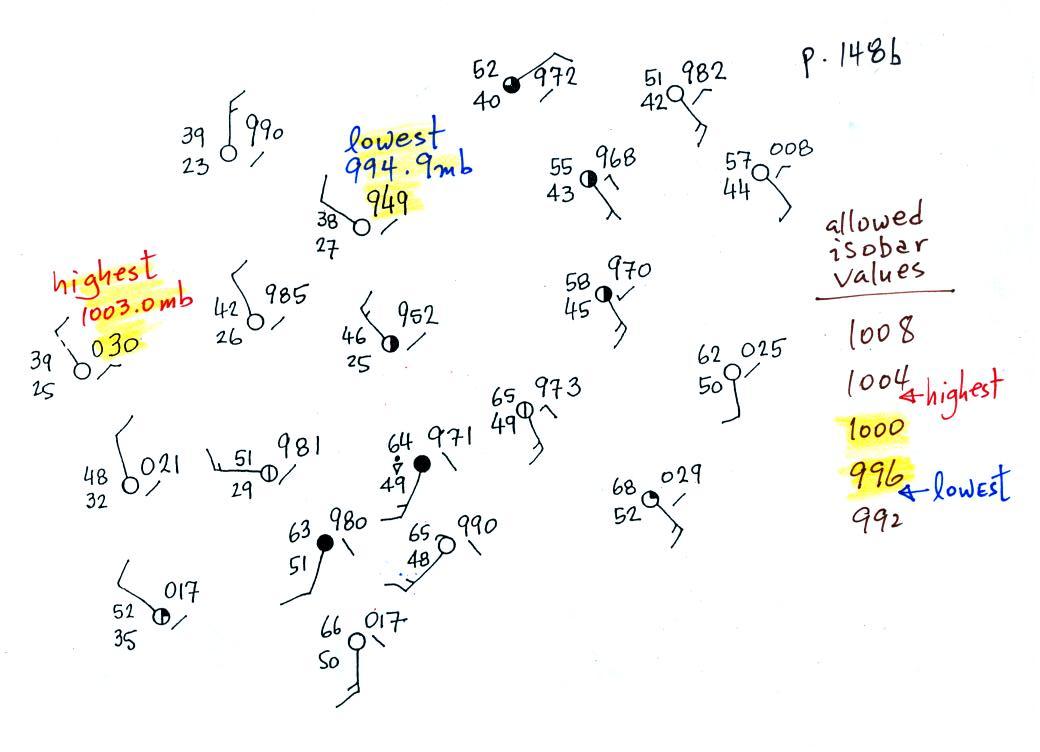
Friday Feb. 12, 2016

Haim "Honey & I" (5:31), "If I Could Change Your Mind" (3:59), "Better Off" (3:30), "Hazy Shade of Winter" (3:02).  And an extra bonus "Hazy Shade of Winter" (2:26) live in 2011 with The Bangles.

The Experiment #2 materials were available for checkout for the first time today.  There are quite a few materials left and I'll bring them to class next Monday.

The 1S1P Origin and Evolution of the Earth's Atmosphere reports have been graded but unfortunately I forgot to bring them with me to class.  I'll make an extra effort to bring them next Monday.


Here's a quick review of what we were covering in class on Wednesday

1.  Drawing in some isobars reveals the large scale pressure pattern allowing you to locate centers of H and L pressure
     H: clockwise spinning & diverging winds, sinking air and clear skies
     L: pressure (counterclockwise spinning & converging winds, rising air and the chance of clouds) centers.

2.  Contour spacing (pressure gradient)
     closely spaced contours = strong pressure gradient = fast winds
     widely spaced contours = weak pressure gradient = slower winds
       
The rest of this is new material
3.  Temperature patterns and fronts
     
The pressure pattern causes the wind to start to blow; the wind then can affect and change the temperature pattern. 

The figure below shows the temperature pattern you would expect to see if the wind wasn't blowing at all or if the wind was just blowing straight from west to east.  The bands of different temperature are aligned parallel to the lines of latitude.  Temperature changes from south to north but not from west to east. 


This picture gets a little more interesting if you put centers of high or low pressure in the middle.


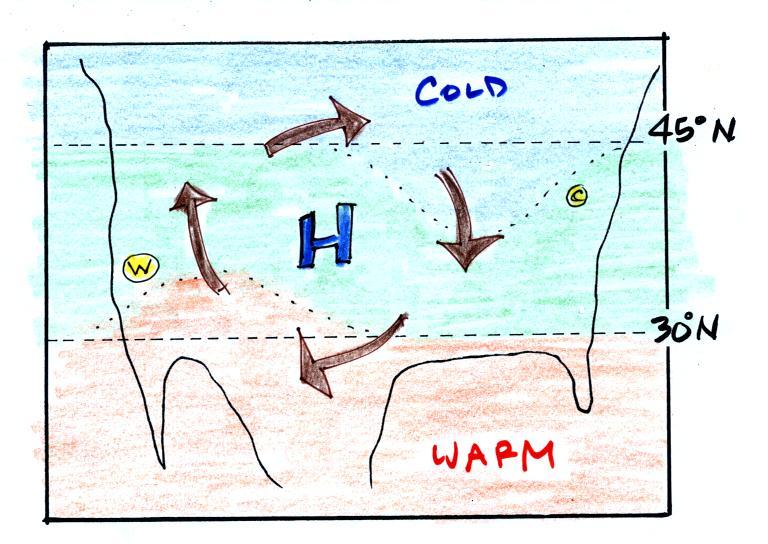
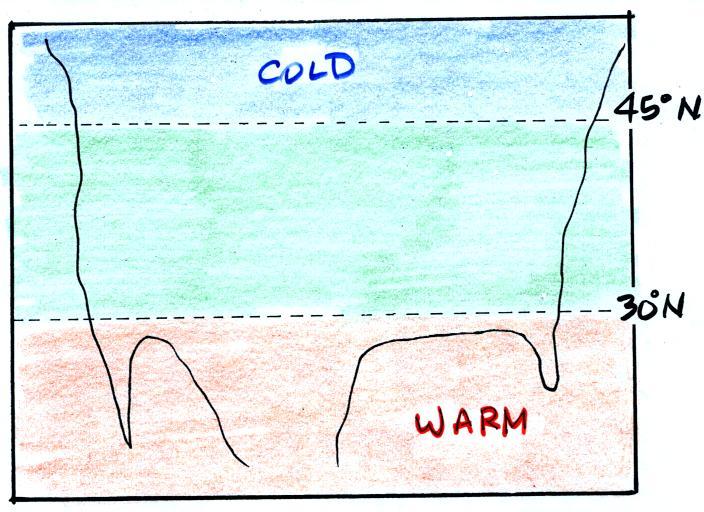
In the case of high pressure, the clockwise spinning winds move warm air to the north on the western side of the High.  The front edge of this northward moving air is shown with a dotted line (at Pt. W) in the picture above.  Cold air moves toward the south on the eastern side of the High (another dotted line at Pt. C, it's a little hard to distinguish between the blue and green in the picture).  The diverging winds also move the warm and cold air away from the center of the High.  Now you would experience a change in temperature if you traveled from west to east across the center of the picture. 

The transition from warm to cold along the boundaries (Pts. W and C) is spread out over a fairly long distance and is gradual.  This is because the winds around high pressure diverge and blow outward away from the center of high pressure.  There is also some mixing of the different temperature air along the boundaries.


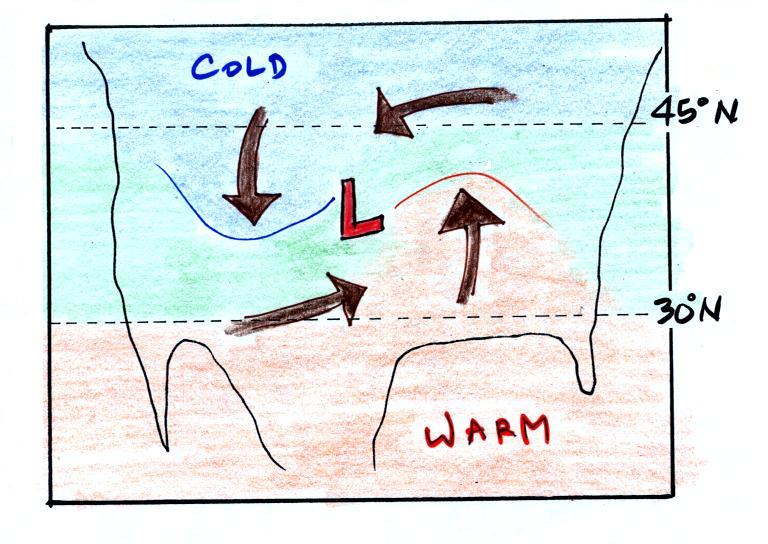
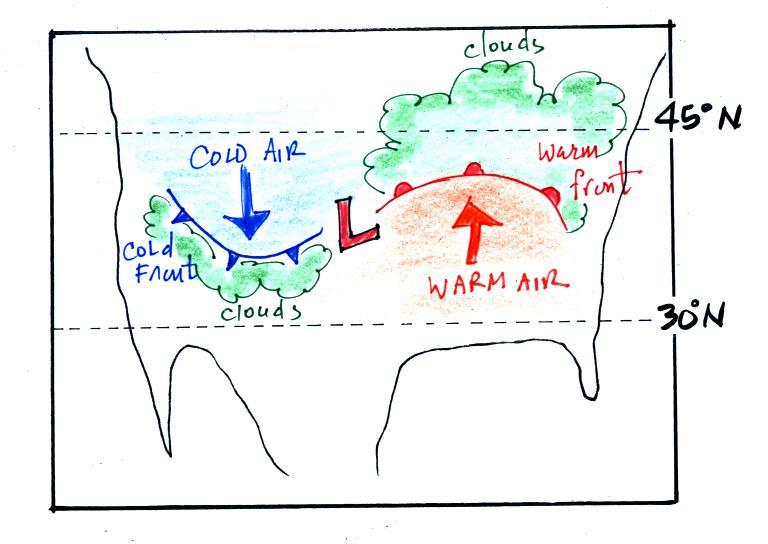
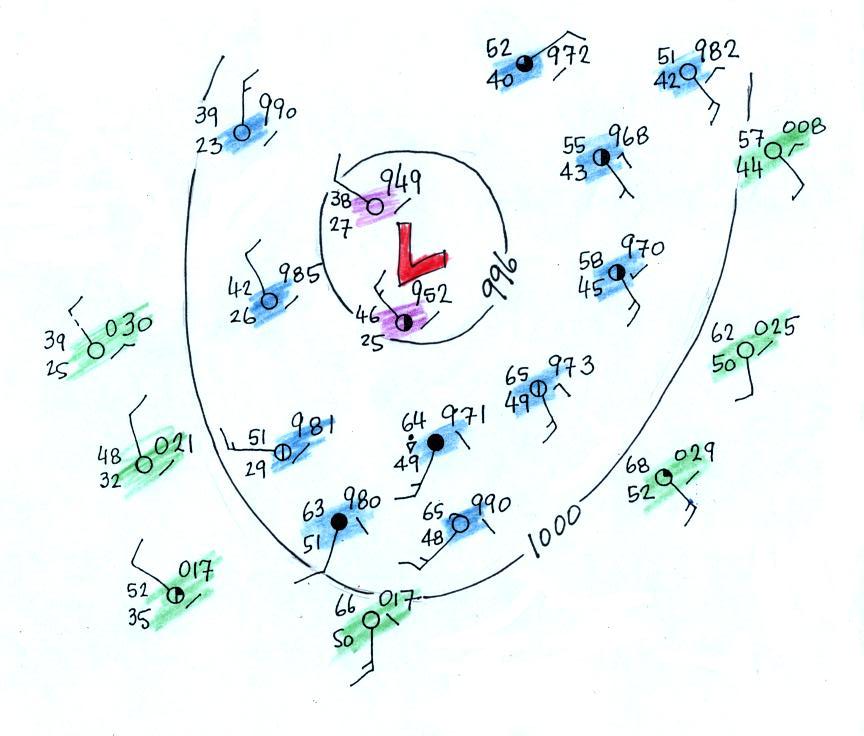
Counterclockwise winds move cold air toward the south on the west side of the Low.  Warm air advances toward the north on the eastern side of the low.  This is just the opposite of what we saw with high pressure.


The converging winds in the case of low pressure will move the air masses of different temperature in toward the center of low pressure.  The transition zone between different temperature air gets squeezed and compressed.  The change from warm to cold occurs in a shorter distance and is sharper and more distinct.  Solid lines have been used to delineate the boundaries above. These sharper and more abrupt boundaries are called fronts (there are probably additional meteorological processes that help to create fronts).

Warm and cold fronts, middle latitude storms (aka extratropical cyclones)


A cold front is drawn at the front edge of the southward moving mass of cold air on the west side of the Low.  Cold fronts are generally drawn in blue on a surface weather map.  The small triangular symbols on the side of the front identify it as a cold front and show what direction it is moving. 

A warm front (drawn in red with half circle symbols) is shown on the right hand side of the map at front edge of the northward moving mass of.  A warm front is usually drawn in red and has half circles on one side of the front to identify it and show its direction of motion.

The fronts are like spokes on a wheel.  The "spokes" will spin counterclockwise around the low pressure center (the axle).

Both types of fronts cause rising air motions.
  Fronts are another way of causing air to rise.  That's important because rising air expands and cools.  If the air is moist and cools enough, clouds can form.


The storm system shown in the picture above (the Low together with the fronts) is referred to a middle latitude storm or an extra-tropical cyclone.  Extra-tropical means outside the tropics, cyclone means winds spinning around low pressure (tornadoes are sometimes called cyclones, so are hurricanes).  These storms form at middle latitudes because that is where air masses coming from the polar regions to the north and the more tropical regions to the south can collide.

Large storms that form in the tropics (where this mostly just warm air) are called tropical cyclones or, in our part of the world, hurricanes. 


3-dimensional structure of cold fronts
A 3-dimensional cross-sectional view of a cold front is shown below (we've jumped to p. 148a in the photocopied ClassNotes)


The person in the figure is positioned ahead of an approaching cold front.  Time wise, it might be the day before the front actually passes through.  There are 3 fairly important features to notice in this picture.

1.   
The front edge of the approaching air mass has a blunt, rounded shape.  A vertical slice through a cold front is shown below at left.


Friction with the ground causes the edge to "bunch up" and gives it the blunt shape it has.  You'd see something similar if you were to pour something thick and gooey on an inclined surface and watched it roll downhill.   Or, as shown in class, you can lay your arm and hand on a flat surface.


Slide your arm to the right. 


Your fingers will drag on the table surface and will curl up and your hand will make a fist. 

2. Because it is denser, the cold air lifts the warm air out of the way.


The cold dense air mass behind a cold front moves into a region occupied by warm air.  The warm air has lower density and will be displaced by the cold air mass.  In some ways its analogous to a big heavy Cadillac plowing into a bunch of Volkswagens.

And maybe just 15 to 20 minutes into today's class you're in a position to appreciate a video recording of the cold front passing through Tucson.  The first video was a time lapse movie of a cold front that came through Tucson on on Easter Sunday morning, April 4, 1999. 
Click here to see the cold front video (it may take a minute or two to transfer the data from the server computer in the Atmospheric Sciences Dept., be patient).  Remember this is a time lapse movie of the frontal passage.  The front seems to race through Tucson in the video, it wasn't moving as fast as the video might lead you to believe.  Cold fronts typically move 15 to 25 MPH. 

The 2nd video was another cold front passage that occurred on February 12, 2012.

3.    Note the
cool, cold, colder bands of air behind the cold front.


The warm air mass ahead of the front has just been sitting there and temperatures are pretty uniform throughout.  Cold fronts are found at the leading edge of a cold air mass.  The air behind the front might have originated in Canada.  It might have started out very cold but as it travels to a place like Arizona it can change (warm) considerably.  The air right behind the front will have traveled the furthest and warmed the most.  That's the reason for the cool, cold, and colder temperature bands (temperature gradient) behind the front.  The really cold air behind a cold front might not arrive in Arizona until 1 or 2 days after the passage of the front.

Weather changes that precede and follow passage of a cold front
  
Here are some of the specific weather changes that might precede and follow a cold front


Weather variable
Behind
Passing
Ahead
Temperature
cool, cold, colder*

warm
Dew Point
usually much drier**

may be moist (though that is often
not the case here in the desert southwest)
Winds
northwest
gusty winds (dusty)
from the southwest
Clouds, Weather
clearing
rain clouds, thunderstorms
in a narrow band along the front
(if the warm air mass is moist)
might see some high clouds
Pressure
rising
reaches a minimum
falling

*  as mentioned above, the coldest air might follow passage of a cold front by a day or two.
**nighttime temperatures drop much more quickly in dry air than in moist or cloudy air.  This is part of the reason it can get very cold a day or two after passage of a cold front.

Gusty winds and a shift in wind direction are often one of the most obvious change associated with the passage of a cold front in Tucson.

The pressure changes that precede and follow a cold front are not something we would observe or feel but are very useful when trying to locate a front on a weather map.


Locating a cold front on a weather map

In the next figure we started with some weather data plotted on a surface map using the station model notation.  We'll try to make a little more sense of this data and eventually locate a cold front.  Study this example carefully because you will be doing the same thing on the 1S1P surface weather map analysis assignment.

Step #1

In some respects fronts are like spokes on a wheel - they rotate counterclockwise around centers of low pressure.  It makes sense to first locate the center of low pressure.  To do that we need to draw in a few isobars and map out the pressure pattern. 


Isobars are drawn at 4 mb increments above and below a starting value of 1000 mb.  Some of the allowed values are shown on the right side of the figure (992, 996, 1000, 1004, 1008 etc).  The highest pressure on the map is 1003.0 mb, the lowest is 994.9 mb.  You must choose from the allowed list of isobar values and pick only the values that fall between the high and low pressure values on the map.  Thus we only need to draw in  996 mb and 1000 mb isobars.
 
Step #1 cont'd

Color coding the plotted pressure values may be helpful. 
In the figure below stations with pressures lower than 996 mb have been colored in purple.  These will be enclosed by the 996 mb contour.  Pressures between 996 and 1000 mb have been colored blue.  These stations will lie outside the 996 mb contour but inside the 1000 mb isobar.  Finally stations with pressures greater than 1000 mb have been colored green.  The 1000 mb isobar will separate the blue stations from the green stations.


End of Step #1
The map below shows the same picture with the 996 mb and 1000 mb contours drawn in (it is always a good idea to label the isobars when you draw them in).


Step #2
The next step was to try to locate the warm air mass in the picture.  I'll start with a new map for clarity that keeps the isobars.  The colors now will represent different air temperatures.


Temperatures are in the 60s in the lower right portion of the map; this area has been circled in orange.  Cooler air to the west of the Low pressure center has also been identified.  Do the green, blue, purple (cool, cold, colder) bands look familiar?  Based on just the temperatures we have a pretty good idea where a cold front would be found.

Step #3
Locating and drawing in the  cold front.


Step #4
We should check the front location using some of the other weather changes (wind shift, dew point, pressure change etc.) that precede and follow a cold front.


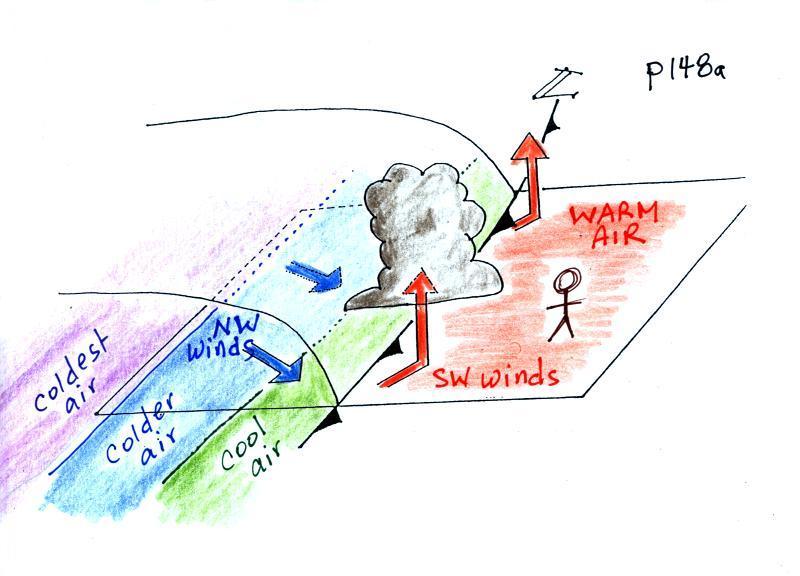
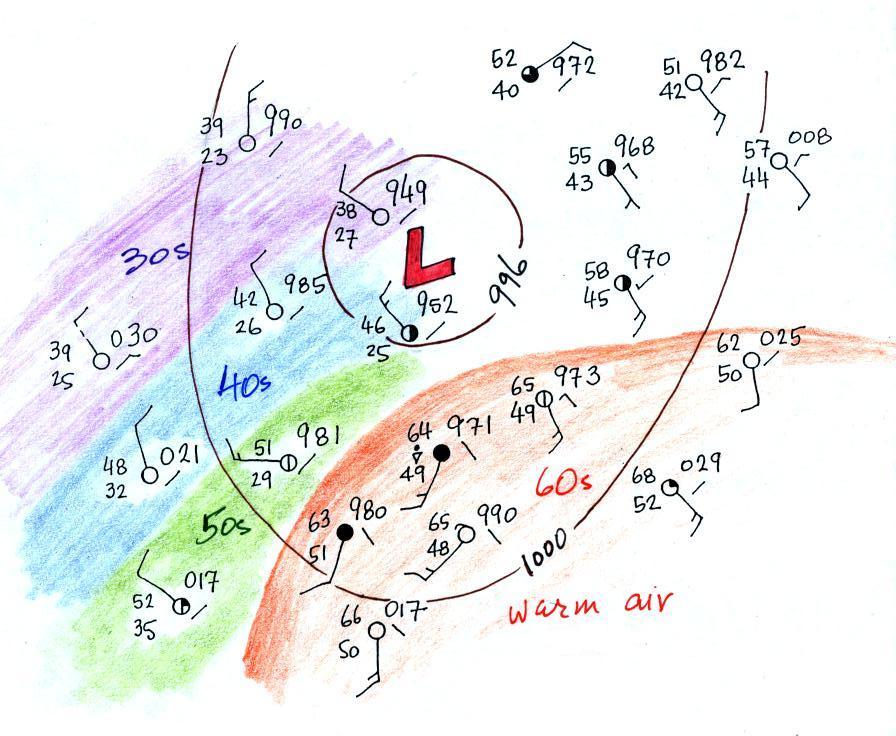
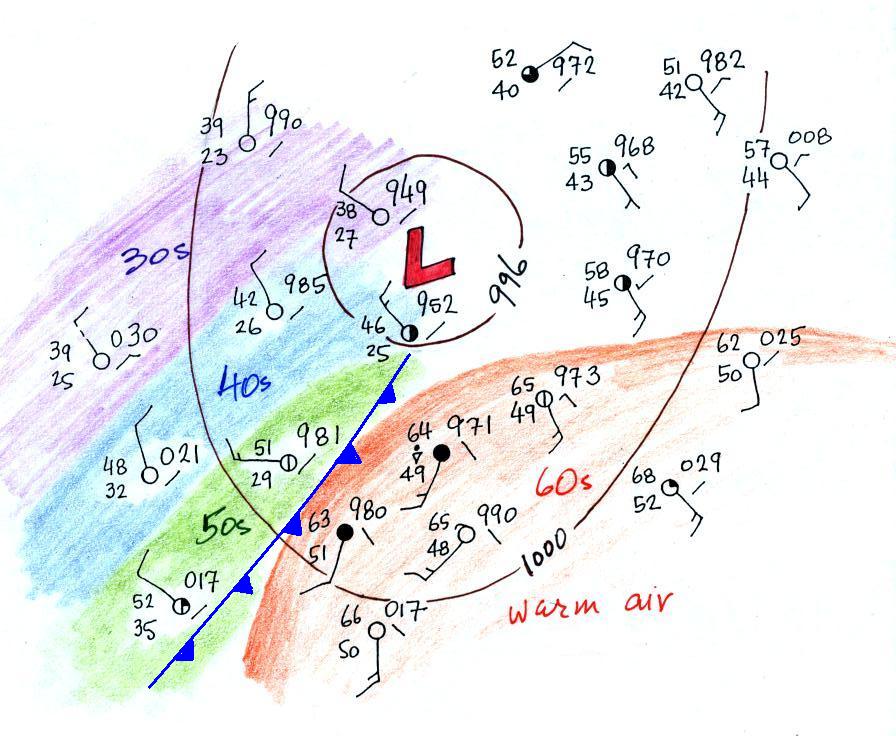
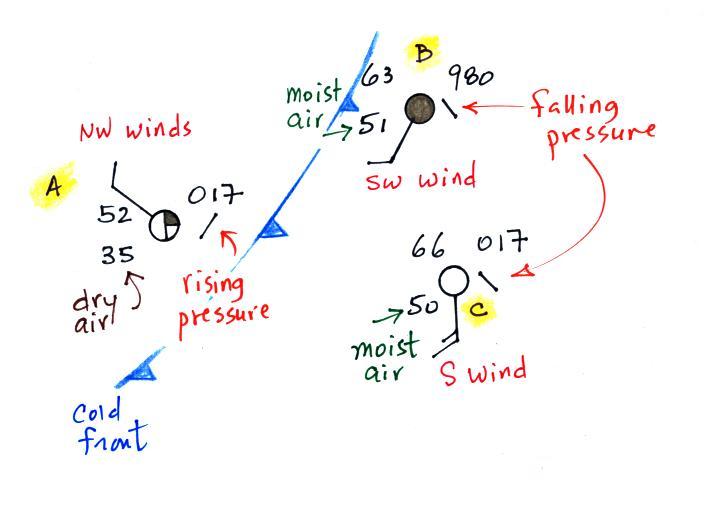
The air ahead of the front (Pts. B & C) is warm, moist, has winds blowing from the S or SW, and the pressure is falling.  These are all things you would expect to find ahead of a cold front.

Overcast skies are found at Pt. B. very near the front. 

The air behind the front at Pt. A is colder, drier, winds are blowing from the NW, and the pressure is rising.  That is just what you would expect behind a cold front.  So our location of the front looks pretty good.


This is as far as we got today.  We'll have a look at the 3-D structure of warm fronts on Monday and locate a warm front on a surface weather map