An increase in λ should be accompanied by a decrease in E. A couple of figures in the Retalis and Pitta paper confirm this:

The variation of E field during May
1986 before and after the Chernobyl accident is shown
above (Fig. 3 in the Retalis et al. (1989) paper). E field
values decreased from about 300 V/m to roughly 200 V/m in
May 1986 (though the May 86 field values seem to increase
slightly toward the end of the month).
 |
 |
Average daily E field variations in
Athens are shown in the top panel in the figure above.
Again there is a clear decrease in E field values after the
accident when conductivity values were elevated. I was
curious to see how well the E field plot at Athens matched
up with the Carnegie curve shown in the lower panel.
There is only a 2 hour time difference between local time in
Athens and Universal time so the two curves are roughly
aligned. We can see that the match is not good at all.
1(b) In this part of the problem we first had to read the conductivity values off the graph below.
1(b) In this part of the problem we first had to read the conductivity values off the graph below.

I used a values of 30 x 10-16
and 95 x 10-16 mhos/m for before and
after the accident, respectively. Note
this is the conductivity from just the positive small
ions. You need to be careful with the
variables. In this problem q is the charge on an
electron not the ion production rate. Be is
electrical mobility (for + small ions).

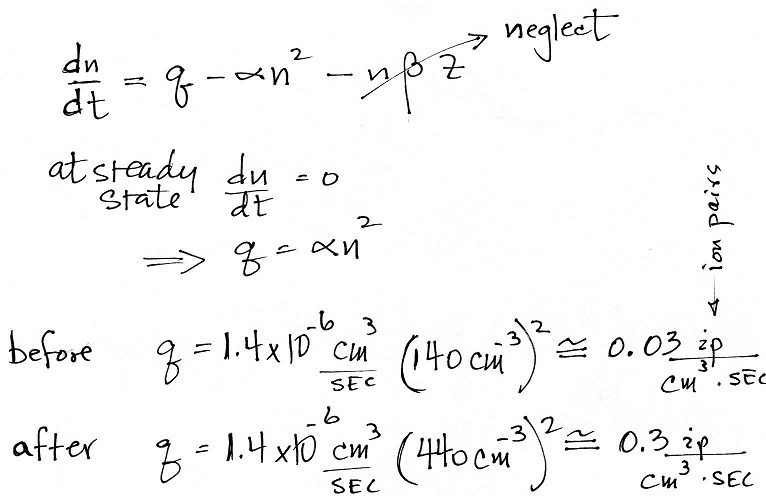
1(c) Now
that we know the steady state small ion concentrations
(postively charged small ions), we can estimate the ion
pair production rates for before and after the accident.


2. We'll
be solving the small ion balance equation for a
variety of situations.

We assume the particle concentration is so low that
the ion to particle attachment loss process is
negligible.


In 2(b) above we assumed that the
particle concentration was high enough that it
dominated and that the recombination loss mechanism
could be neglected.
In 2(c) below we assume that both recombination and ion-particle attachment loss processes are present. Obtaining a solution for n is a little more involved.

In 2(c) below we assume that both recombination and ion-particle attachment loss processes are present. Obtaining a solution for n is a little more involved.

In the next figure we'll
substitute in the numerical values above


The summary seems to make
sense, as particle concentration increases (as an
additional small ion removal process is added) the
small ion concentration decreases. With
fewer small ions we would also expect to see a
decrease in conductivity.
3. What is the capacitance of the two concentric spheres shown below?

We'll start by writing down an expression for the electric field, Er, in the region between the two spheres. Charge will be evenly distributed on the inner sphere. Er is essentially the field produced by a point charge.

We don't know what q is, it's value will be determined by V.

3. What is the capacitance of the two concentric spheres shown below?

We'll start by writing down an expression for the electric field, Er, in the region between the two spheres. Charge will be evenly distributed on the inner sphere. Er is essentially the field produced by a point charge.

We don't know what q is, it's value will be determined by V.

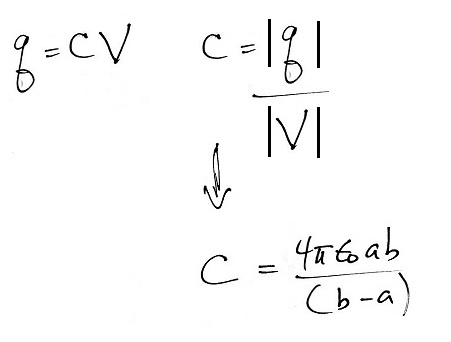
Note the troublesome
negative sign in the expression for
C. The analysis correctly predicts
that the charge q on the inner sphere will be
negative when V is positive. It probably
better to think of capacitance in the
following way:

