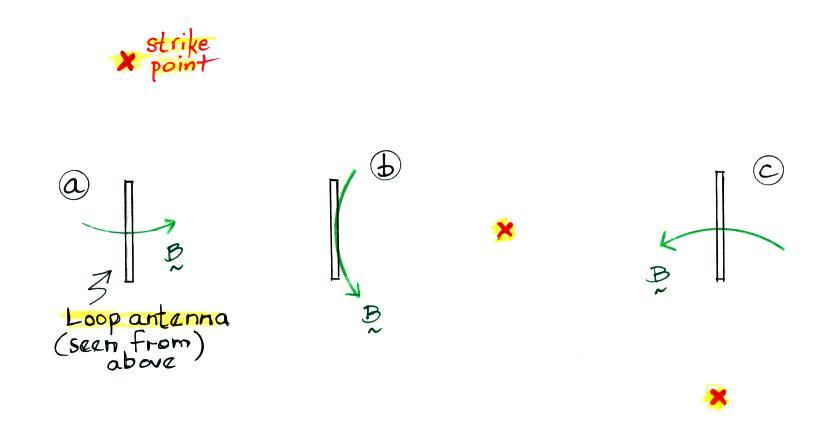
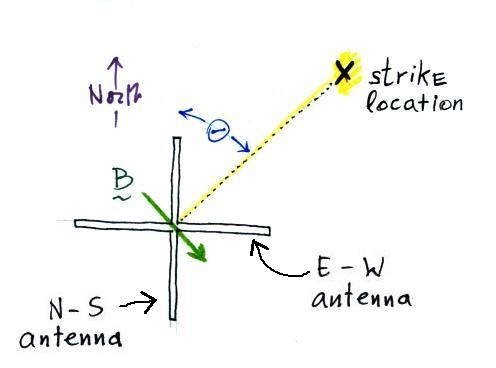
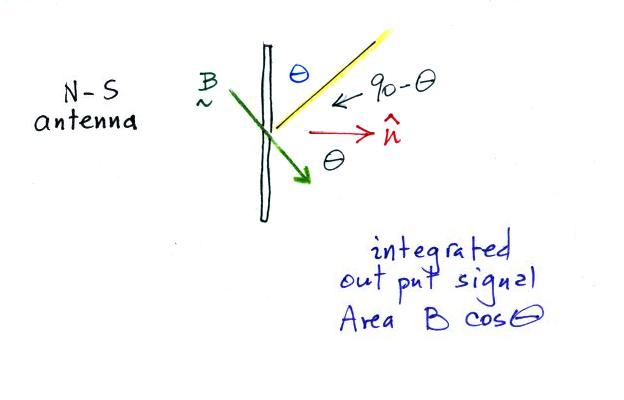
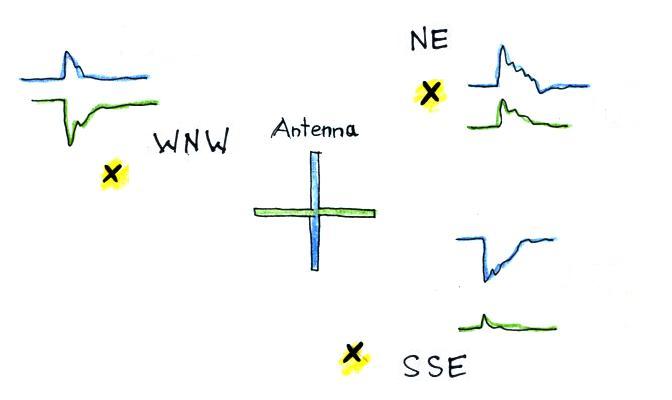
Once the
distance to the discharge is determined, the B
field amplitude (assumed to be purely
radiation field) can be used, together with an
assumed return stroke propagation velocity, in
the transmission line model to estimate the
peak current in the stroke. You could
also use the E field to estimate peak
current.
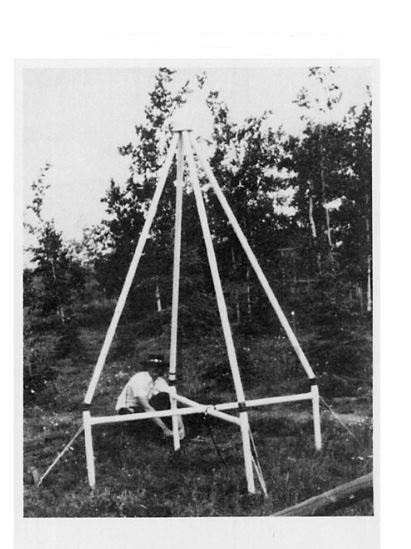
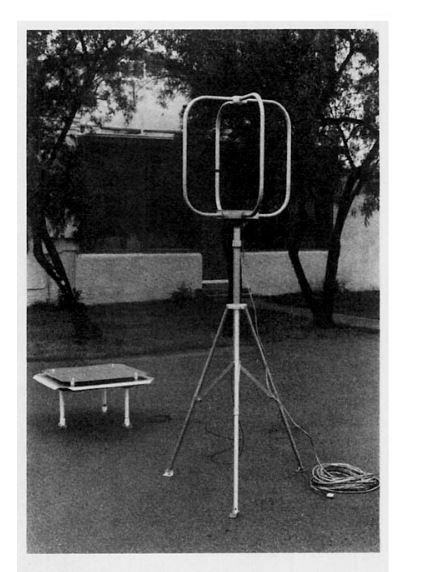
The orthogonal loop antennas used in
one of the prototype lightning locating
systems was a PVC pipe structure perhaps 8
feet tall. A picture of that antenna and
the next generation antenna, maybe only 2 or 3
feet tall are shown below (both photos from
Krider et al., 1980).
|
|
The crossed loop
magnetic field antenna used in the
original lightning locating system in
interior Alaska (late 1970s). An
early application of lightning
locations was was detection of fires
caused by lightning.
|
A photograph of the
next generation magnetic field
antenna. The accompanying
electric field antenna can be seen at
left edge of the photograph.
|
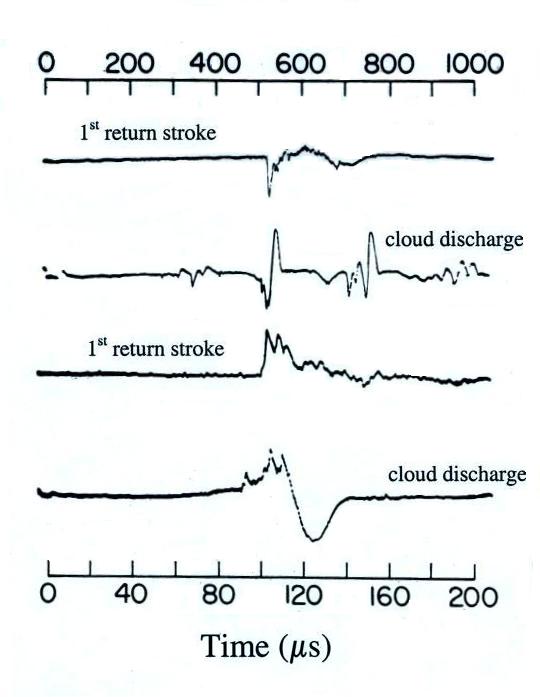
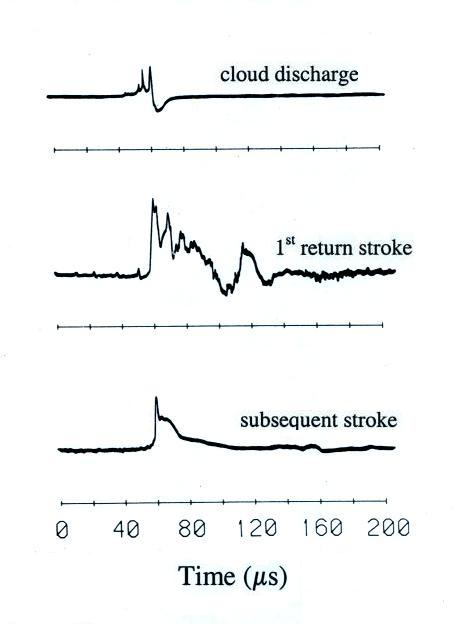
Some typical large amplitude cloud discharge
and return stroke waveforms are shown below
|
|
In the
original magnetic direction finding
systems the lightning waveform was
subjected to a series of wave shape
tests. The main objective being to
discriminate between return stroke
waveforms and waveforms from large
amplitude cloud discharges. We have
been assuming in our discussion that the
lightning channel is vertically
oriented. This is a pretty
reasonable assumption for cloud-to-ground
discharges, especially at the time of peak
field when the return stroke is close to
the ground. The unknown tilt of
cloud discharge channels will add
significant errors to the estimate of
bearing angle.
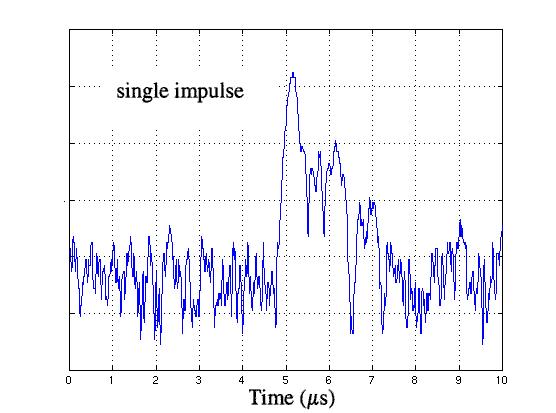
The narrow positive bipolar pulse
(NPBP) shown in the figure at right
(together with a 1st return stroke
waveform for comparison) is a not yet well
understood cloud discharge of some kind
and produces particularly strong VHF
radiation (the figure was adapted from
Willett et al., 1989)
If the waveform passes the wave shape
tests, the peak amplitudes of the NS and
the EW signals are measured. At the
time of peak signal, the return stroke is
probably within about 100 m of the
ground. Estimating the bearing angle
at this time is advantageous because you
eliminate the effects of channel branches,
the channel is usually fairly straight and
vertical, and you're locating the point at
which the stroke actually struck the
ground.
Once bearing angle estimates are made
at multiple DF sensor locations, you can
then triangulate to locate the lightning
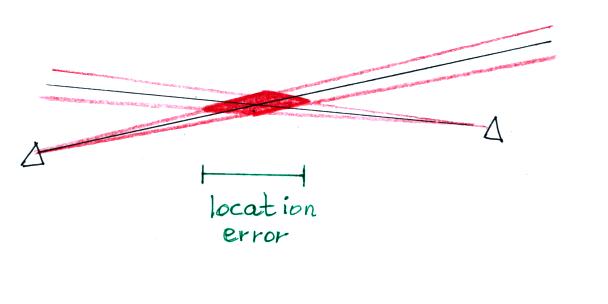
strike point. Errors in
the bearing angle estimate of course lead
to uncertainty in the lightning strike
location.
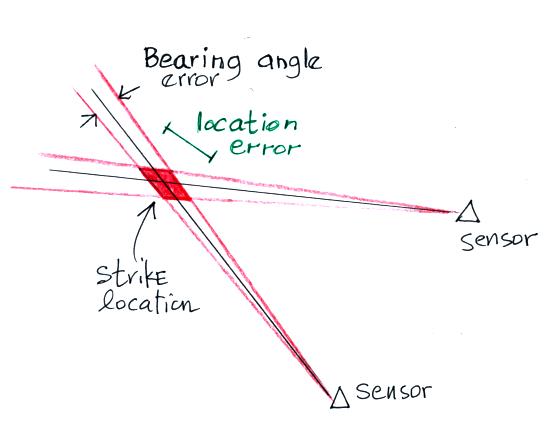
Here
we see the location determined using
bearing angles from only 2 sensors
(the minimum number required).
In the current NLDN network return
strokes with a current of 25 kA would
be detected by 6-8 sensors.
There are sophisticated methods for
determining the optimal location with
redundant data like that.
Large location errors can be
present when a lightning strike is on
or near a baseline between two
sensors.
In some of the original direction finder
networks the signal amplitudes were used to
reduce the errors in locations on or near a
baseline like this. Now, of course, most
strokes are detected at multiple
stations. Some of the other sensors
would be off the baseline and would provide
more accurate location information. As
we shall see the sensors in the present day
network also determine the time of arrival of
the lightning signal at each sensor which
provides additional independent location data.
The US National Lightning Detection
Network
One of the first uses of DF systems
was to locate lightning that might cause
forest fires in remote parts of Alaska and the
western US. For this application,
relatively larger location errors (4 to 8 km)
were acceptable. Later, as lightning
location data began to be used by the power
industry and insurance companies, it became
evident that sufficient location accuracy
would not be possible using only magnetic
direction finding unless sensors were on the
order of 100 km apart. Operation of a
network covering the continental US with that
kind of density would be too expensive (in the
current network sensors are roughly 300 to 350
km apart and there are just over 100 sensors
covering the continental US).
A need for greater location accuracy
eventually led to development of the so-called
IMPACT sensor (improved accuracy from combined
technology) that utilized both MDF and
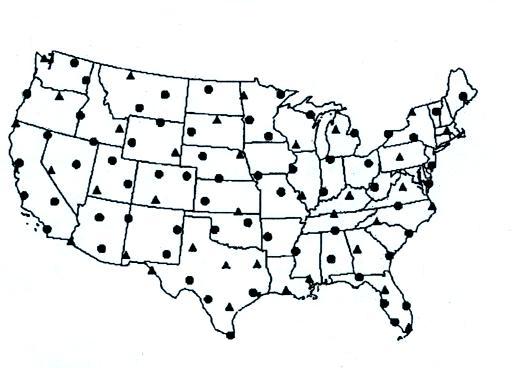
TOA. The NLDN as configured in the late
1990s is shown below (Cummins et al., 1998).
A total of 106 sensors is shown.
IMPACT sensors are shown with triangles, LPATS
sensors with circles. The LPATS sensors
were from a lightning location
network using just the TOA technique
manufactured by Atmospheric Research Systems
(ARSI) that had been installed in the US in
the late 1980s. The IMPACT sensor was
designed and manufactured by Lightning
Location & Protection, Inc. (LLP).
Time of arrival technique used to
locate lightning
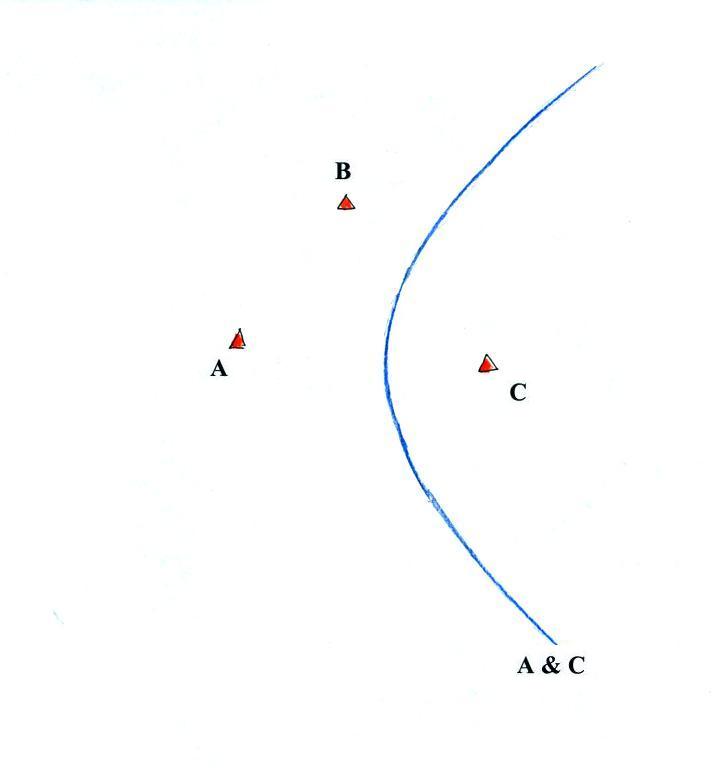
We will consider briefly the TOA technique
below. We assume that all three stations
in the figure have either precisely
synchronized clocks or accurate absolute
timing (GPS timing).
There will be a constant difference in the
time of arrival of a signal at Stations A and
C from lightning striking anywhere on the blue
curve (a hyperbola).
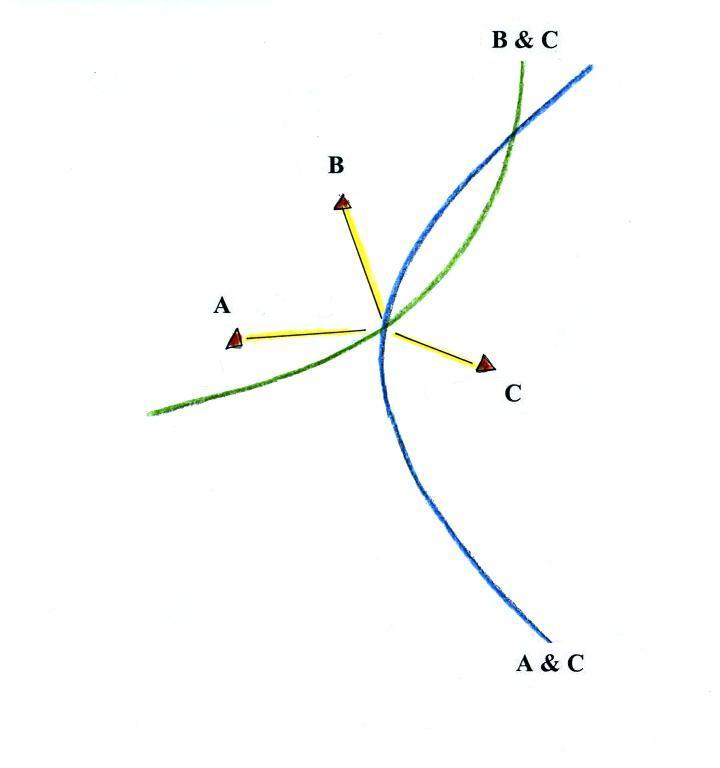
Similarly a hyperbola of constant TOA
difference for Sensors B & C can be
drawn. The two curves intersect at two
points.
You could resolve the location ambiguity by
using magnetic bearing angles from the 3
sensors as shown above.
Note
that drawing the third hyperbola, the curve of
constant TOA difference for sensors A & B
would not resolve the ambiguity. This is
because information from stations A and B was
already used in drawing the two initial (blue
and green) hyperbolas.
The figure below shows an actual example of
a discharge located using data from 5 stations
in the NLDN (from the Cummins et al. (1998)
article mentioned above).
Three IMPACT sensors (Xs in the
figure) provide TOA information and bearing
angle data. Two LPATS sensors (Os
at the centers of the blue and green circles)
provided just TOA data. Thus 8
independent pieces of information were used to
locate this discharge.
Another network upgrade was done in 2002
and all of the IMPACT and LPATS sensors were
replaced with IMPACT ESP sensors (see
Cummins et al., (2006)). The ESP
(enhanced sensitivity and performance) sensors
provide both MDF and TOA information.
The sensors were more sensitive and had faster
processing times. These improvements
increased the detection efficiency for low
amplitude return strokes. The new
sensors also had the capability of detecting
and locating some large amplitude intracloud
discharges.
Ground truth: determining NLDN
detection efficiency and location accuracy
Lightning
location data from the NLDN is now being used
in a wide variety of applications and it would
seem appropriate to briefly discuss some
recent attempts to measure the network
detection efficiency (DE) and location
accuracy (LA). With one exception, we'll
just consider validation experiments that
followed the 2002-2003 upgrade when all of the
IMPACT and LPATS sensors were replaced with
IMPACT ESP (enhanced sensitivity and
performance) sensors. The
table below summarizes measurements of DE made
by Biagi et al. (2007) in southern Arizona,
Texas, and Oklahoma.
Southern
Arizona
Year
|
Flash DE
|
Stroke DE
|
Corrected
stroke DE
|
2003
|
95%
(671 flashes)
|
78%
(2290 strokes)
|
70%
|
2004
|
91%
(426 flashes)
|
73%
(1330 strokes)
|
66%
|
Overall
|
93%
(1097 flashes)
|
76%
(3620 strokes)
|
68%
|
Texas and
Oklahoma
Year
|
Flash DE
|
Stroke DE
|
Corrected
stroke DE
|
2003
|
81%
(59 flashes)
|
75%
(126 strokes)
|
|
2004
|
94%
(308 flashes)
|
87%
(756 strokes)
|
|
Overall
|
92%
(367 flashes)
|
86%
(882 strokes)
|
77%
|
Data were collected with just a single video
camera so the location accuracy was not
measured. Simultaneous fast time
resolved measurements of fast E field and
optical signals were also made. These
data were used to estimate that about 13% of
the strokes were not resolved on the video
because of the 16.7 ms video field integration
time. This was used to determine the
corrected stroke DE values above.
These experiments showed that the increased
sensitivity of the IMPACT ESP sensors has
improved the DE. With this comes the
possibility, however, that more low amplitude
cloud discharge signals will be detected by
the NLDN and mistakenly classified as
cloud-to-ground (CG) discharges. The
data of Biagi et al. (2007) indicate this was
a problem primarily for positive polarity
signals.
Positive
Polarity (TX and OK only)
peak current
|
confirmed as
CG discharges
|
Ipk ≤ 10 kA
|
1.4 - 7%
|
| 10 kA < Ipk
≤ 20 kA |
4.7 - 26%
|
20 kA < Ipk
|
67 - 97%
|
Negative
Polarity (S. AZ, TX, and OK)
peak current
|
confirmed as
CG discharges
|
Ipk ≤ 10 kA
|
50 - 87%
|
Triggered lightning is another way of
validating NLDN performance. This has
the advantage that NLDN estimates of peak
return stroke current can be compared with
current measurements made at the triggering
site. Here we'll show results obtained
before and after network upgrades made in
2002-2003, 2010-2012 and 2013 to see how
detection efficiency (DE) and location
accuracy (LA) have improved.
Jerauld
et al. (2005) data (lightning triggered
in 2001-2003)
|
Flash DE
|
Stroke DE
|
Location
Accuracy
|
Overall
|
84%
(31 of 37 flashes)
|
60%
(95 of 159 strokes)
|
600 m
median (NLDN - known location)
difference
|
2002-2003 upgrade
(all of the IMPACT & LPATS sensors were
replaced with IMPACT ESP sensors)
Nag et al. (2011) data
(lightning triggered in 2004-2009)
|
Flash
DE
|
Stroke
DE
|
Location
Accuracy
|
Overall
|
92%
(34 of 37 flashes)
|
76%
(105 of 139 strokes) |
308 m
|
2010-2012 upgrade
(all of the IMPACT ESP sensors were
gradually replaced with fully digital LS7001
sensors)
Mallick et al. (2012) (lightning
triggered in 2010 & 2011)
|
Flash
DE
|
Stroke
DE
|
Location
Accuracy
|
Overall
|
100%
(23 of 23 flashes)
|
72%
(64 of 89 strokes)
|
436
m
|
April - August 2013
upgrade
(LS7001 sensors replaced with LS7002
sensors)
Mallick et al. (2014)
(lightning triggered in 2012 & 2013)
|
Flash
DE
|
Stroke
DE
|
Location
accuracy
|
2012
|
95%
(18 of 19 flashes)
|
76%
(77 of 101 strokes)
|
258
m
|
2013
|
100%
(12 of 12 flashes)
|
76%
(47 of 62 strokes)
|
173
m
|
NLDN locations of cloud discharges
The NLDN which originally just used MDF to
locate lightning purposely sought to identify
and exclude cloud discharges. This was
because non vertical channels would introduce
bearing angle errors. At some point in
the early 2000s a decision was made to begin
to locate cloud discharges.
Using triggered
lightning to validate NLDN peak
current estimates
Signal amplitudes
measured by the sensors in the NLDN are
also used to make estimates of lightning
return stroke peak currents. Those
estimates make use of the simple
transmission line model expression that
relates peak current I and the peak
amplitude of the electric and magnetic
radiation fields (both E and B fields are
measured by the sensors in the
NLDN). Triggered lightning return
strokes closely resemble the subsequent
return strokes in natural lightning.
Most of the lightning triggered at the
International Center for Lightning
Research and Testing (ICLRT) at Camp
Blanding in north Florida is detected and
located by the National Lightning
Detection Network. This data set can
be used to evaluate the accuracy of the
peak current estimates made by the NLDN
(at least the SE portion of the
network).
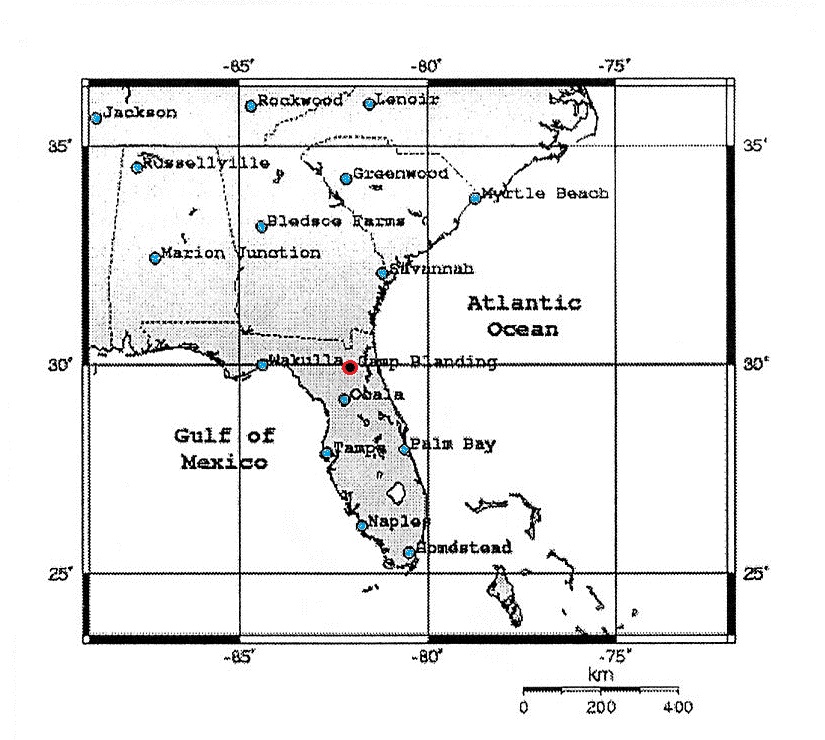
A map showing the
locations of stations in the National
Lightning Detection Network near the
International Center for Lightning
Research and Testing at Camp Blanding,
Florida.
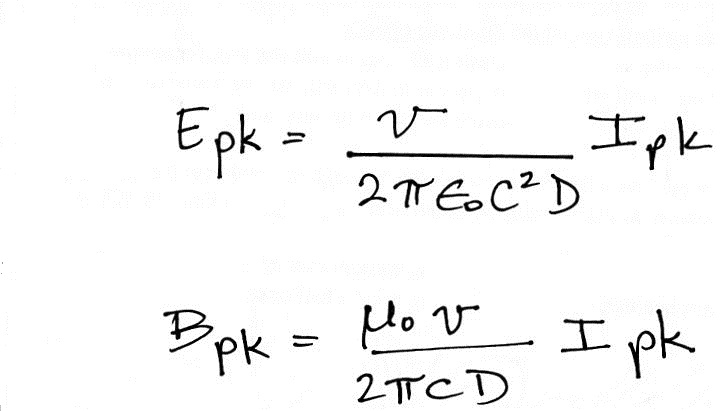
The transmission line model
relationship between peak current, Ipk,
and peak values of the electric and
magnetic radiation fields at a distance D
from the discharge are shown below:
The constant μo
is referred to as the permeability
of free space, the vacuum
permeability, and the magnetic
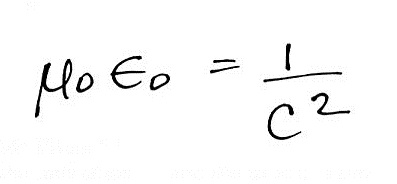
constant. μo and
εo (the permittivity of free
space) are related in the following way
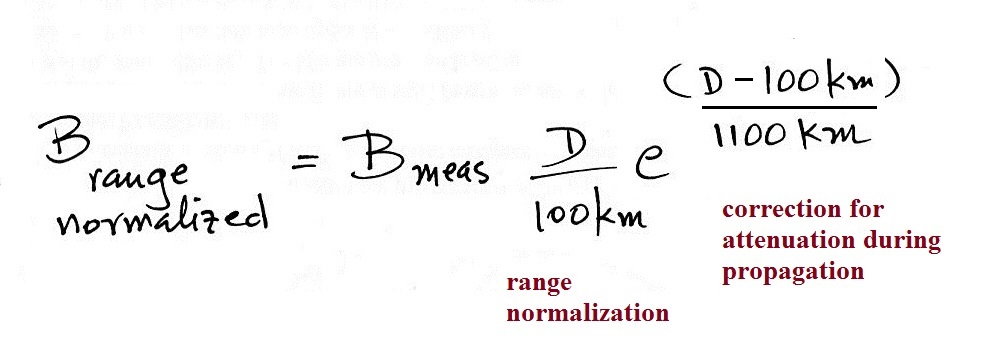
The measured B field values are first range
normalized to 100 km using an inverse distance
relationship. Then the amplitude is
corrected for attenuation during propagation.
A measured field amplitude of 1.5 x 10⁻⁸
W/m2 at a range of 200 km would be
multiplied by 2 to range normalize the
amplitude to 100 km. The value would
then be multiplied by a factor of 1.095 to
account for propagation attenuation. The
range normalized value of B is then used in
the transmission line model expression to
estimate the peak current amplitude.
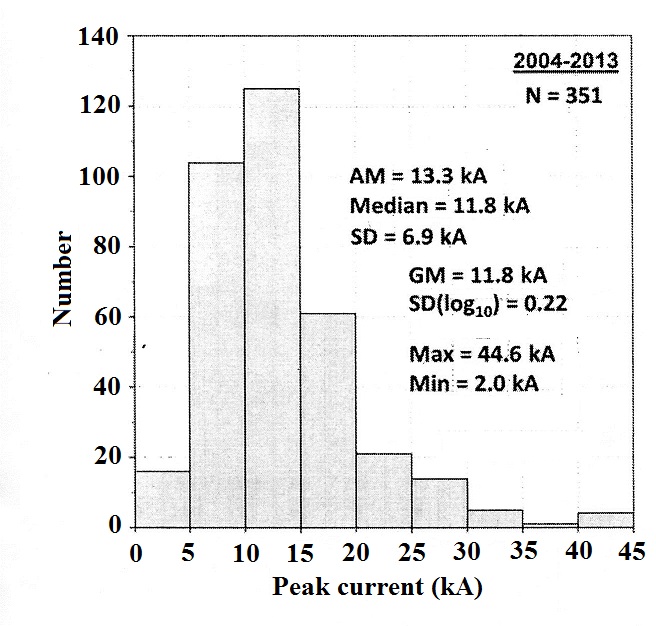
A total of 351 return strokes were triggered
at Camp Blanding during the 2004-2013 time
period. The distribution of peak current
values is shown below at left, the geometric
mean was 11.8 kA. The average current
was 14 kA, the largest and smallest currents
measured were 44.6 kA and 2.0 kA respectively
(strokes with currents less than about 5 kA
are not detected by the NLDN).
|
|
Distribution
of measured peak currents
in rocket-triggered lightning
|
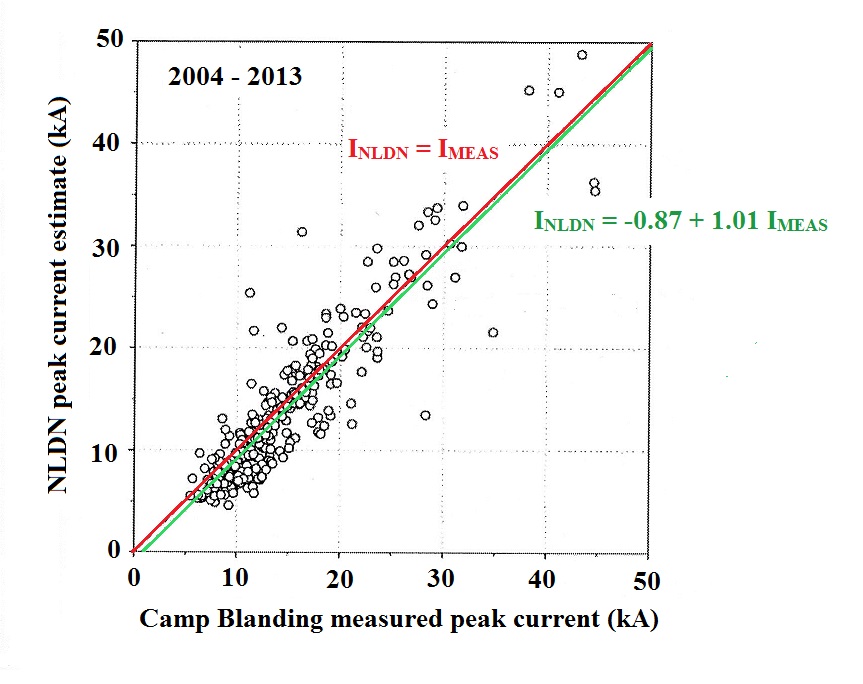
Comparison
between measured peak currents
and NLDN estimates of peak currents
|
The plot at right above compares NLDN
estimates of peak currents with peak currents
measured at the ICLRT facility.
List of
references cited in this section
Biagi,
C.J.,
K.L.
Cummins,
K.E.
Kehoe,
and
E.P. Krider, "National Lightning Detection
Network (NLDN) performance in southern
Arizona, Texas, and Oklahoma in 2003-2004,"
J. Geophys. Res., 112, D05208,
doi:10.1029/2006JD007341, 2007.
C.O.
Hayenga and J. W. Warwick, "Two-Dimensional
Interferometric Positions of VHF Lightning
Sources", J. Geophys. Res., 86, 7451-7462,
1981
Cummins,
K.L.,
J.A.
Cramer, C.J. Biagi, E.P. Krider, J. Jerauld,
M.A. Uman, V.A. Rakov, "The U.S. National
Lightning Detection Network: Post-Upgrade
Status, in the 2nd Conference
on
Meteorological
Applications of Lightning Data, AMS
Annual Meeting, Atlanta GA, 2006.
Cummins,
K.L. and M.J. Murphy, "An Overview of
Lightning Locating Systems: History,
Techniques, and Data Uses, With an In-Depth
Look at the U.S. NLDN," IEEE Trans. EMC, 51,
499-518, 2009.
Cummins,
K.L., "Lightning Locating Systems: History,
Methods, and their Roles in Meteorological
Applications," presented at the Eighth Conf.
on the Meterol. Application of Lightning
Data, Amer. Meterol. Soc., Seattle, Jan.
2017.
Jerauld,
J.,
V.A.
Rakov, M.A. Uman, K.J. Rambo, D.M. Jordan,
K.L. Cummins and J.A. Cramer, "An evaluation
of the performance characteristics of the
U.S. National Lightning Detection Network in
Florida using rocket-triggered lightning,"
J. Geophys. Res., 110, D19106,
doe:10.1029/2005jD005924, 2005.
Krider,
E.P., R.C. Noggle, A.E. Pifer, and D.L.
Vance, "Lightning Direction-Finding Systems
for Forest Fire Detection," , Bull. Am.
Meteorol. Soc., 61, 980-986, 1980
Mallick,
S., V.A. Rakov, J.D. Hill, T. Ngin, W.R.
Gamerota, D.M. Jordan, R.C. Olsen III, M.A.
Uman, "The NLDN Performance Characteristics:
An Update," 22nd Intl Lightning Detection
Conf., Broomfield, CO, April, 2012.
Mallick,
S., V.A. Rakov, T. Ngin, W.R. Gamerota, J.T.
Pilkey, J.D. Hill, M.A. Uman, D.M. Jordan,
"An Update on the Performance
Characteristics of the NLDN," 23rd Intl
Lightning Detection Conf., Tucson, AZ, 2014.
Nag,
A. S. Mallick, V.A. Rakov, J.S. Howard, C.J.
Biagi, J.D. Hill, NM.A. Uman, D.M. Jordan,
K.J. Rambo, J.E. Jerauld, B.A. DeCarlo, K.L.
Cummins and J.A. Cramer, "Evaluation of U.S.
National Lightning Detection Network
performance characteristics using
rocket-triggered lightning data acquired in
2004-2009", J. Geophys. Res., 116, 2011,
doi:10.1029/2010JD014929.
Nag,
A., M.J. Murphy, W. Schulz and K. Cummins,
"Lightning locating systems: Insights on
characteristics and validation techniques,"
Earth and Space Science, 2,65-93, 2015.
doi:10:1002/2014EA000051.
J.C.
Willett, J.C. Bailey, and E.P. Krider, "A
Class of Unusual Lightning Electric Field
Waveforms with Very Strong High-Frequency
Radiation," J. Geophys. Res., 94,
16255-16267, 1989).

