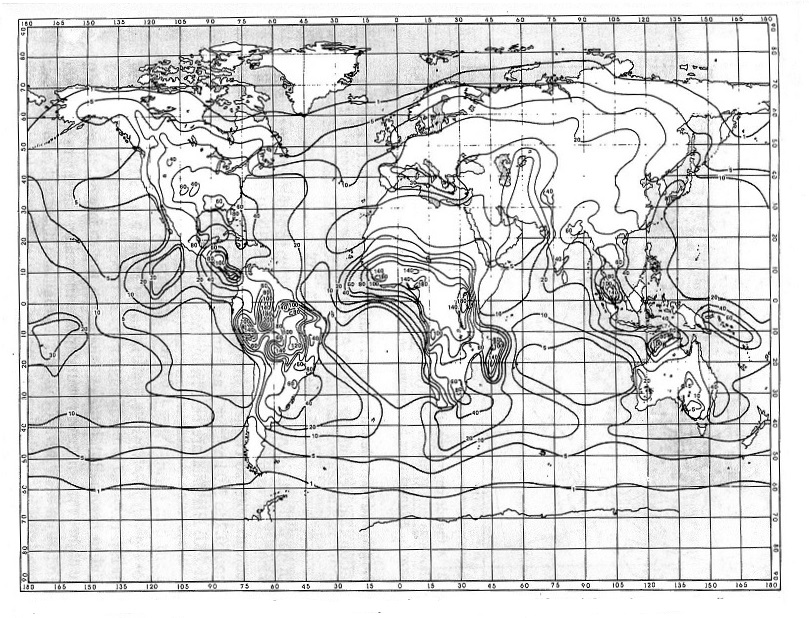
adapted from: World Distribution of Thunderstorm Days, Part 2, World Meteorological Organization Publ. 21, Geneva, 1956 (reprinted 1969).
Attempts were then made to use thunderstorm
day data to estimate the ground flash density (flashes/
(km2 year)). The relations were
generally of the form:
Ng = a (Td)b
The constants a and b were determined
in localized areas where some other means of determining
lightning flash density was available (often networks of
lightning counters). In a study in South Africa, for
example, the relation
Ng = 0.023 (Td)1.3
provided the best fit between
independent measurements of Td and Ng
(Td ranged from 3 to about 100 and
Ng from about 0.1 to 12
flashes/ (km2 year) ) .