Thursday Jan. 26, 2017

The first homework assignment of the semester is due next Tuesday.

Several new figures were added to today's notes after class.


E field inside a conductor


Free electrons inside a conductor will quickly move around and redistribute themselves in such a way that they will cancel out the field in the conductor (as the electrons move they leave behind positively charged atoms or molecules).  Very quickly the field inside the conductor will become zero.  There is also no space charge inside a conductor, all the charge is distributed along the surface.  The electric field lines in the vicinity of the conductor will be distorted and will strike the surface of the conductor perpendicularly (if there were any tangential component, charges would move and cancel it out).


Note also that the picture above doesn't change if some of the interior of the conductor is hollowed out (and as long as there isn't any charge inside the cavity).  This is the basic idea of a Faraday cage.  A metal enclosure will shield whatever is inside (people, sensitive electronics) from external electric fields.  It was invented in 1836 by Michael Faraday.

E field and surface charge density at the surface of a conductor
Next we'll use Gauss' Law to determine a relationship between the surface charge density and the electric field strength at the surface of a conductor.

A cylindrical volume, half inside and half outside the conductor is used.  You must integrate the electric field, E, over the surface of the cylinder. 

1.  The E field is zero inside the conductor.  So you get no contribution to the surface integral from the bottom half of the cylinder.


2.   Both the sides of the cylinder and the E field lines are perpendicular to the surface of the conductor.  The dot product of E and the normal to the sides of the cylinder is zero (E and n are perpendicular)  So there is no contribution to the surface integral from the sides of the cylinder.

3.   The only contribution comes from the top end of the cylinder.  E and the normal vector are parallel.  So the contribution from the top end is just E A, where A is the area of the top end of the cylinder.   The charge enclosed is just A σ, where σ is the charge density on the conductor surface.  The electric field at the surface of the conductor is perpendicular to the conductor and has the value highlighted in yellow.


We plugged a value for the fair weather electric field into this expression on the first day of class to determine the charge density on the surface of the earth.


Now some applications of what we have been learning.  In this and the next class we'll looking at some of the instruments used to measure thunderstorm and lightning electric fields. 

Electric field mill
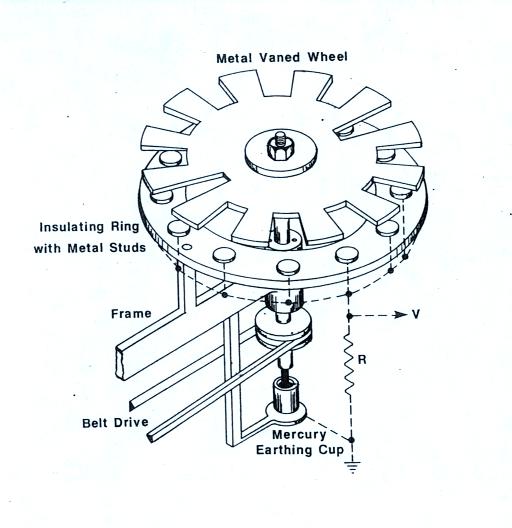
The first is an electric field mill used to measure static and slowly time varying electric fields.  Referring to the figure below at left (from Uman's 1987 The Lightning Discharge book).  The sensors (referred to as studs in the figure) are covered by a rotating grounded plate.  The rotating plate is notched or slotted so that the sensors are periodically exposed to and covered (shielded) from the ambient electric field.  A photograph of the field mill shown in class is shown below at right (signal and power cables are connected at the bottom of the mill).


This figure appeared in Martin A. Uman's book "The Lightning Discharge," Academic Press, Orlando, 1987.  One of the appendices in the book discusses instruments used in lightning research.


The two photographs below are closeups of the top of the field mill


The stator plates are exposed to the E field at left and covered in the photograph at right.  The four stators (sensor plates) exposed in the figure at left are connected together electrically.  Another four stators, also connected together are exposed in the figure at right.  Thus this field mill has two sets of sensors.  One of the sets is always exposed to the E field, which makes it possible to double the E field sampling rate.

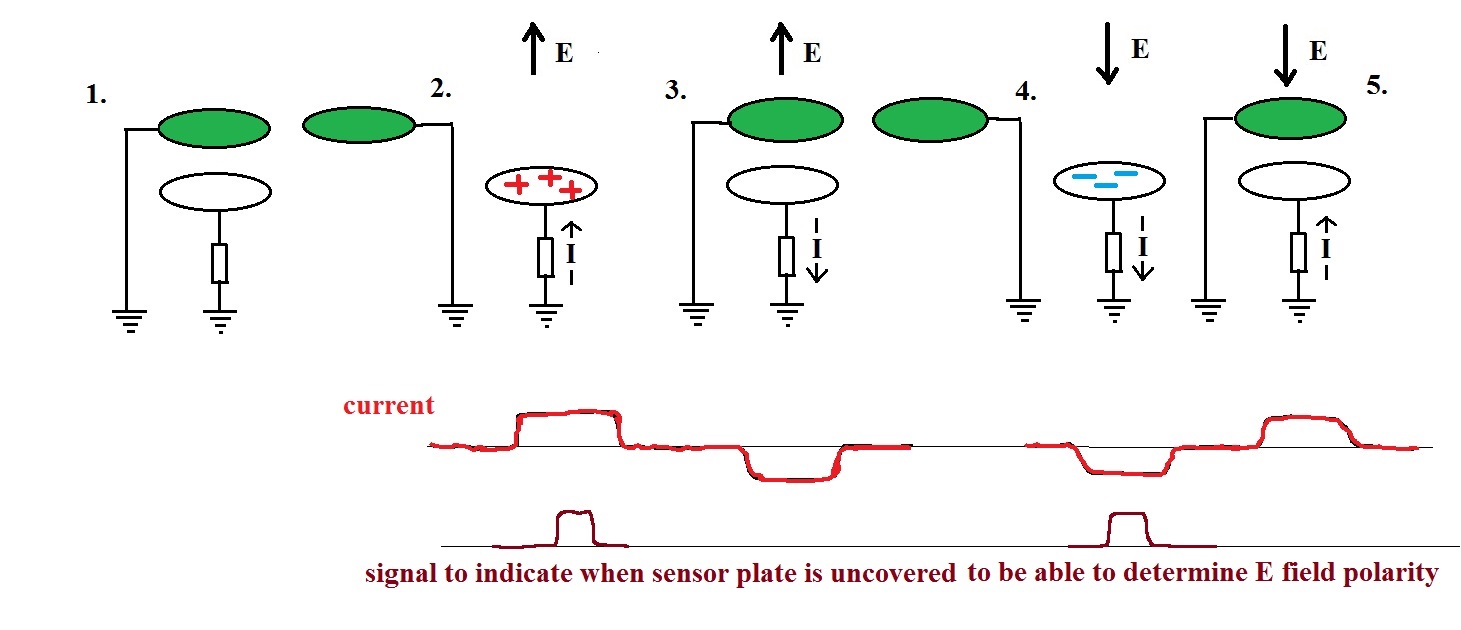
The next figure shows currents flowing into and out of the sensor plate in response to an incident E field.


The sensor plate is covered at Point 1.  At Point 2 the sensor is uncovered and we assume the ambient field points upward (toward negative charge in the lower part of a thunderstorm perhaps).  Positive charge flows up to the sensor plate.  The positive charge that built up flows from the sensor in Point 3 because the sensor has been covered again and shielded from the E field.  Points 4 and 5 are similar except the polarity of the E field has been changed. 

Note the current signals at Points 2 & 5 are the same even though the field polarities are reversed.  You must keep track of when the sensor is covered and uncovered in order to determine the polarity of the incident E field.

It is a relatively simple matter to relate the amplitude of the signal current to the intensity of the incident E field.


We use the expression derived a few days ago relating the E field at the surface of a conductor and the surface charge density (sigma in the equations above).  A is the area of the sensor being exposed to the E field.

If you integrate the current (connect the sensor through a capacitor to ground) you obtain an output voltage that is proportional to E.


The next several figures were added after class.  A flat metal plate was positioned about (on insulators) about 4 cm above the field mill.   Voltages of -40 volts, 0 volts, and +40 volts were applied to the plate.  This provides a very rough calibration of the field mill.  Mostly I wanted to be sure we understood what the polarity of the field mill output signal represented.


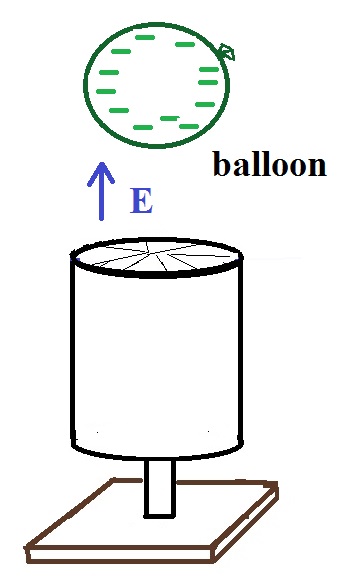
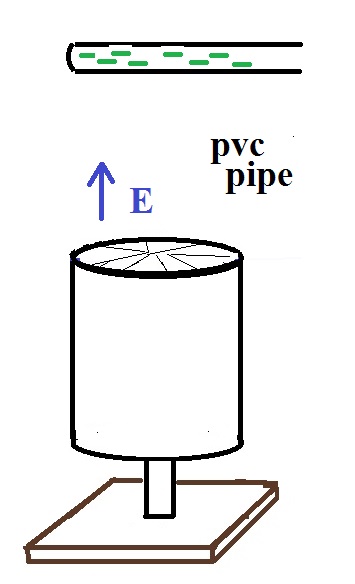
We were able, in a previous class, to electrify a couple of objects using triboelectric charging.  A rubber balloon becomes negatively charged when rubbed with wool.  A piece of PVC pipe rubbed with rabbit's fur is charged negatively.  Rubbing a glass graduated cylinder with the same piece of fur charged the glass positively.  These produced very large field mill signals (it was easy to saturate the field mill with the rubber balloon which I believe requires a field value of about 15 kV/m).


The field mill output voltage saturated at -13.5 volts
A large negative polarity output signal from the field mill
A large positive output voltage was noted.

The charge on these objects produces fields of 1000s of volts/meter.

One last demonstration to give you some appreciation for why it is necessary to continually expose and over the metal sensor plates in a field mill in order to measure a static E field.  A flat metal plate was placed on insulators a couple of centimeters above a table.  The plate was connected to an oscilloscope.  The negatively charged balloon was moved in and held above the metal place.  A small negative going deflection was seen on the oscilloscope but the signal quickly decayed back to zero. 

The arrival of the balloon causes positive charge to be induced in the plate.  A current running through the input resistance and capacitance of the oscilloscope input supplies this charge.  The current is integrated by the oscilloscope capacitance (and any other stray capacitance between the plate and ground).  This causes the negative deflection on the oscilloscope display.  The resistance in parallel with the capacitor is what causes the signal to decay back to zero.  The capacitance in the circuit is probably a few 10s of picofarads (pF), the oscilloscope input impedance (resistance) is 1 MΩ.  The decay time constant is therefore 10s of microseconds.

If a metal plate were carried outside and exposed to the E field we'd see a signal as charge flowed to or from the plate.  The signal would quickly decay back to zero.


When the balloon is moved away, the charge on the plate flows back to ground and produces a short-lived positive deflection on the oscilloscope.


Another electric field mill was also shown (but not operated) in class.  This particular instrument is designed and built by a local company Mission Instruments Corporation.


Inverted field mill
close up of the field mill sensor plate

The field mill is shown bolted to a railing on the roof of the PAS building here on campus.  One reason for inverting the field mill is so that charged precipitation won't fall on the sensor plate and introduce a spurious noise signal.  The E field will be distorted by the metal mast and the field mill would need to be calibrated against a second mill placed nearby but mounted flush with the ground surface.  In the situation above the building and railing would also distort the E field.  We'll look at E field enhancement next week.


Next we looked at an example of an E field record obtained with an electric field mill.  The data come from the Kennedy Space Center field mill network.

The first record is interesting because it shows the transition from fair to foul or stormy weather electric fields (a change in polarity and in field strength).


At the very beginning of the fields were about -200 V/m (positive polarity potential gradient is shown on the plot above).  The field crosses zero at about 20:39:00 GMT and increases in amplitude, eventually reaching about +2500 V/m.  The abrupt transitions are caused by lightning.  In our next lecture we will expand the time scale and look at the field variations that occur within an individual discharge.  Later in the course we'll come back to records like this and show what we start to learn something about the locations of charge and amounts of charge involved in lightning discharges by analyzing the electric field changes at multiple locations.

E field polarity confusion

The fact that potential gradient is shown on the vertical axis in the figure above rather than electric field brings up a confusing situation regarding electric field polarities that you should be aware of; it is something that might cause some confusion if you ever read through the atmospheric electricity literature.


The figure above at left correctly show the E field pointing downward toward negative charge on the earth's surface during fair weather.  The E field reverses direction under a thunderstorm.  The main negative charge center in the cloud causes positive charge to build up in the ground under the storm.  The E field points upward.

A physicist would consider the fair weather field to be negative polarity because it points downward and would call the stormy weather field positive.  The atmospheric electricity community will often refer to the fair weather field as positive and would call the foul weather field negative.  This can be a source of confusion. 

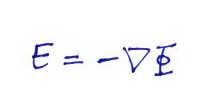
We'll learn more about potential next week.  The electric field and the potential gradient are related in the following way:


Researchers in atmospheric electricity will sometimes refer to the positive amplitude signal they are used to seeing during fair weather as a positive potential gradient rather than a positive electric field.  That is consistent with the physics sign convention.  A positive 200 V/m potential gradient is equal to a -200 V/m electric field and everyone is happy.


Measuring E fields inside a thunderstorm

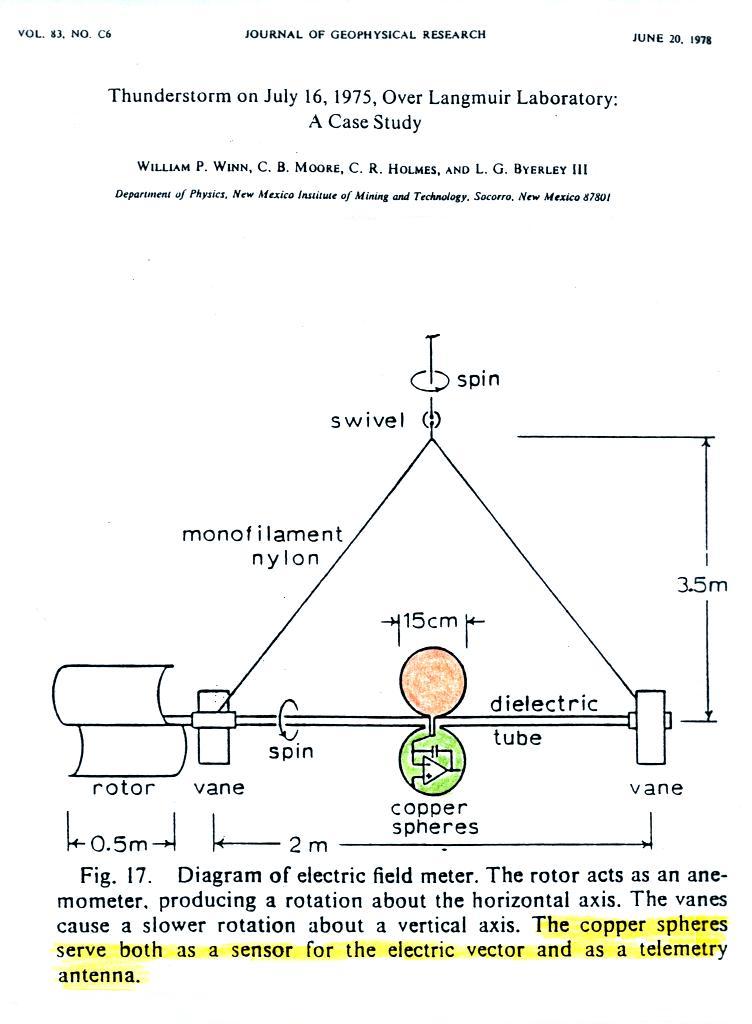
Here's an example of a very cleverly designed instrument that has been used to measure electric fields above the ground and inside thunderstorms (you can download the complete Winn et al. 1978 publication here). 


Two metal spheres are attached to and spin vertically around a horizontal shaft (the shaft also spins azimuthally).  The instrument is launched under a thunderstorm and is carried upward by balloon. 

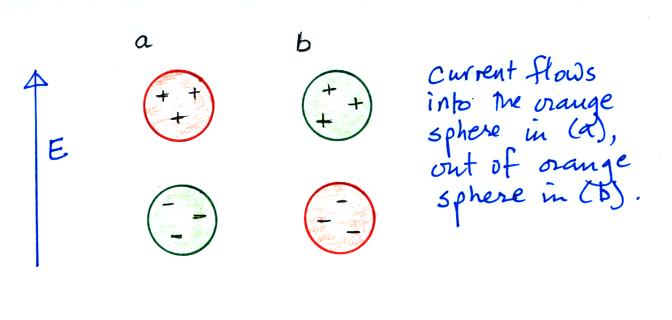
As the spheres spin, a current will move back and forth between them.  The amplitude of the current will depend on the charge induced on the spheres by the electric field.  The induced charge will, in turn, depend on the intensity of the E field.   The two spheres also act as an antenna for transmitting data back to a receiver on the ground.

Determining how the two conducting spheres will enhance the electric field is a complex problem that has been worked out analytically (don't worry we won't be looking at the details).  You could also work it out numerically or determine the enhancement experimentally. 


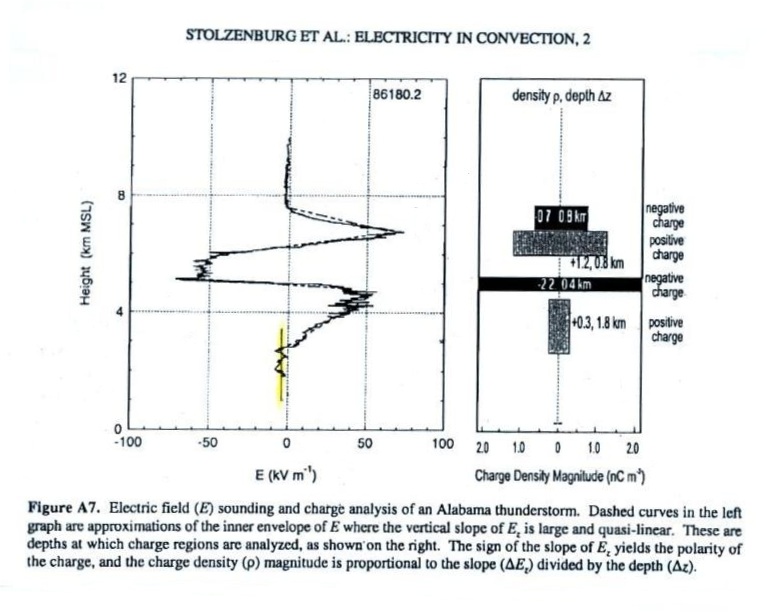
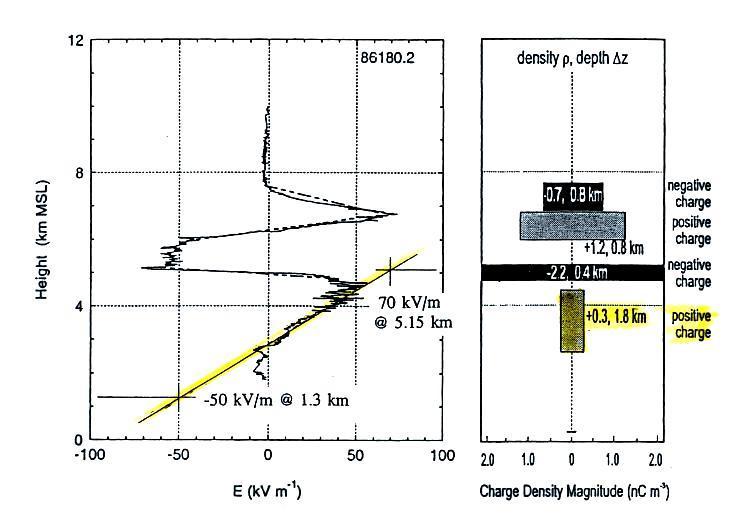
The next figure shows an example of data obtained with an instrument like this (it is from a different publication which you can download here, but a similar instrument was used).


We're going to take a more careful look at 2 parts of the E field plot.  First the small highlighted portion at the bottom of the plot.  Here the sensor was below the lowest charge layer in the cloud (perhaps even below the base of the cloud) and the E field seems to be fairly constant varying between about -2 and -4 kV/m.  At first glance that seemed surprising; I would have expected to see the field increasing as the balloon and its sensor got nearer the charge.

Can we use the charge density information at right in the figure to explain this field?

There are 4 layers of charge.  The field at Pt. X below the lowest layer will be a superposition of the fields from each of the layers above.   We'll assume each of the layers is of infinite horizontal extent (sort of a 2-D version of the infinite uniform line of charge).  We can use the integral form of Gauss' Law to determine the field above and below a layer of charge.


I think you can argue "by inspection" that the field above and below the infinite layer of charge will have just a z-component.  Also because the layer is of infinite extent the field strength will be the same at any distance above or below the layer.

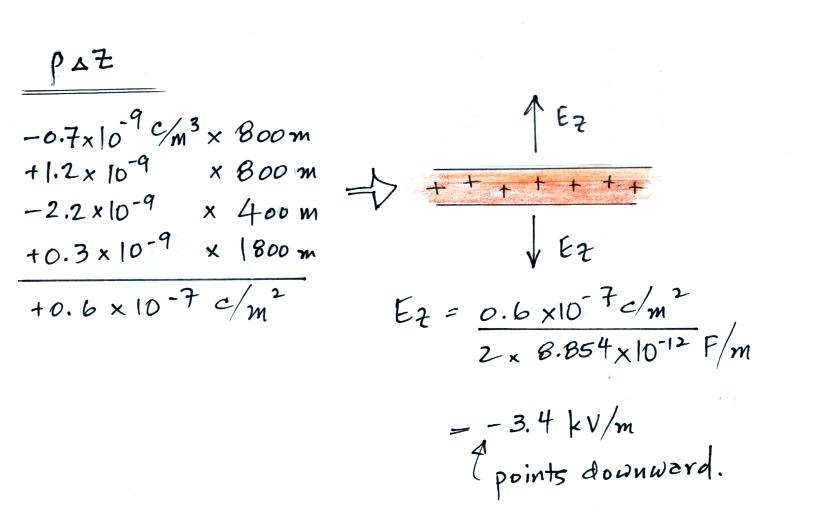
So we compute ρ Δz for each of the layers, add the results together and use that to compute the field using the equation above.

Below the cloud we find that the field is negative (points downward) and has an amplitude of 3.4 kV/m.  This agrees very well with what is shown in the E field sounding.  You would also expect to see an upward pointing field of the same strength above the top layer.

Next we'll examine the increasing E field as the sensor passes through the lowest 1800 m thick layer of charge.


The E field change appears linear and we can measure the slope of the field change and the differential form of Gauss' Law to determine the volume space charge density.


Note that dE/dz is positive on the E field sounding between about 2.7 km and 4.5 km or so.  This coincides with a 1.8 km thick layer of positive space charge.  The slope turns negative between about 4.7 km and 5.1 km where there is a layer of negative charge.  The E field reaches a peak positive value at about 4.6 km, a point that is in between the layers of positive and negative charge.

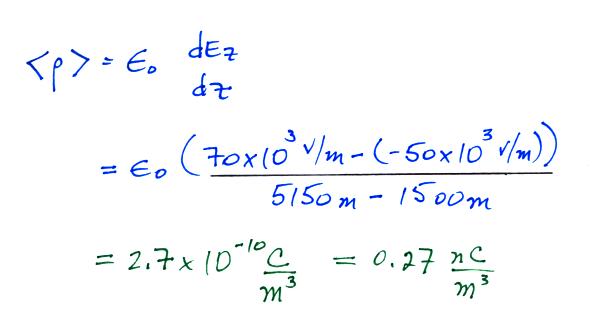
We can determine the slope of the line highlighted in yellow and use that to determine the average volume space charge density in the layer of positive charge.


The value we obtain (0.27 nC/m3) is in good agreement with the 0.3 nC/m3 value given in the paper.


References:

Build a homemade field mill http://www.precisionstrobe.com/jc/fieldmill/fieldmill.html

W.P. Winn, C.B. Moore, C.R. Holmes, L.G. Byerly III, "Thunderstorm on July 16, 1975, Over Langmuir Laboratory: A Case Study," J. Geophys. Res., 83, 3079-3092, 1975

M. Stolzenburg, W.D. Rust, T.C. Marshall, "Electrical Structure in Thunderstorm Convective Region 2, Isolated Storms," J. Geophys. Res., 103, 14079 - 14096, 1998.