Friday, Aug. 25
Distribution of the Experiment #1
materials began in class today. This weekend would be a perfect
time to start the experiment. Once you have
collected all of your data, return the materials and pick up the
supplementary information sheet.
Some additional reading in Chaper
12 was assigned. We'll begin covering air pollutants on Monday.
Here
is a brief review of what we covered last Wednesday and where we will
be headed today.
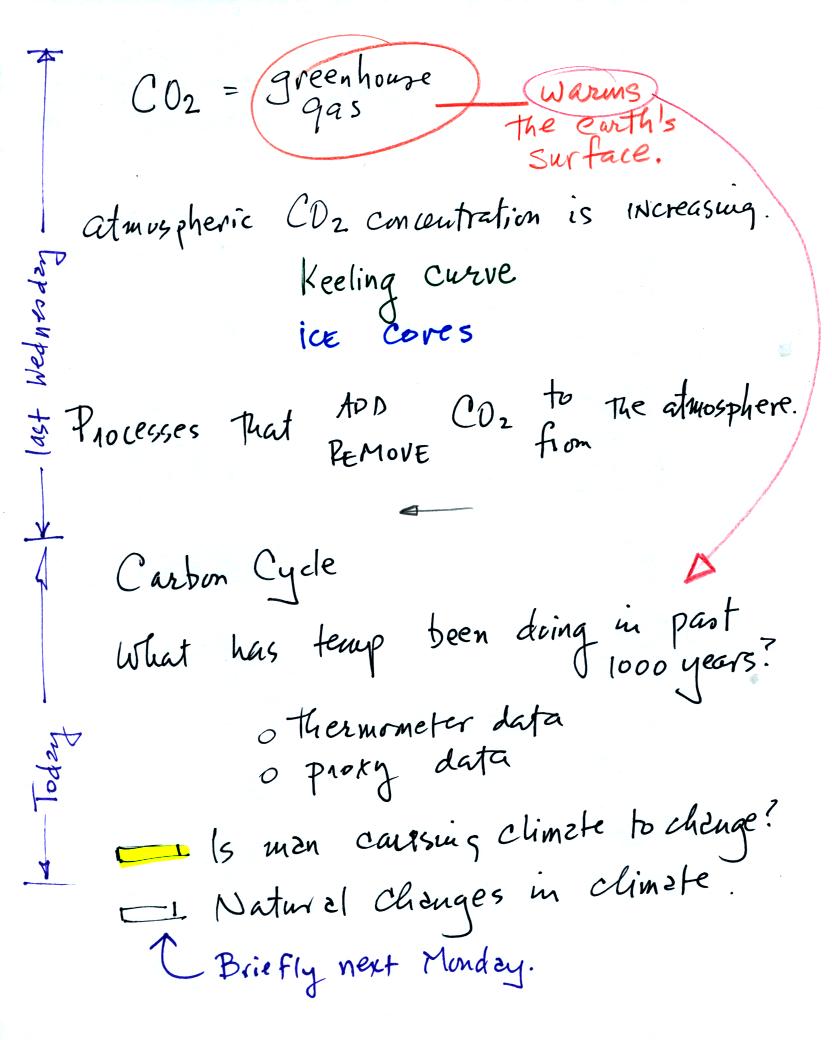
Atmospheric CO2 concentration is increasing (and has been
increasing
since the mid 1700s). A look at the carbon cycle shows us why
this is true.
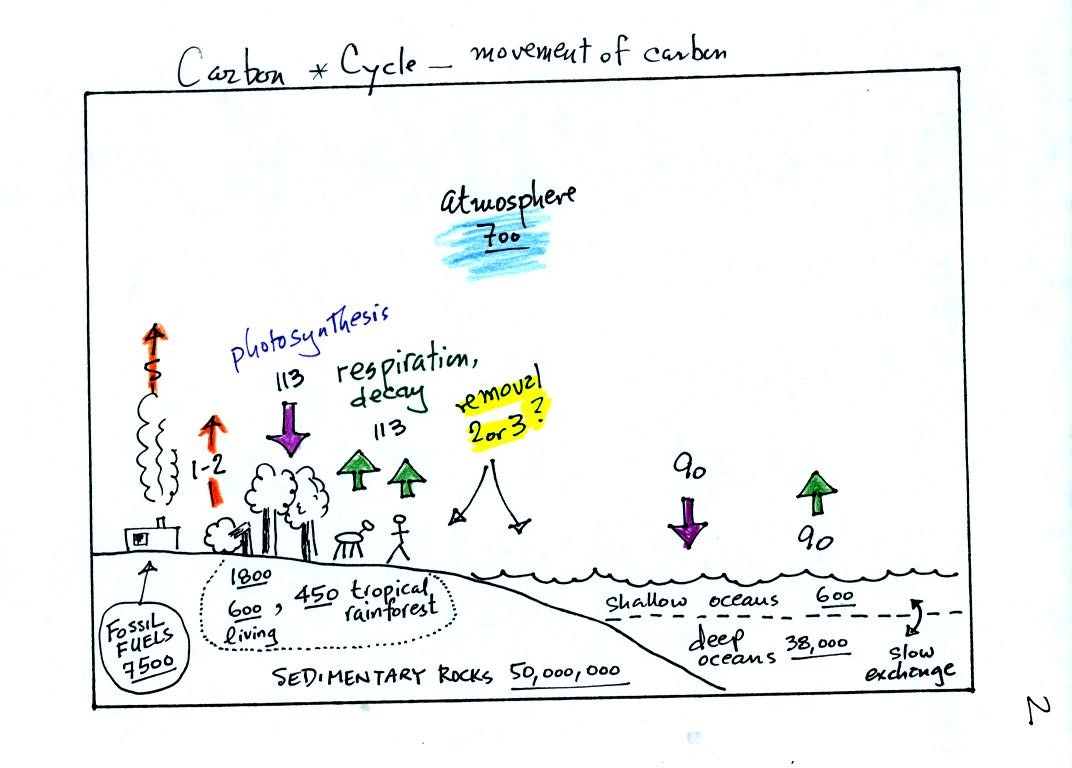
This somewhat confusing figure requires some
careful analysis.
1. Underlined numbers show
the amount of carbon stored in "reservoirs." For example 700
units* of carbon
are stored in the atmosphere (mostly in the form of CO2, but
also CH4,
CFCs
and other gases; note that carbon is found in each of those
molecules). The other numbers show
"fluxes," the amount of carbon moving into or out of a reservoir per
year. Respiration and decay add 113 units* of carbon to the
atmosphere every year. Photosynthesis (primarily) removes 113
units every year.
2. Note the natural processes
are in balance (over land: 113 units added and 113 units removed, over
the oceans: 90 units added balanced by 90 units of carbon removed from
the atmosphere every year). and won't change the
atmospheric concentration.
3. Anthropogenic (man caused) emissions
of
carbon into the air are small compared to natural processes. About
5 units are added during combustion of fossil fuels and 1-2
units are added every year because of deforestation (when trees are cut
down they decay and add CO2 to the air, also because they
are dead they
aren't able to remove CO2 from the air by photosynthesis)
The rates at which carbon is added to the atmosphere by man is not
balanced by an equal rate of removal (2 or 3 units are removed every
year, highlighted in yellow in the figure. The ? refers to the
fact that scientists still don't know precisely how or where this
removal occurs). This will slowly cause the
atmospheric CO2 concentration to increase.
4. In the next 100 years or so,
the 7500 units of carbon stored in the fossil fuels reservoir (lower
left
hand corner of the figure) will be added to the air. The big
question is how will the atmospheric
concentration change and what effects will that have?
*units: Gtons (reservoirs) or Gtons/year (fluxes)
Gtons = 1012 metric tons. (1 metric ton is 1000 kilograms or
about 2200
pounds)
So here's what we have learned so far:
CO2 concentration was fairly constant between 1000 AD and
the mid
1700s. CO2 concentration has been increasing since the
mid
1700s.
The concern is that this might cause global warming. So what has
the temperature of the earth been doing during this period?
The next two figures (found on p. 3 in the photocopied notes) address
this question.
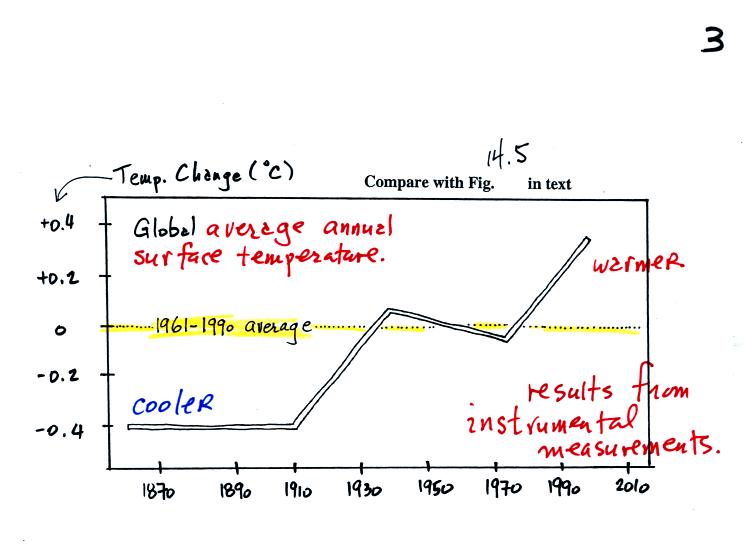
This first figure shows how the average global annual
surface
temperature has changed over the past 130 or 140 years. This is
based on actual measurements of temperature made at many locations on
land and sea around the globe.
Temperature appears to have increased 0.7o to 0.8o
C during this
period. The increase hasn't been steady as you might expect given
the steady rise in CO2 concentration; temperature remained
constant or
even decreased slightly between 1940 and 1975 or so.
It is very difficult to detect a temperature change this small over
this period of time. The instruments used to measure temperature
have changed. The locations at which temperature measurements
have been made have also changed (imagine what Tucson was like 130
years ago). Average surface temperatures naturally change a lot
from year to year. The year to year variation has been left out
of the figure above so that the overall change could be seen more
clearly (click here to see a different
version of this figure that does show the year to year variation and
the uncertainties in the yearly measurements).
Now it would be interesting to know how temperature was changing prior
to the mid-1800s. There aren't enough reliable measurements to be
able to do that directly. Scientists must use proxy data.
When you can measure something
like temperature directly you might be able to look for something else
or measure something else whose presence or concentration depended on
the temperature at some time in the past.
Here's an example.
Example: Imagine trying to measure how many students live in a
particular house
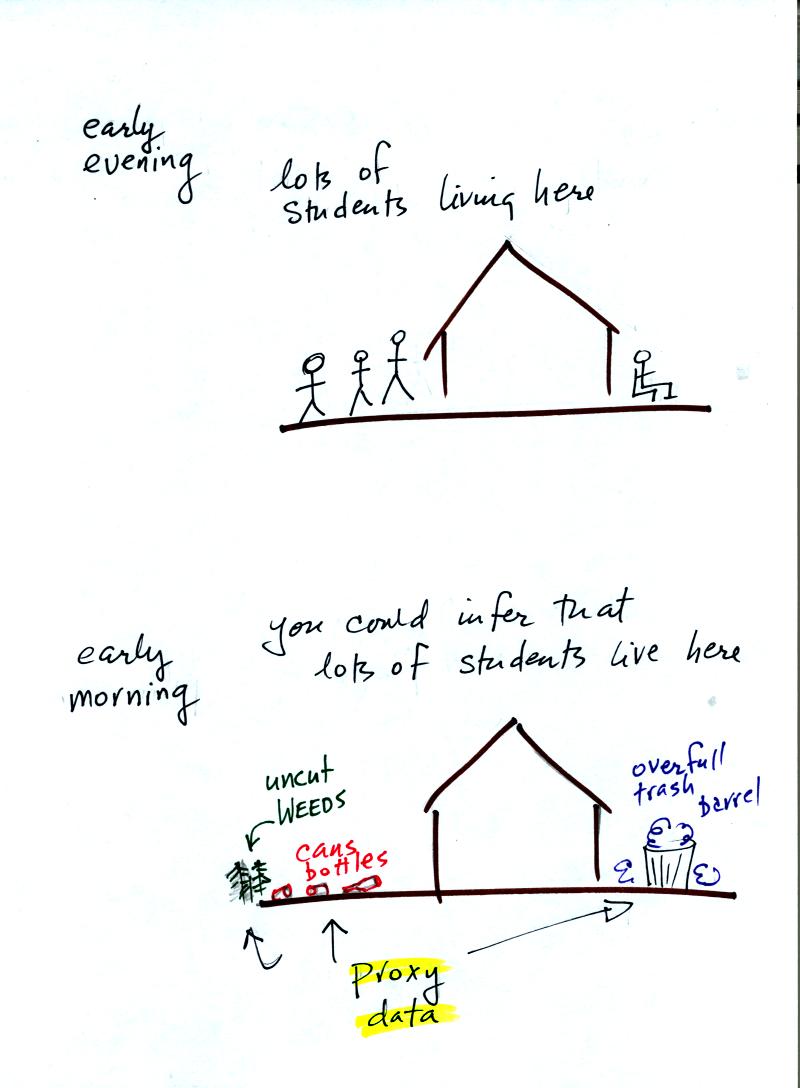
ILet's say you want
to determine how many students are living in
a house near the university. You could walk by the house late in
the afternoon and count the students if they were outside. That
would be a direct measurement. There could be some errors in your
measurement (some students might be inside the house).
If you were to walk by early in the morning it is likely that the
students would be inside sleeping. In this case though you might
look for other clues that might give you an idea of how many students
lived in that house. You would use these proxy data to come up
with an estimate of the number of students inside the house.
In the case of temperature scientists look at tree rings. The
width of each yearly ring depends on the depends on the temperature and
precipitation at that time that ring formed. They analyze
coral. Coral is made up of calcium carbonate, a molecule that
contains oxygen. The relative amounts of the different oxygen
isotopes depends
on the temperature that existed at the time the coral grew.
Scientists can analyze lake bed and ocean sediments. The types
of plant and animal fossils that they find depends on
the water temperature at the time. They can even use the ice
cores. The ice, H2O, contains oxygen and the relative
amounts of
various oxygen isotopes depends on the temperature at the time the ice
fell from the sky as snow.
Using these proxy data scientists have been able to estimate average
surface temperatures for 100,000s of years into the past. The
next figure shows what temperature has been doing since 1000 AD.

The blue
portion of the figure shows the estimates of temperature
derived from proxy data. The orange portion are the instrumental
measurements made between about 1860 and the present day. There
is also a lot of year
to year variation and uncertainty that is not shown on the figure above
(click here or see Figure 14.4 in the
text for a more accurate representation of this curve).
It appears that there has been a significant amount of warming that has
occurred in just the last 150 years or so. Many scientists
believe that this warming is a result of the increase in atmospheric
greenhouse gas concentrations. Others suggest that this change in
temperature might be just a natural change in climate and is not due to
anthropogenic release of greenhouse gases. Mother Nature has
produced much larger changes than we see here though usually on a much
longer time scale. We'll briefly look at
natural changes in climate that have occured in the near and distant
past in
class next Monday.
As
mentioned early distribution of the Expt. 1 materials started in
class today.
With this and the other experiments you will receive most or all of the
materials you need to complete the experiment, a description of what
should go into your report, instructions that tell you how to perform
the experiment, and a data collection sheet.
The object of Experiment #1 is to measure the percentage concentration
of the oxygen in air. Basically you moisten a piece of steel
wool, stick the steel wool into a graduated cylinder, and turn the
cylinder upside down and immerse the open end in a cup of water.
As the next figure shows you need to use a small piece of flexible
tubing so that water enters part way into the cylinder so that the
water level can be read on the cylinder scale.
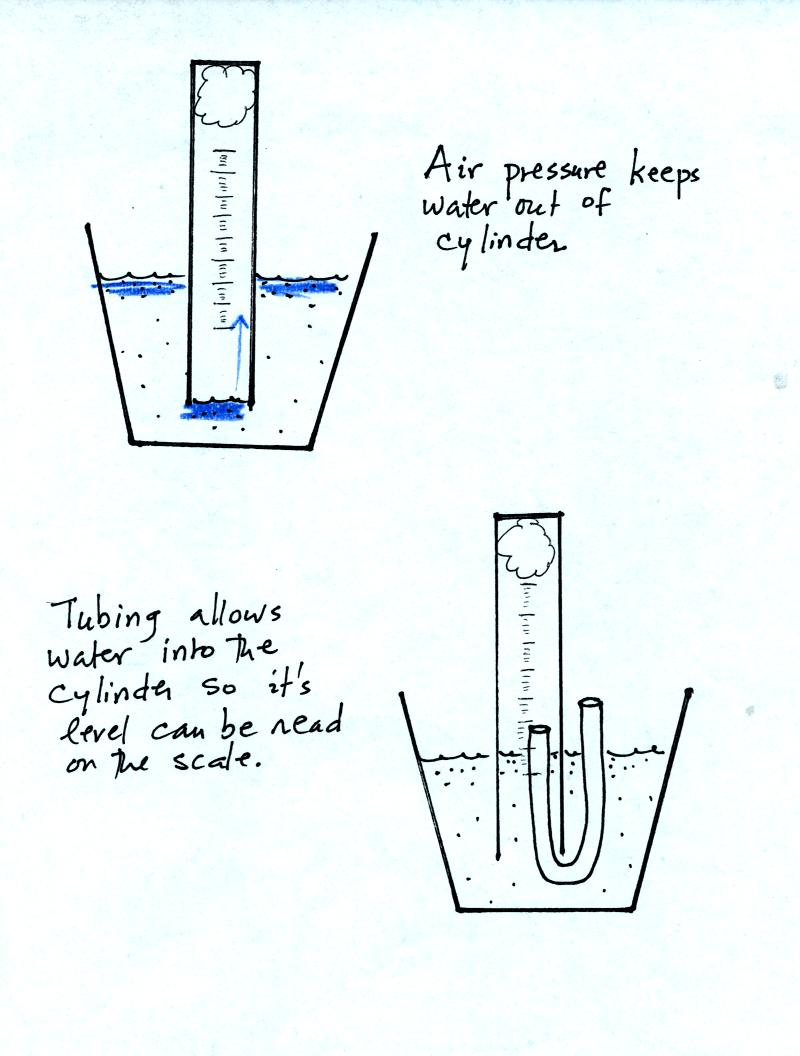
Be sure to remove the tubing once the water level can be read on the
cylinder scale. The air sample in the cylinder is now sealed off
from the rest of the atmosphere. The oxygen in the air sample
will react with the steel wool to form rust. As oxygen is removed
from the air sample, the air sample volume changes.

The reaction between the oxygen and the steel wool sometimes happens in
a day or two. Other times it may take several days. You
will periodically need to record the time and the air sample volume (
you read the water level on the cylinder scale). Be sure you do
not lift the open end of the cylinder out of the water. That
would break the seal and you would need to restart the experiment.
Eventually the air sample volume will stop changing; all of the oxygen
has been removed from the air sample and the experiment is over.
You will receive a supplementary information sheet when you have
returned your materials. You don't have to return the rusty piece
of steel wool - throw it away. Don't worry about trying to clean
the rust stains off the inside of the cylinder.