Tuesday Oct. 16, 2007
Quiz #2 was returned in class today. Check your paper carefully
for grading errors.
The worksheets that accompany 1S1P Assignment #2 are still available if
you didn't pick one up after the quiz last week. These worksheets
are optional. However if you do
turn in a completed worksheet you can earn some extra credit that will
be added to your 1S1P points total.
Two new Optional Assignments were handed out in class. Both will
be due at the beginning of class next Tuesday.
An in-class Optional Assignment was also handed out. The
assignment was collected at the end of class.
Optional
Assignment #4 deals with the factors that determine a region's yearly
average and yearly range of temperature. These factors are
discussed on pps 63-66 in Chapter 3 of the textbook (same pages in both
the 4th and 5th editions). Or you might prefer to read an online
summary of the Controls
of Temperature.
We have already learned that oceans moderate climate. A region
next to an ocean or an island surrounded by ocean will have a smaller
annual range of temperature than a location surrounded by land.
Latitude also affects the annual range of temperature. The
smallest seasonal variations are found at the equator because the days
are always 12 hours long and the sun is always high in the sky at noon.
We had a brief look at some climate data from Pohnpei Island in the
Federated States of Micronesia. You'll find some information
about Pohnpei and other nearby islands on pps 81 and 82 in the
photocopied Class Notes.
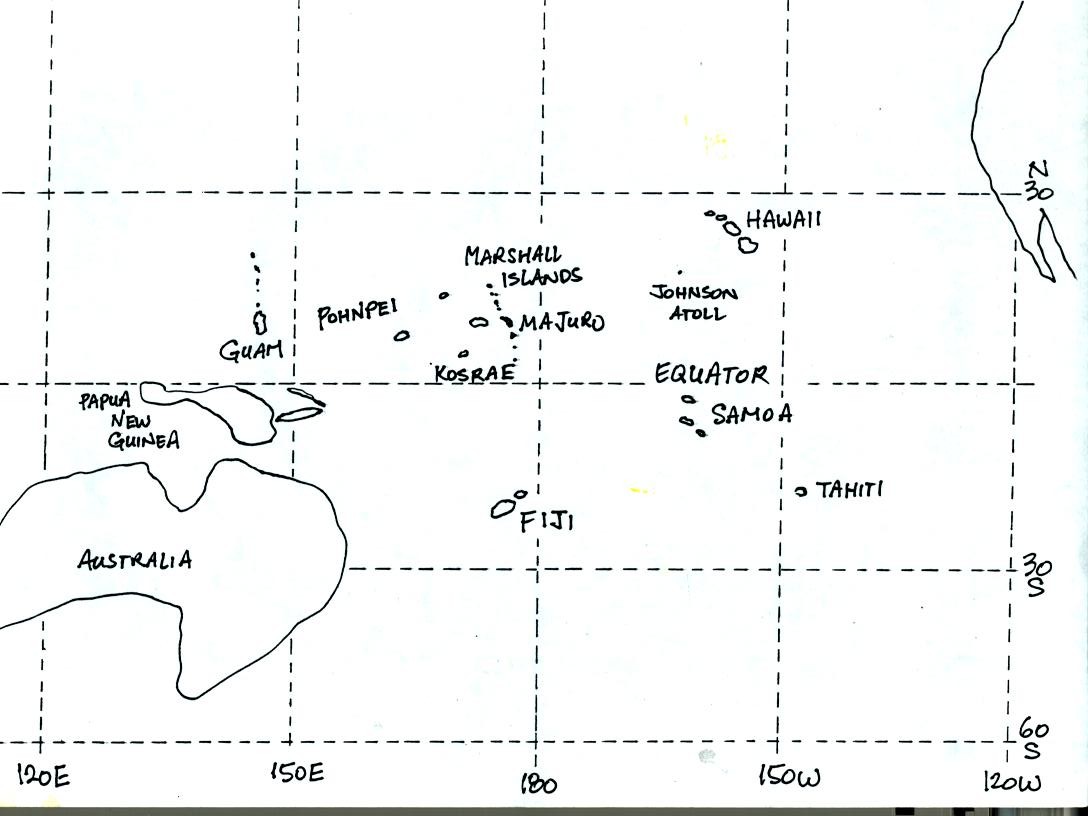
Pohnpei island is located to the east of Guam.
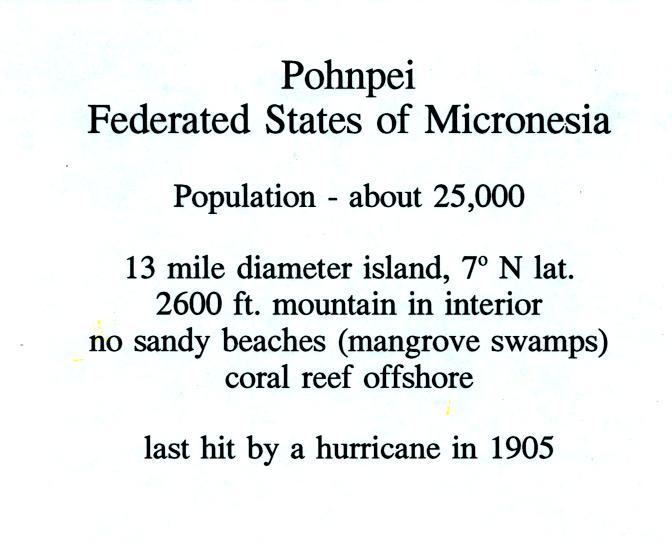
Pohnpei is a fairly large island and is a popular snorkeling
and scuba
diving destination. Pohnpei has a weather station that is
operated by the US National Atmospheric and Oceanic Administration.
Because of its low latitude and
the fact that it is surrounded by water you would expect a small annual
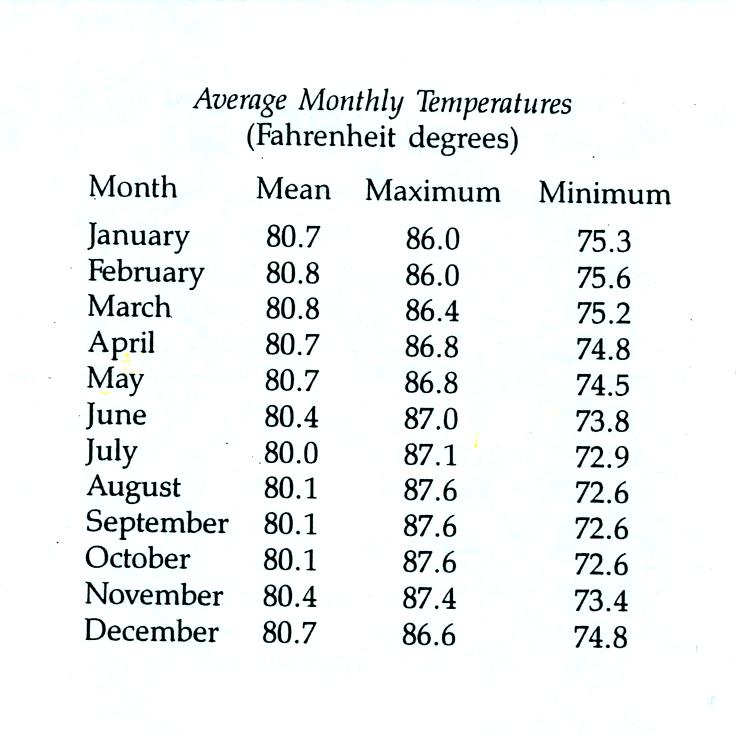
range of temperature at Pohnpei. You can see in the
table above just how small the annual range is: the average monthly
temperatures in Pohnpei range from 80.8 F in February and March to 80.0
F in July. The annual range is less than 1 F. By
comparison, the annual range in Tucson is about 34 F (52 F in December
and January to 86 F
in July).
The following precipitation data show that Pohnpei is one of the
rainiest locations on earth
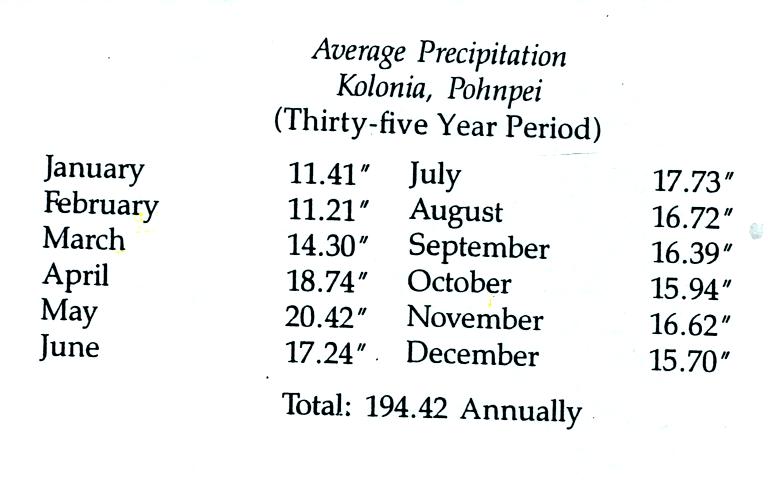
The rainiest location on earth is in Hawaii with about 460
inches of
rain per year.
The
following is an
introduction to an important new topic: humidity. The
beginning of
Chapter 4 can be a little overwhelming and confusing. If you find
it too confusing, I would suggest you stop reading. Instead,
study this introduction and the notes you take in class. We will
work a number of example humidity problems and you should fairly
quickly grasp the basic concepts.
We will be mainly interested in 4 variables, what they are
and what can cause their values to change. The variables are :
mixing ratio, saturation
mixing ratio, relative humidity, and dew point. You will find
most of what follows on pps 83-85 in the photocopied class notes.
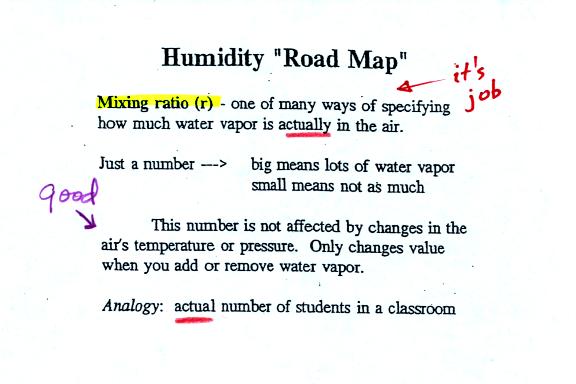
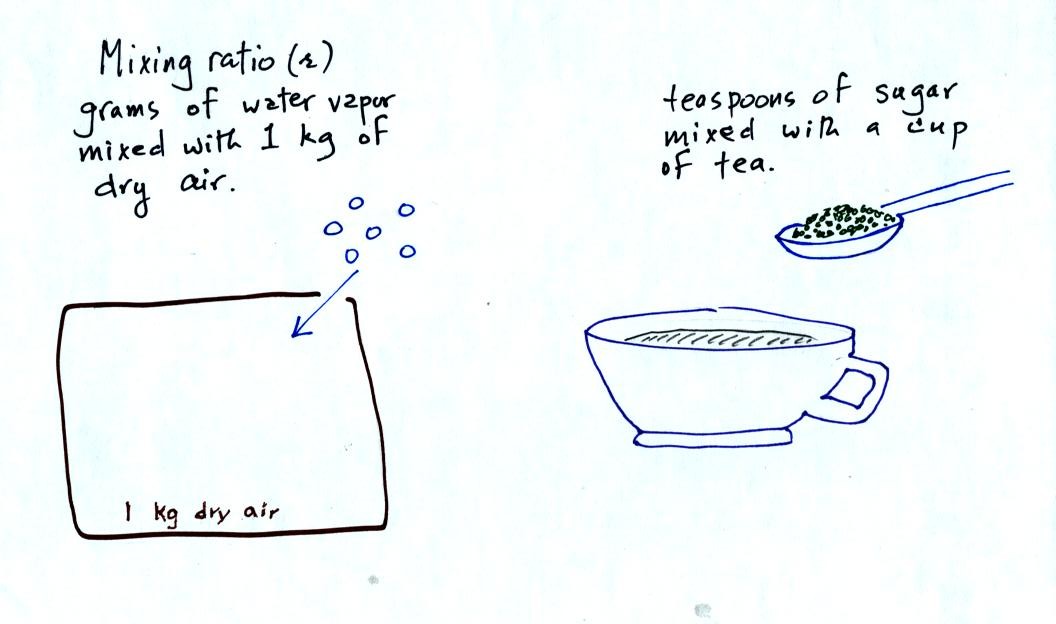
Mixing ratio tells you how much water vapor is actually in
the
air. Mixing ratio has units of grams of water vapor per kilogram
of dry air (the amount of water vapor in grams mixed with a
kilogram
of dry air). It is basically the same idea as teaspoons of sugar
mixed in a cup of tea.
The value of the mixing ratio won't change unless you add
water
vapor to or remove water vapor from the air. Warming the air
won't
change the mixing ratio. Cooling the air won't change the mixing
ratio
(unless the air is cooled below its dew point temperature and water
vapor starts to condense).
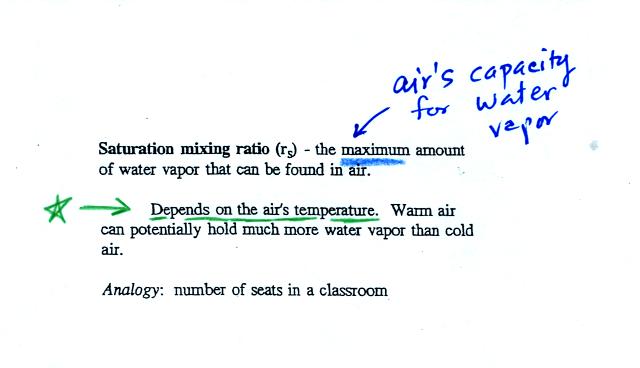
Saturation mixing ratio is just an upper limit to how much
water vapor
can be found in air, the air's capacity for water vapor. It's a
property of air, it doesn't say anything about how much water
vapor is actually in the air (that's the mixing ratio's job).
Warm air can potentially hold more water vapor than cold air.
This variable has the same units: grams of water vapor per kilogram of
dry air. Saturation mixing ratio values for different air
temperatures are listed and graphed on p. 86 in the photocopied class
notes.
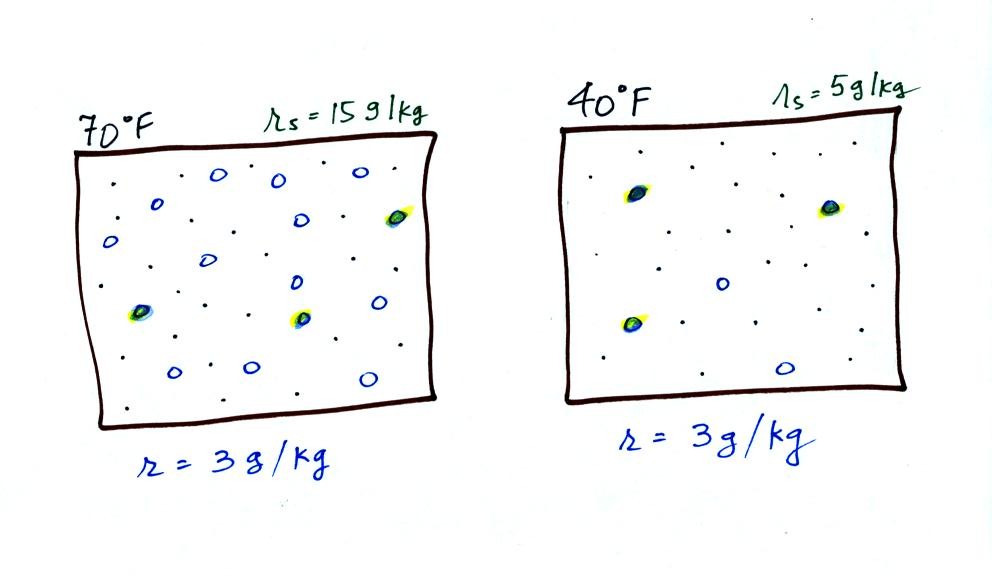
The dependence of saturation mixing ratio on air temperature is
illustrated below:
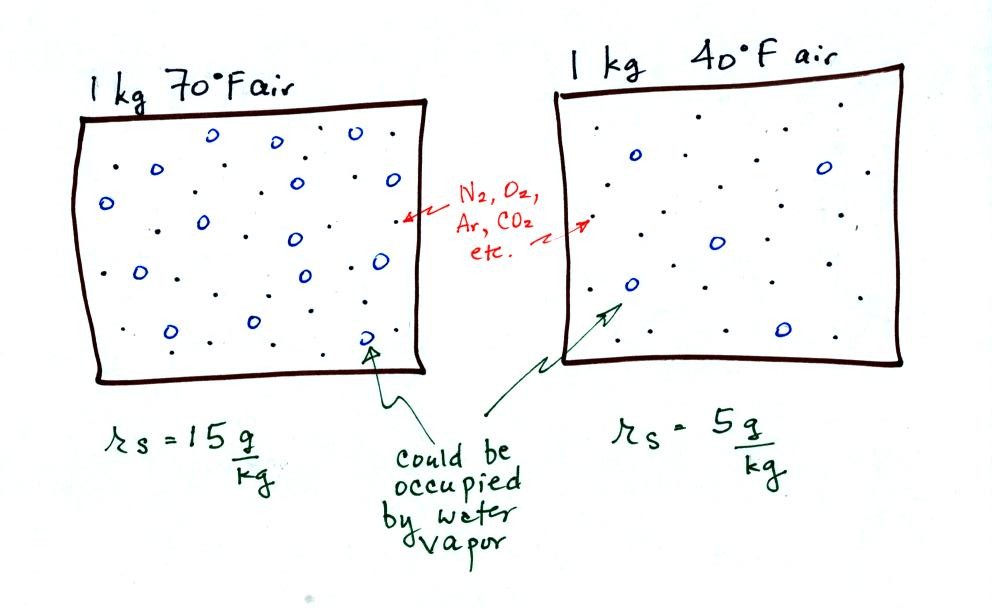
The small specks represent all of the gases in air except
for the water
vapor. Each of the open circles represents 1 gram of water vapor
that the air could hold. There are 15 open circles drawn in the 1
kg of 70 F air; each 1 kg of 70 F air could hold up to 15 grams of
water vapor. The 40 F air only has 5 open circles; this cooler
air can only hold up to 5 grams of water vapor per kilogram of dry air.
Now we have gone and actually put some water vapor
into the
volumes of
70 F and 40 F air. 3 grams of water vapor have been added to each
volume of air. The mixing ratio, r, is 3 g/kg in both cases.

The relative
humidity is the variable most people are familiar with, it tells you
how "full" the air is with water
vapor.
In the analogy (sketched on the right hand side of p. 83 in
the photocopied notes) 4 students wander into Classroom A which has 16
empty
seats. Classroom A is filled to 25% of its capacity.
You can think of 4, the number of students, as being analogous to the
mixing ratio. The classroom capacity is analogous
to the
saturation mixing ratio. The percentage occupancy is analogous to
the relative humidity.
Instead of students and a classroom you
could think of the 70 F and 40 F air that could potentially hold 15
grams or 5 grams, respectively of water vapor.
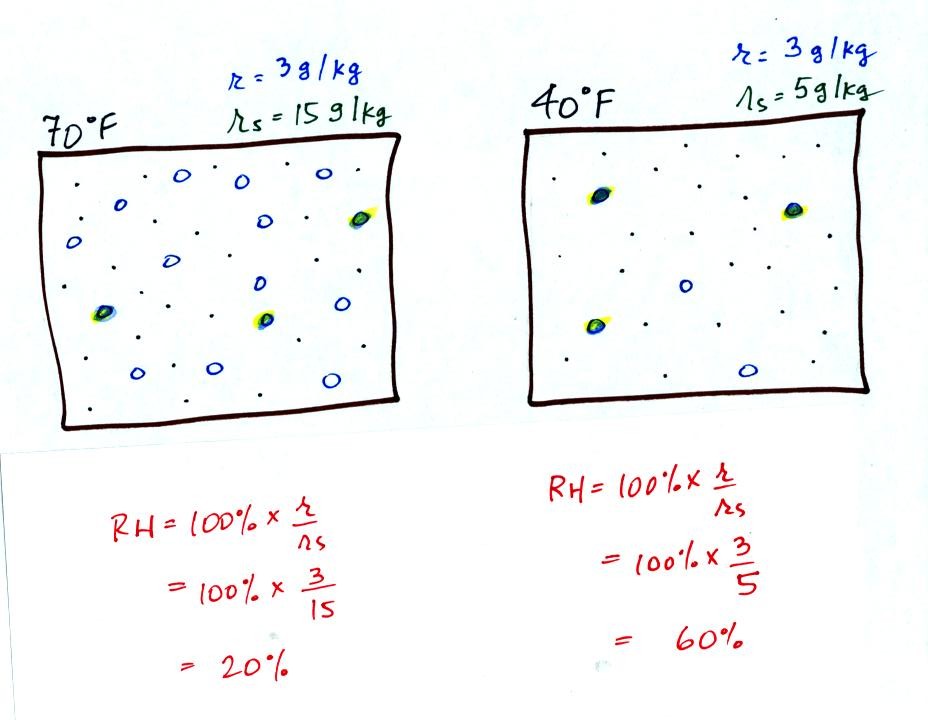
Here are the relative humidities of the 70 F and 40 F air
that each
contain 3 grams of water vapor. The 70 F air has a low RH because
this warm air's saturation mixing ratio is large. The RH in the
40 F is higher even though it has the same actual amount of water vapor
because the 40 F air can't hold as much water vapor and is closer to
being saturated.
Something important to note: RH doesn't really tell you how much water
vapor is
actually in the air. The two volumes of air above contain the
same amount of water vapor (3 grams per kilogram) but have different
relative humidities. You could just as easily have two volumes of
air with the same relative humidities but different actual amounts of
water vapor.
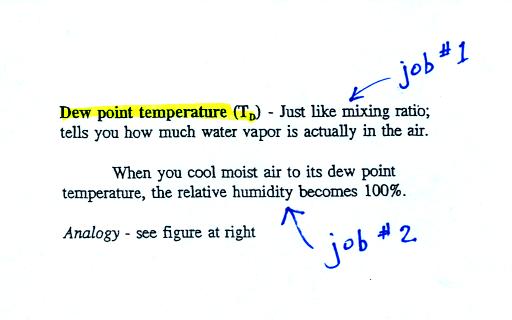
The dew point temperature has two jobs. First it is a
measure of
the actual amount of water vapor in the air. In this respect it
is just like the mixing ratio. If the dew point temperature is
low the air doesn't contain much water vapor. If it is high the
air contains more water vapor.
Second the dew point tells you how much you must cool the air in order
to cause the RH to increase to 100% (at which point a cloud, or dew or
frost, or fog would form).
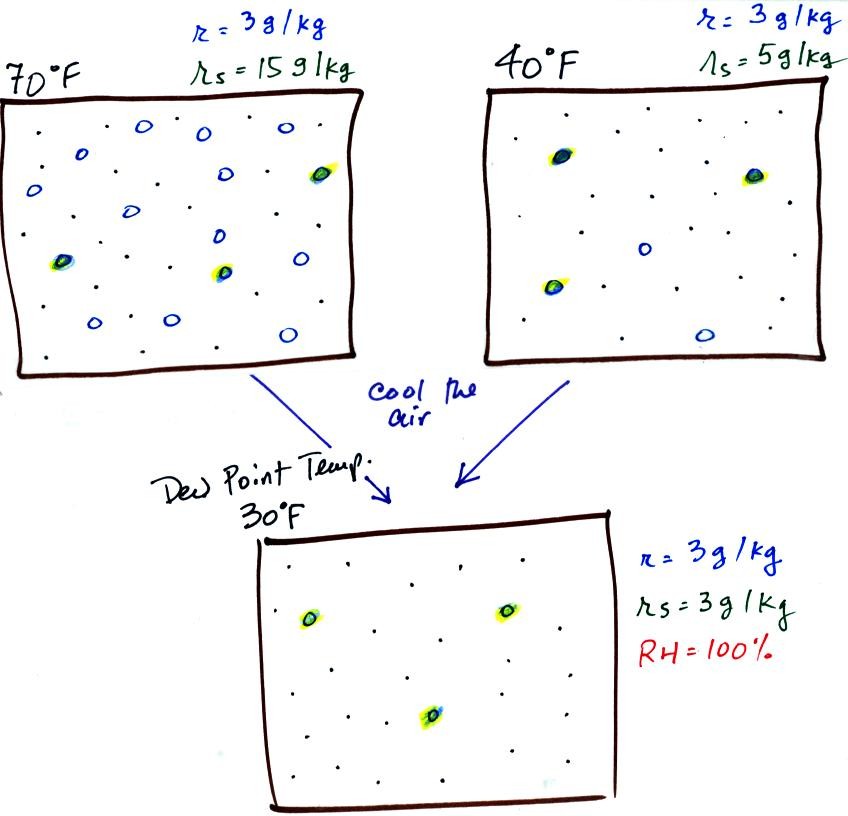
If we cool the 70 F air or the 40 F air to 30 F we would
find that the
saturation mixing ratio would decrease to 3 grams/kilogram. Since
the air actually contains 3 g/kg, the RH of the 30 F air would become
100%. The 30 F air would be saturated, it would be filled to
capacity with water vapor. 30 F is the dew point temperature for
70 F air that contains 3 grams of water vapor per kilogram of dry
air. It is also the dew point temperature for 40 F air that
contains 3 grams of water vapor per kilogram of dry air.
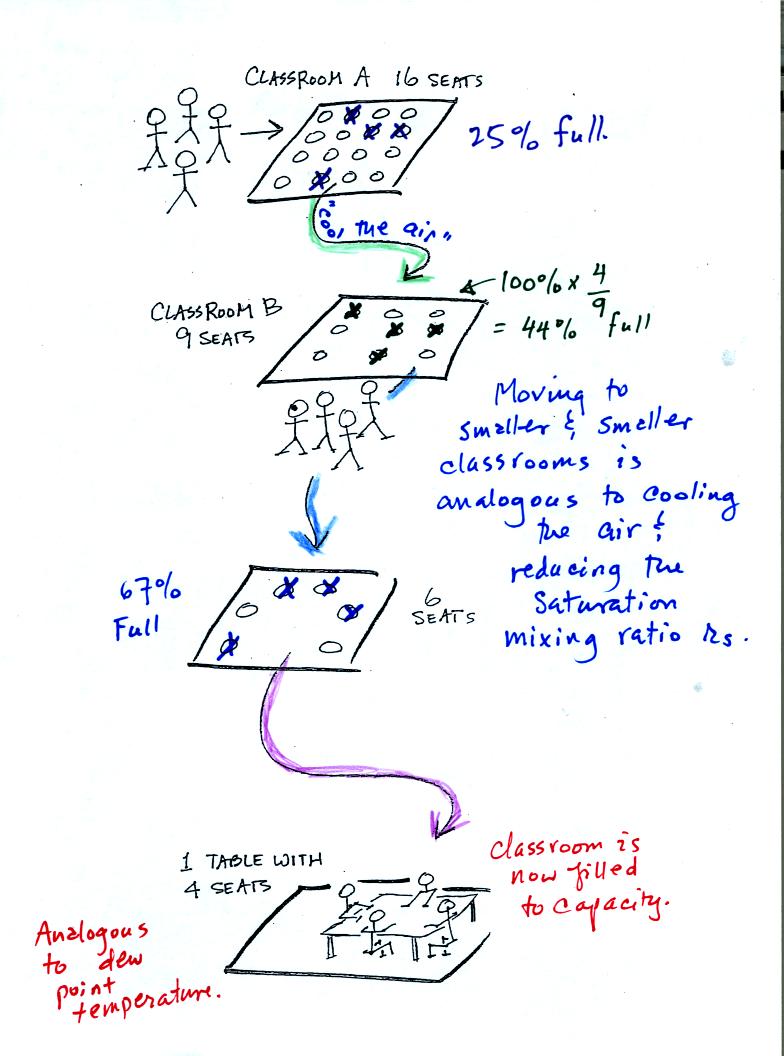
Now back to our students and classrooms analogy on the righthand
side of p. 83. The 4 students
move into classrooms of smaller and smaller capacity. The
decreasing capacity of the classrooms is analogous to the
decrease in saturation mixing ratio that occurs when you cool
air. Eventually the students move into a classroom that they just
fill to capacity. This is analogous to cooling the air to the dew
point temperature, at which point the RH becomes 100% and the air is
filled to capacity, the air is saturated with water vapor.
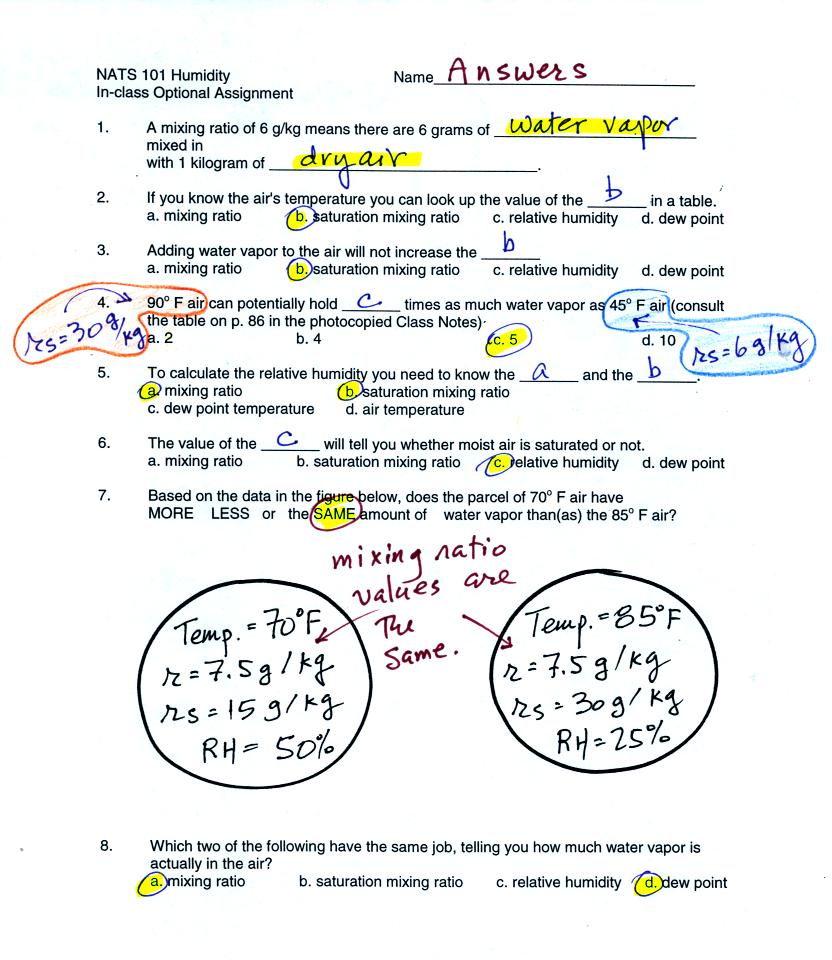
This is a
good place to put the answers to the in-class optional assignment.
I think this is the point at which we took a short "break"
and looked briefly
at Experiment #3.
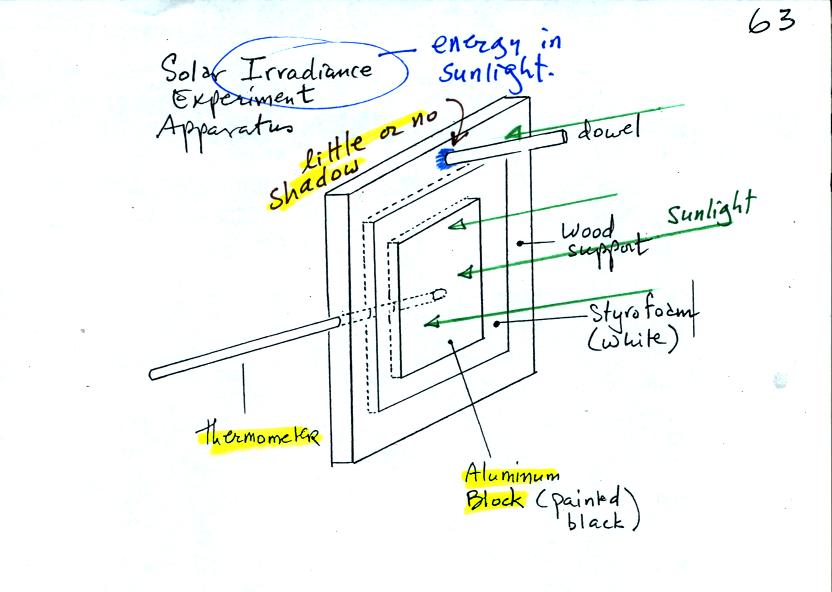
The object of Expt. #3 is to measure the energy in
sunlight. The
basic idea, shown in the figure below (see p. 63 in the photocopied
Class Notes) and in two short video tapes (that were hopefully much
clearer), is to point a flat piece of
aluminum (with known area, mass, and specific heat) straight at the sun
and measure how quickly it warms up.
Doesn't it seem reasonable to think that,
since it is the sunlight that is causing the aluminum to warm up
in the first place, you could use the temperature data to figure out
how much energy is in that sunlight? [the answer to that question
is Yes it does seem reasonable, very reasonable]
The problem is going from an idea that seems reasonable to
an equation
that you can actually use. We didn't really work out all the
details in class but it's not that difficult. Click on this solar irradiance
link if you are interested in seeing the details.
Now back
to humnidity.
Today we
will try to understand why it is possible to saturate air with
water vapor. Why is there an upper limit to the amount of water
vapor that air can contain? Why does this upper limit depend on
air temperature?
First we need to understand that the rate at which water evaporates
depends on the water's temperature.

How water evaporates more rapidly than cold water.
Picture a cup
of hot steaming coffee and a glass of iced tea.
To be able to evaporate, a water molecule in a glass must make its way
up to the
surface of the water and the water molecule must then have sufficient
kinetic energy
(to overcome any attractive forces trying to keep it in a liquid
state).
The distributions of the kinetic energies of the water molecules in the
glasses of cold and hot water (remember temperature is a measure of the
average kinetic energy) are shown in the two graphs above. In
cold water only a limited number of the water molecules
(those to the right of the highlighted line) have the necessary
energy - cold water has a low rate of
evaporation. In hot water, the whole distribution has moved to
the
right, the threshold energy needed to evaporate has remained the same,
and a larger fracton of the water
molecules will have enough energy. Hot water evaporates more
rapidly.
Now we will look at the top part of p. 85 in the photocopied
notes. We have put a cover on the glass of room temperature
water.
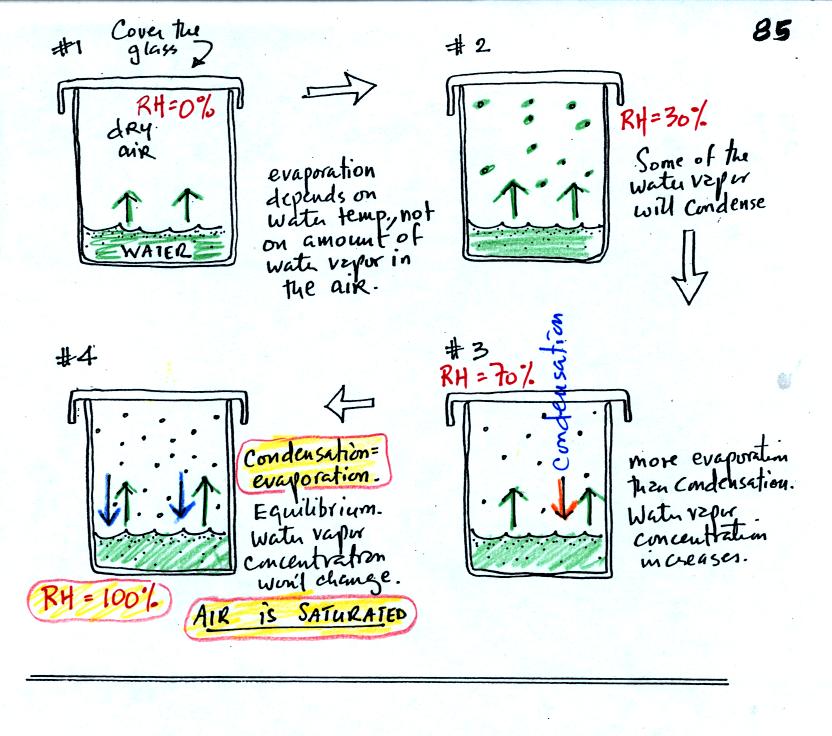
In #1 we see that the water is evaporating (2 arrows worth
of
evaporation). Water vapor will begin to build up in the air in
the glass. This is shown in #2. Some of the water vapor
molecules will condense (molecules that find themselves with lower than
average kinetic energy). In Fig. #3 the amount of water vapor has
built up to
a point where the amount of condensation is becoming significant and
one arrow worth of condensation has been added to the picture. In
#3
there is still more evaporation than condensation so the water vapor
concentration will increase a little bit more. Eventually in #4
the water vapor concentration has increased to a point that there are
two arrows of condensation. This balances the 2 arrows of
evaporation. The air is saturated, the air is filled to
capacity. With equal rates of evaporation and condensation, the
amount of water vapor in the air will now remain
constant. Note that the relative humidity is 100% at this point.
The air is filled to capacity.
What would happen if we took off the cover and added some
more water
vapor to the glass in Fig. #4? (this figure wasn't shown in class).

The air in Fig. #5 shows what would happen. The
air
would be supersaturated with water vapor and the RH would be greater
than 100%. This is possible but it is not an equilibrium
situation and wouldn't remain this way. The increased amount of
water vapor would increase the
rate of condensation. There would be more condensation than
evaporation. The water vapor concentration would begin to
decrease. Eventually the glass would return to the equilibrium
situation in Fig. #4.
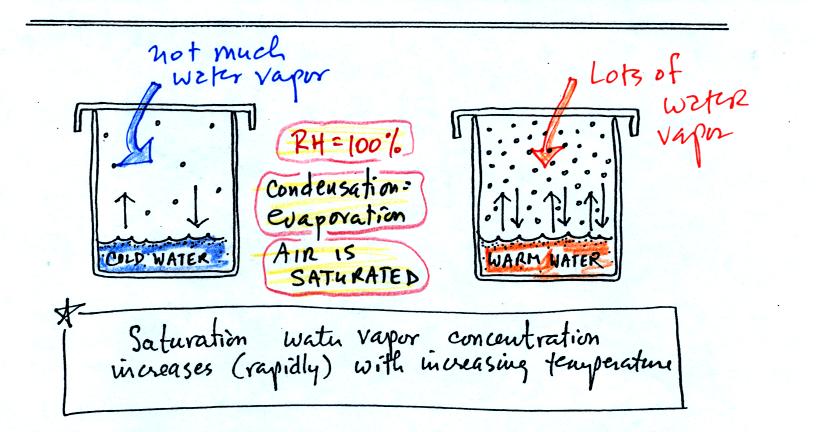
If we look at the bottom of p. 85 we see that the air in all
three cases is
saturated (equal rates of evaporation and condensation in each
case). The relative humidity is 100% in all three cases.
But because the different rates of evaporation (in cold and warm water)
require different rates of condensation to be in balance, the of water
vapor in the air in the two cases however is different. The
warm air contains a lot more water vapor than the cold air.
We worked the first of four humidity example problems, we'll do three
more in class on Thursday. The details from today's problem have
been moved to the Thu., Oct. 18 notes so that
all of the humidity
example problems will be together in one place.