Friday Sep. 18, 2009
click here to download today's notes in
a more printer friendly format
A final selection
or two from Calexico today before class. Next Monday, Pink
Martini, a group from Portland, OR, who will be in town one week from
today.
The 1S1P Bonus assignment on radon was
collected today. It will take us a while to grade these reports.
The Expt. #1 reports and the first Optional Assignment are both due next
Monday. There was also an In-class
Optional Assignment today that was collected at the end of the
period. If you weren't in class on Friday and want to answer the
questions and turn in the assignment at the beginning of class on
Monday you can receive credit (probably partial credit).
A short section on mass, weight, density and pressure was added to the Quiz #1 Study Guide.
We began class by reviewing the section on Archimedes Law that was
stuck onto the end of last Wednesday's class
notes. Basically, you can determine whether an object will
float or sink if it is immersed in a fluid by comparing the object's
density to that of the surrounding fluid. The fluid can be a gas
like air or a liquid like water. If the object is less dense than
the fluid it will float. If it is denser than the surrounding
fluid it will sink.
There's a colorful demonstration that illustrates this.

Both cans are made of aluminum which has a density almost three times
higher than water. The drink itself is largely water. The
regular Pepsi also has a lot of high-fructose corn syrup, the diet
Pepsi
doesn't. The mixture of water and corn syrup has a density
greater than plain
water. There is also a little air (or perhaps carbon dioxide gas)
in each can.
The average density of the can of regular Pepsi (water & corn syrup
+
aluminum + air) ends up being slightly greater than the density of
water. The average density of the can of diet Pepsi (water +
aluminum + air) is slightly less than the density of water.
We repeated the demonstration with a can of Pabst Blue Ribbon
beer. That also floated, the beer doesn't contain any corn syrup.
In some respects people in swimming pools are like cans of regular and
diet soda. Some people float (they're a little less dense than
water), other people sink (slightly more dense than water).
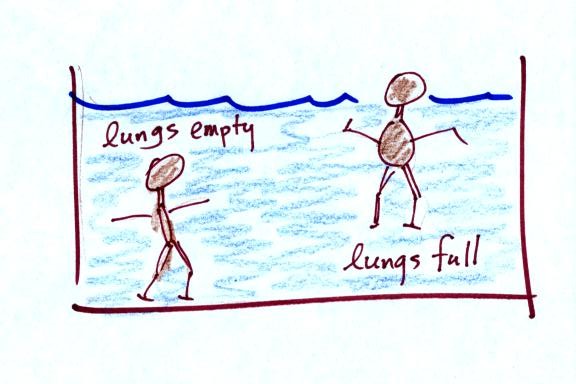
People must have a density that is about the same as water.
We also looked very briefly at a short section on Newton's Law of
Universal Gravitation that was also stuck onto the online
notes from Wednesday. There is a question about the English
units (i.e. the units we use here in the U.S.) for weight and mass on
the In-class
Optional Assignment.
So far we
have looked at how pressure and air density change with increasing
altitude. Next we had a quick look at how air temperature changes
with
altitude. The figure drawn in
class has been split into two parts and redrawn for improved
clarity (actually this is a figure from the Fall 2008 semester)
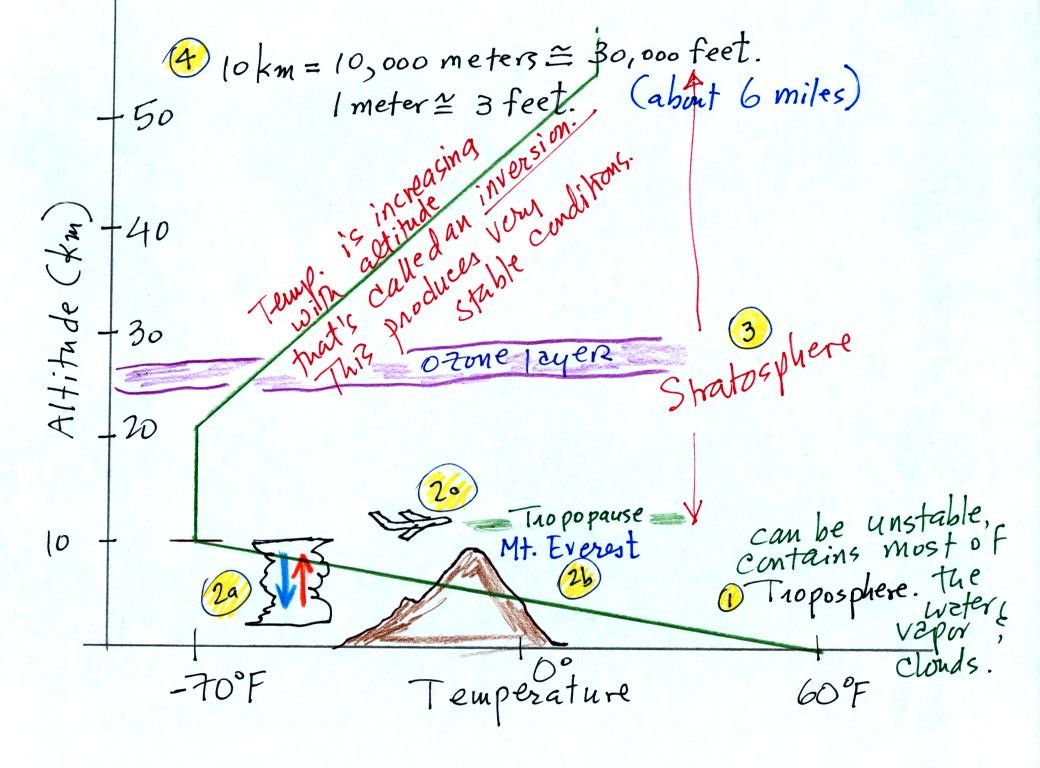
The atmosphere can be split
into layers
depending on whether
temperature is increasing or decreasing with increasing altitude.
The two lowest layers are shown in the figure above. There are
additional layers (the mesosphere and the thermosphere) above 50 km but
we won't worry about them.
1. We live in
the troposphere. The troposphere is found, on average, between 0
and about 10 km altitude, and is where temperature usually decreases
with
increasing altitude. [the troposphere is usually a little higher
in the tropics and lower at polar latitudes]
The troposphere contains most of the water vapor
in the atmosphere (the water vapor comes from evaporation of ocean
water) and is
where most of the clouds and weather occurs. The
troposphere can be stable or unstable (tropo means to turn over and
refers to the fact that air can move up and down in the
troposphere).
2a. The thunderstorm shown in
the figure indicates unstable conditions, meaning that strong up and
down air motions are occurring. When the thunderstorm reaches the
top of the troposphere, it runs into the bottom edge of the stable
stratosphere. The
air can't continue to rise into the stable stratosphere so the cloud
flattens out and forms an anvil (anvil is the name given to the flat
top of the thunderstorm). The
flat anvil top is something
that you can go outside and see and often marks the top of the
troposphere.
2b. The summit of Mt. Everest is a little over 29,000
ft. tall and is
close to the top of the troposphere.
2c. Cruising altitude in a passenger jet is usually between
30,000 and 40,000, near or just above the top of the troposphere, and
at the bottom of the stratosphere.
3. Temperature remains constant between 10 and 20 km
and then
increases with increasing altitude between 20 and 50 km. These
two sections form the stratosphere. The stratosphere is a
very stable air layer. Increasing temperature with increasing
altitude is called an
inversion. This is what makes the stratosphere so stable.
4. A kilometer is one
thousand meters. Since 1 meter is about 3 feet, 10 km is about
30,000 feet. There are 5280 feet in a mile so this is about 6
miles (about is usually close enough in this class).
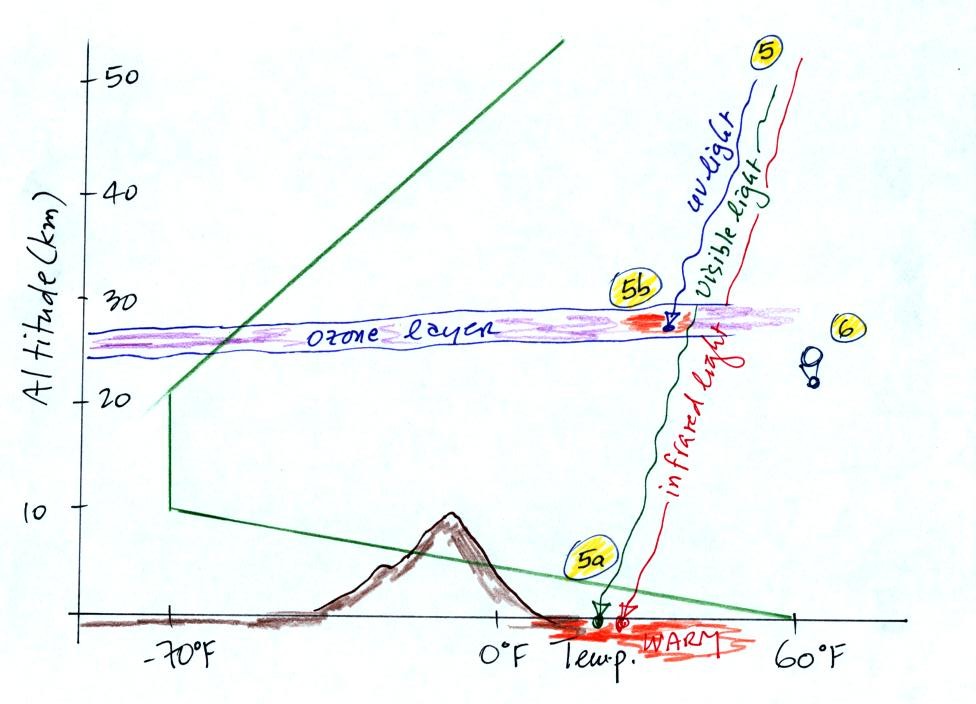
5. Sunlight is a mixture of ultraviolet (7%),
visible (44%), and
infrared light (49%). We can see the visible light.
5a. On average about 50% of the sunlight
arriving at the top of
the atmosphere passes through the atmosphere and is absorbed at the
ground (20% is absorbed by gases in the air, 30% isreflected back into
space). This warms the ground. The air in contact with the
ground is warmer than air just above. As you get further and
further from the warm ground,
the air is
colder and colder. This
explains why air temperature decreases with increasing altitude in the
troposphere.
5b. How do you explain increasing temperature with
increasing
altitude in the stratosphere.
The ozone layer is found in the stratosphere
(peak concentrations are found near 25 km altitude). Absorption
of
ultraviolet light by ozone warms the air in the stratosphere and
explains why the air can warm. The air in the stratosphere is
much less dense (thinner) than in the troposphere. So even though
there is not very much UV light in sunlight, it doesn't
take as much energy to warm this thin air as it would to warm denser
air closer to the ground.
6. That's a manned
balloon;
Auguste Piccard and Paul Kipfer are
inside. They were to first men to travel into the
stratosphere (see pps 31 & 32 in
the photocopied Class Notes). We'll see a short video showing
part of their adventure at some point in the next week or
so. It really was quite a daring trip at the time at the time,
and they very
nearly didn't survive it.
We had just a little time left to get started on a new topic -
Surface Weather Maps. We began by learning how
weather data are
entered onto surface weather maps. We'll finish this up in class
next Monday. After the quiz we'll learn about some of the
analyses of surface data that are and learn a little bit about
upper-level weather charts.
Much of our weather is produced by relatively large
(synoptic scale)
weather systems. To be able to identify and characterize these
weather systems you must first collect weather data (temperature,
pressure, wind direction and speed, dew point, cloud cover, etc) from
stations across the country and plot the data on a map. The large
amount of data requires that the information be plotted in a clear and
compact way. The station model notation is what meterologists
use.

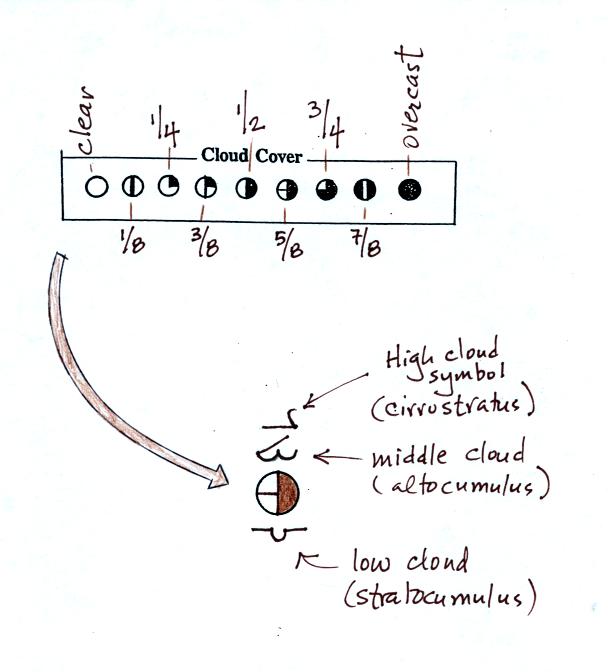
A small circle is plotted on the map at the location where
the
weather
measurements were made. The circle can be filled in to indicate
the amount of cloud cover. Positions are reserved above and below
the center circle for special symbols that represent different types of
high, middle,
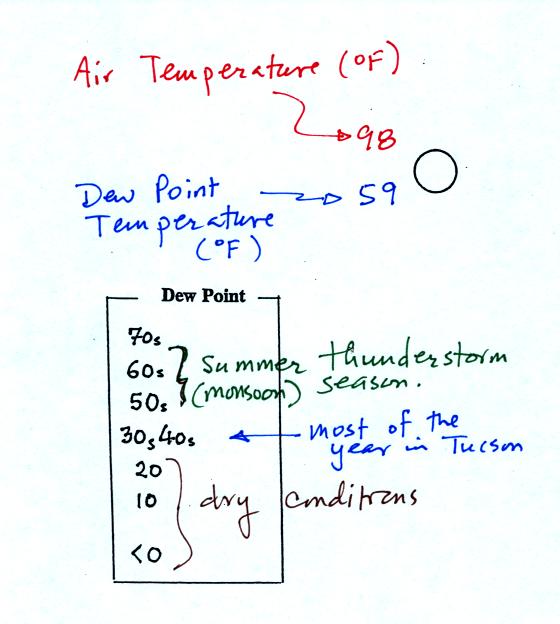
and low altitude clouds. The air temperature and dew point
temperature are entered
to the upper left and lower left of the circle respectively. A
symbol indicating the current weather (if any) is plotted to the left
of the circle in between the temperature and the dew point; you can
choose from close to 100 different weather
symbols (I'll distribute a handout next Monday with these symbols
). The
pressure is plotted to the upper right of the circle and the pressure
change (that has occurred in the past 3 hours) is plotted to the right
of the circle.
So
we'll work through this material one step at a time (refer to p. .
The center circle is filled in to indicate the portion
of
the sky
covered with clouds (estimated to the nearest 1/8th of the sky) using
the code at the top of the figure. Then symbols (not drawn in class) are used to
identify the actual types of high, middle, and low altitude clouds (the
symbols can be found on the handout to be distributed in class).
The air temperature in this example was 98o
F
(this is
plotted above and to the left of the center circle). The dew
point
temperature was 59o F and is plotted below and to the left
of the center circle. The box at lower left reminds you that dew
points are in the 30s and 40s during much of the year in Tucson.
Dew
points rise into the upper 50s and 60s during the summer thunderstorm
season (dew points are in the 70s in many parts of the country in the
summer). Dew points are in the 20s, 10s, and may even drop below
0 during dry periods in Tucson.
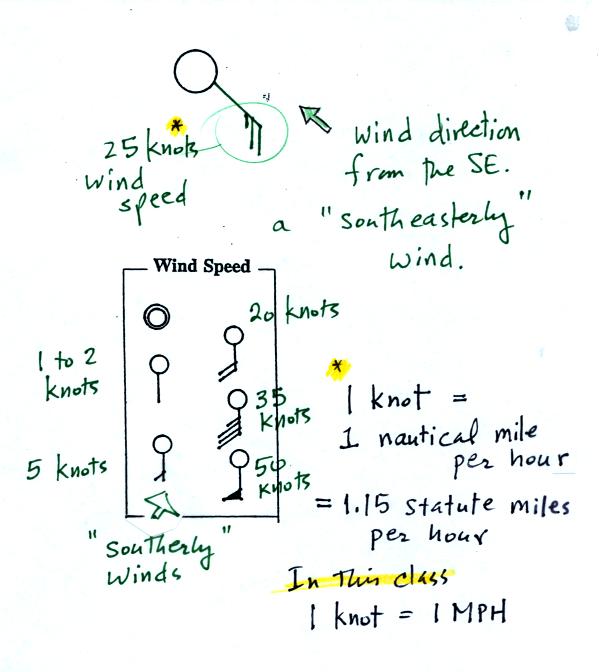
A straight line extending out from the center circle
shows the wind direction. Meteorologists always give the
direction the wind is coming from.
In this example the winds are
blowing from the SE toward the NW at a speed of 25 knots. A
meteorologist would call
these southeasterly winds. Small barbs at the end of the straight
line give the wind speed in knots. Each long barb is worth 10
knots, the short barb is 5 knots.
Knots are nautical miles per hour. One nautical mile per hour is
1.15 statute miles per hour. We won't worry about the distinction
in this class, you can just pretend that one knot is the same as one
mile per hour.
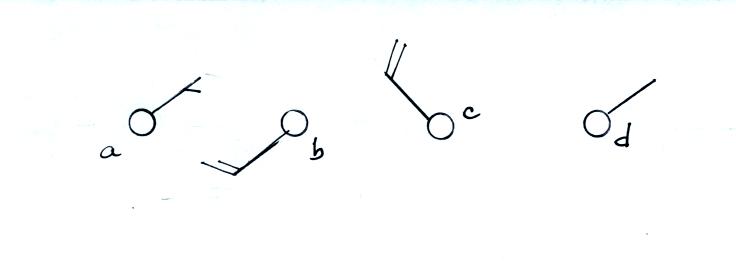
Here are some additional wind
examples that weren't shown
in
class:
In (a) the winds are from the NE at 5 knots, in
(b) from the
SW at 15
knots, in (c) from the NW at 20 knots, and in (d) the winds are from
the NE at 1 to 2 knots.
That's all we had time for in class on Friday. We'll finish up
the material on pps. 36&37 in the photocopied ClassNotes in class
on Monday.