Tuesday Oct. 13, 2009
click here to download today's notes in
a more printer friendly format.
Some what I guess might be called Rockabilly music before class today:
"Hot Rod Lincoln" (part
1 and part 2)
and "I Gotta Get Drunk" from the Twangbangers.
The Experiment #2 reports were collected in class today. If you
weren't able to turn in your report (or haven't yet returned your
materials) please do so as soon as you can. It takes
about a week to get those graded. I'm guessing you should expect
to get them back next Thursday Oct. 22. You will then have a
chance to revise your reports if you want to.
I am planning to distribute the Expt. #3 materials in class on Thursday
before the quiz.
The most recent Optional Assignment was returned in class today.
If you don't see a grade marked, you received full credit (0.5 extra
credit points). Be sure to check the online answers
because not all of the problems on the assignment were graded.
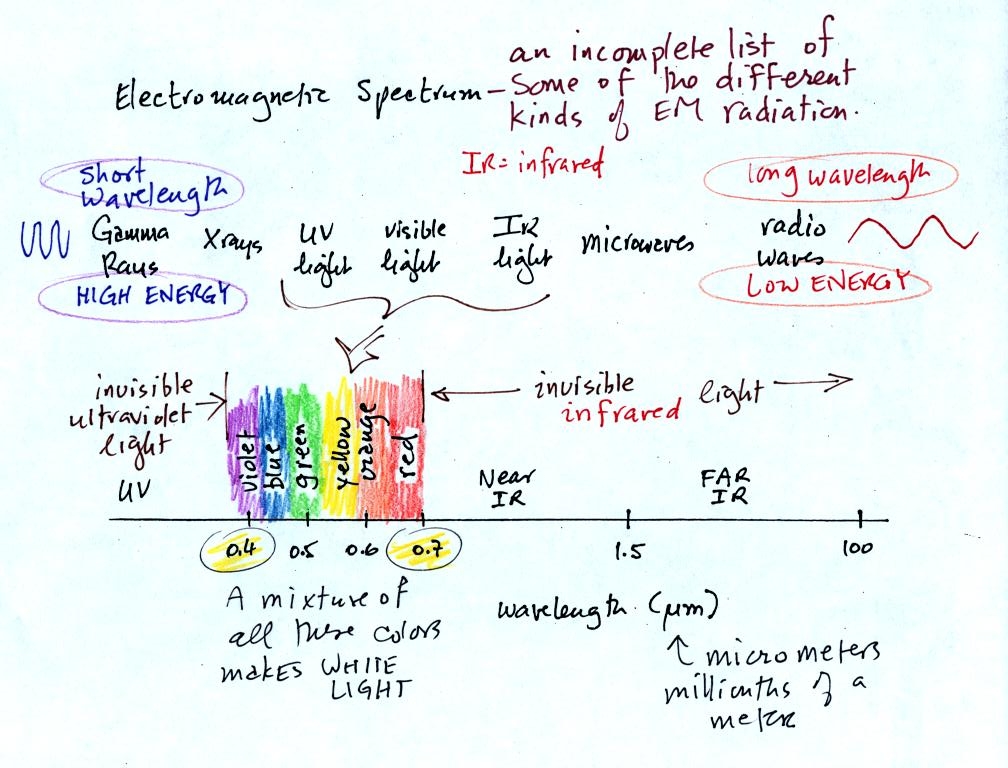
We started with the bottom half of p. 61 in the photocopied ClassNotes
- the electromagnetic spectrum (part of it anyway)
This is really just a partial list
of some of the different
types of EM
radiation. In the top list, shortwave length and high energy
forms of EM radiation are on the left (gamma rays and X-rays for
example). Microwaves and radiowaves are longer wavelength, lower
energy forms of EM radiation.
We will mostly be concerned with just ultraviolet light (UV),
visible
light (VIS), and infrared light (IR). Note the micrometer
(millionths of a meter) units used for wavelength for these kinds of
light. The visible
portion of the spectrum falls between 0.4 and 0.7 micrometers
(UV and
IR light are both invisible). All of the vivid colors
shown above
are just EM radiation with slightly different wavelengths. When
all the colors are mixed together you see white light.
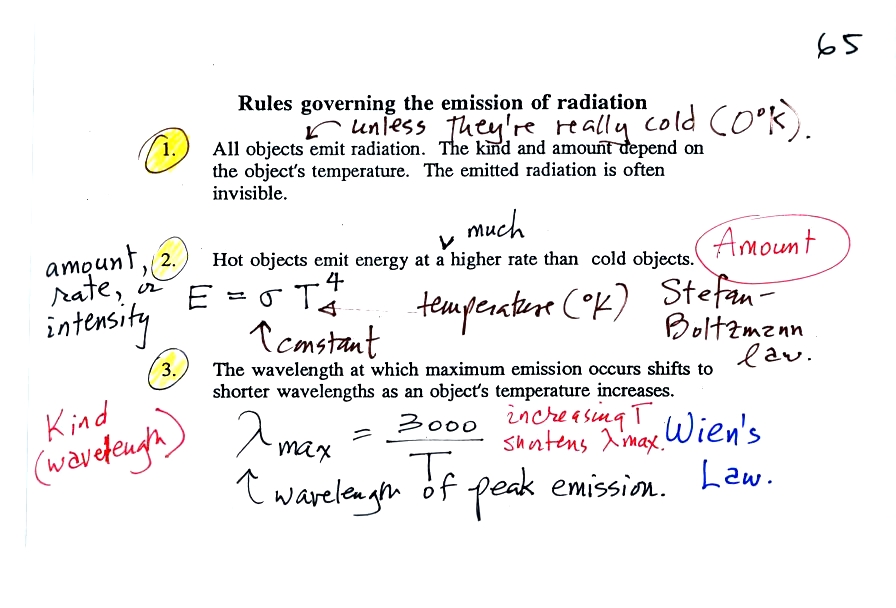
Here are some rules governing the emission of electromagnetic
radiation:
1.
Unless an object
is very cold (0
K) it will emit EM
radiation. All the people, the furniture, the walls and the floor
in the classroom, even the air, are emitting EM radiation. Often
this radiation
will be invisible so that we can't see it and weak enough that we can't
feel it (it might just be that because it is there all the time we just
aren't aware of it). Both the amount and kind (wavelength) of the
emitted
radiation depend on the object's temperature.
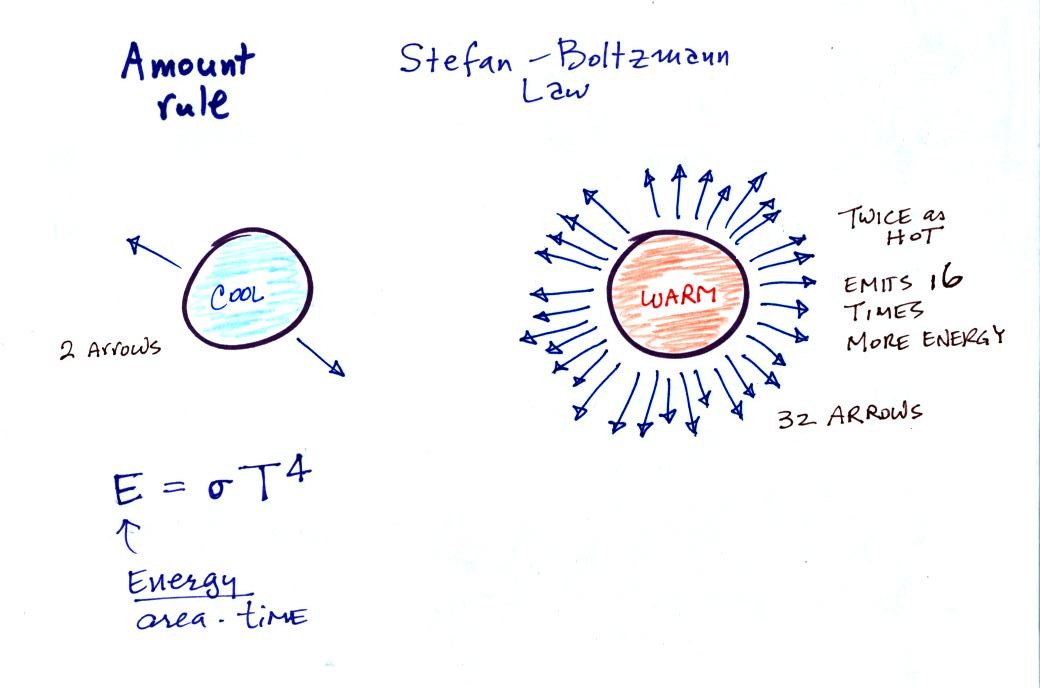
2.
The second rule allows you to
determine the amount of EM radiation (radiant energy) an object will
emit. Technically it's energy per unit area per unit time, but
don't worry about the units,
you can think of this as amount, or rate, or intensity.
Don't worry about σ either, it is just a
constant.
The amount depends on temperature to
the fourth
power. If the temperature of an object doubles the amount of
energy emitted will increase by a factor of 2 to the 4th power
(that's 2 x 2 x 2 x 2 = 16). A hot object just doesn't emit a
little more energy than a
cold object it emits a lot more energy than a cold object. This
is illustrated in the following figure:
3.
The third rule tells you something
about the kind of radiation emitted
by an object. We will see that objects usually emit radiation at
many different wavelengths. There is one wavelength however at
which the object emits more energy than at any other wavelength.
This is called lambda max (lambda is the greek character used to
represent wavelength) and is called the wavelength of maximum
emission. The third rule allows
you to calculate "lambda max." This is illustrated below:
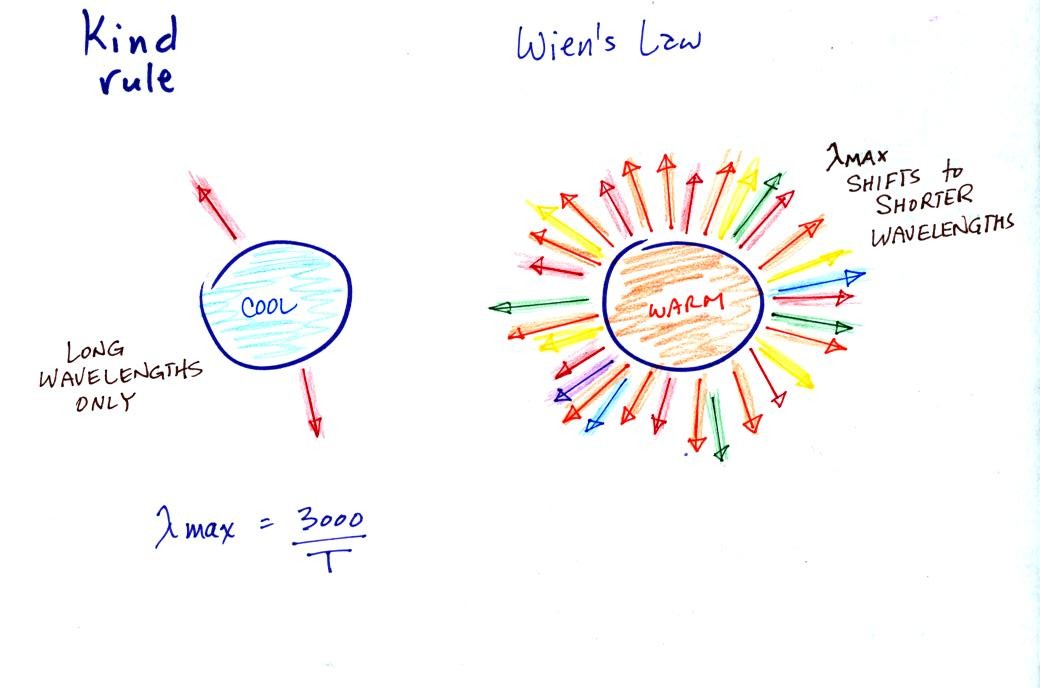
The
following graphs (at the bottom of p. 65 in the photocopied Class
Notes) also help to
illustrate the Stefan-Boltzmann law
and Wien's law.
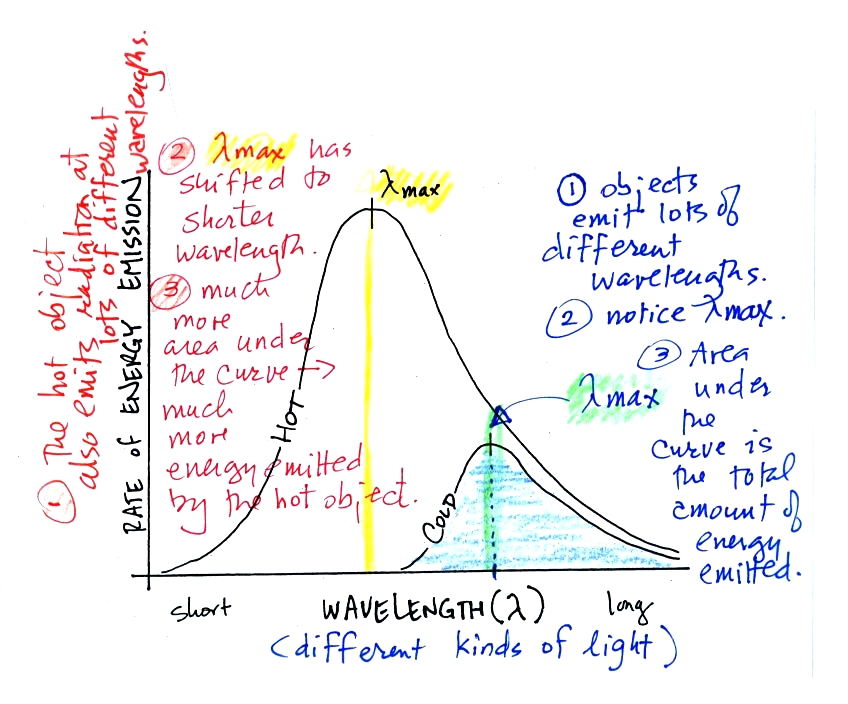
1.
Notice first that both and warm
and
the cold objects emit radiation
over a range of wavelengths (the curves above are like quiz scores, not
everyone gets the same score, there is a distribution of grades)
2.
You can now see better what Lambda
max represents. Lambda max has shifted toward
shorter wavelengths for the warmer
object. This is Wien's law in action. The warmer object is
emitting lots of types of short wavelength radiation that the colder
object
doesn't emit.
3.
The area under the warm object
curve is much bigger than the area under
the cold object curve. The area under the curve is a measure of
the total radiant energy emitted by the object. This illustrates
the fact that the warmer object emits a lot more radiant energy than
the colder object.
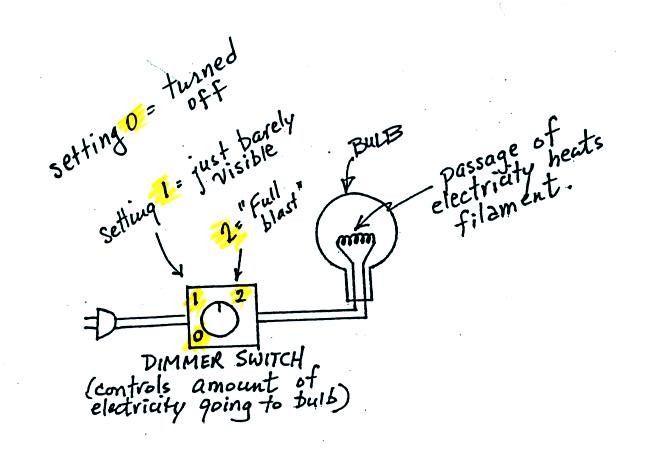
An
ordinary 200 W tungsten bulb connected to a dimmer switch can be
used to demonstrate these rules (see p. 66 in the photocopied
ClassNotes). We'll be seeing the EM radiation emitted by the bulb
filament.
The graph at the bottom of p. 66 has been split up into 3 parts and
redrawn for improved clarity.

We start with the bulb turned off (Setting 0). The
filament will be at room temperature which we will assume is around 300
K (remember that is a reasonable and easy to remember value for the
average temperature of the earth's surface). The bulb will be
emitting radiation, it's shown on the top graph above. The
radiation is very weak so we
can't
feel it. It is also long wavelength, far IR, radiation so we
can't see it. The wavelength of peak emission is 10 micrometers.
Next we use the dimmer switch to just barely turn the bulb on (the
temperature of the filament is now about 900 K).
The bulb wasn't very bright at all and had an orange color. This
is curve 1, the middle figure. The curve is bigger and has
shifted left. The far left end of the
emission curve has
moved left of the 0.7 micrometer mark - into the visible portion of the
spectrum. That is what you are able to see, just the small
fraction of
the radiation emitted by the bulb that is visible light (but just
long wavelength red and orange light). Most of the radiation
emitted by the bulb is to the right of the 0.7 micrometer mark and is
invisible IR radiation (it is strong enough now that you could feel it
if you put your hand next to the bulb).
Finally we turn on the bulb completely (it was a 200 Watt bulb so it
got
pretty bright). The filament temperature
is now about 3000K. The bulb is emitting a lot more visible
light, all the colors, though not all in equal amounts. The
mixture of the colors produces a "warm
white" light. It is warm because it is a mixture that contains a
lot more red, orange, and yellow than blue, green, and violet
light. It is interesting that most of the radiation emitted by
the bulb is still in the IR portion of the spectrum (lambda max is 1
micrometer). This is
invisible light. A tungsten bulb like this is not very
efficient, at least not as a source of visible light.
You were able to use one of the diffraction gratings to
separate the
white light produced by the bulb into its separate colors.
When you looked at the bright white bulb filament through one of the
diffraction gratings the colors were smeared out to the right and left
as shown below.

Some of the grating handed out in class behaved a little differently
and spread out the colors horizontally, vertically, and diagonally.

The sun
emits electromagnetic radiation. That shouldn't come as a surprise
since you can see it and feel it. The earth also emits
electromagnetic radiation. It is much weaker and invisible.
The kind and amount of EM radiation emitted by the earth and sun depend
on their respective temperatures.
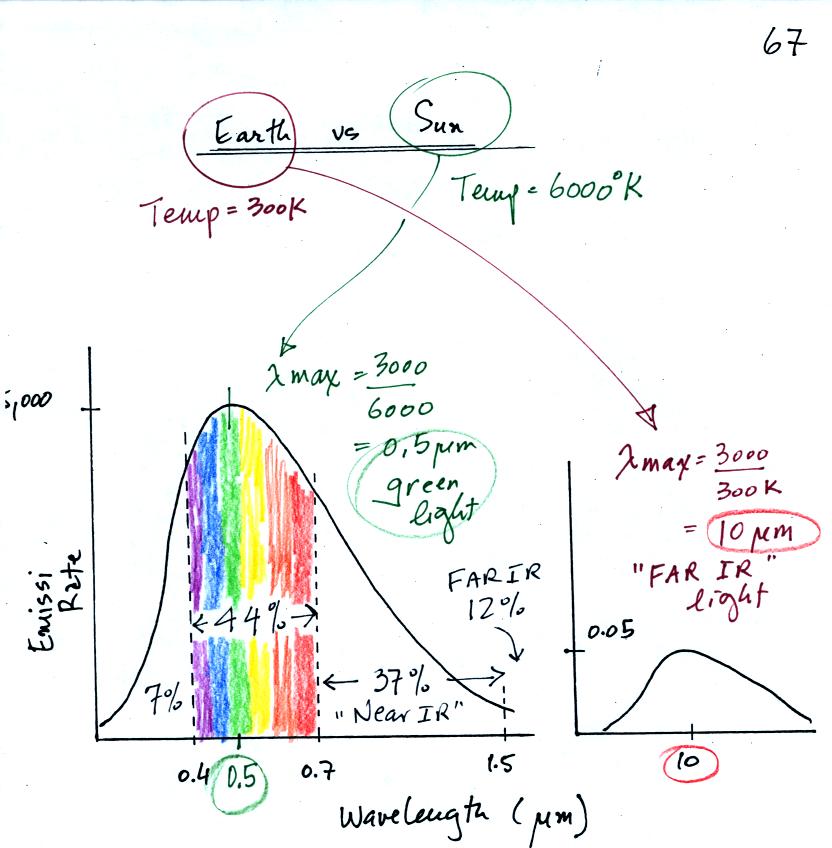
The curve on the left is for the sun. We first used Wien's
law and a temperature of 6000 K to calculate lambda max and got
0.5 micrometers. This is green light; the sun emits more green
light than any other kind of
light. The sun doesn't appear green because it is also emitting
lesser amounts of violet, blue, yellow, orange, and red - together this
mix of
colors appears white. 44% of the radiation emitted by the sun is
visible light, 49% is IR light (37% near IR + 12% far IR), and 7%
is ultraviolet light. More than half of the light emitted by the
sun (UV + IR) is invisible.
100% of the light emitted by the earth (temperature = 300 K) is
invisible IR light. The
wavelength of peak emission for the earth is 10 micrometers.
Because the sun (surface of the
sun) is 20 times hotter than the earth a square foot of the sun's
surface emits energy at a rate that is 160,000 times higher than a
square foot on the
earth. Note
the vertical scale on the earth curve is different than on the sun
graph. If both the earth and sun were plotted with the same
vertical scale, the earth curve would be too small to be seen.
We now
have most of the tools we will need to begin to study energy balance on
the earth. It will be a balance between incoming sunlight
energy and outgoing energy emitted by the earth. We will look at
the simplest case first, the earth without an atmosphere (or at least
an atmosphere without greenhouse gases) found on p. 68 in the
photocopied Classnotes.
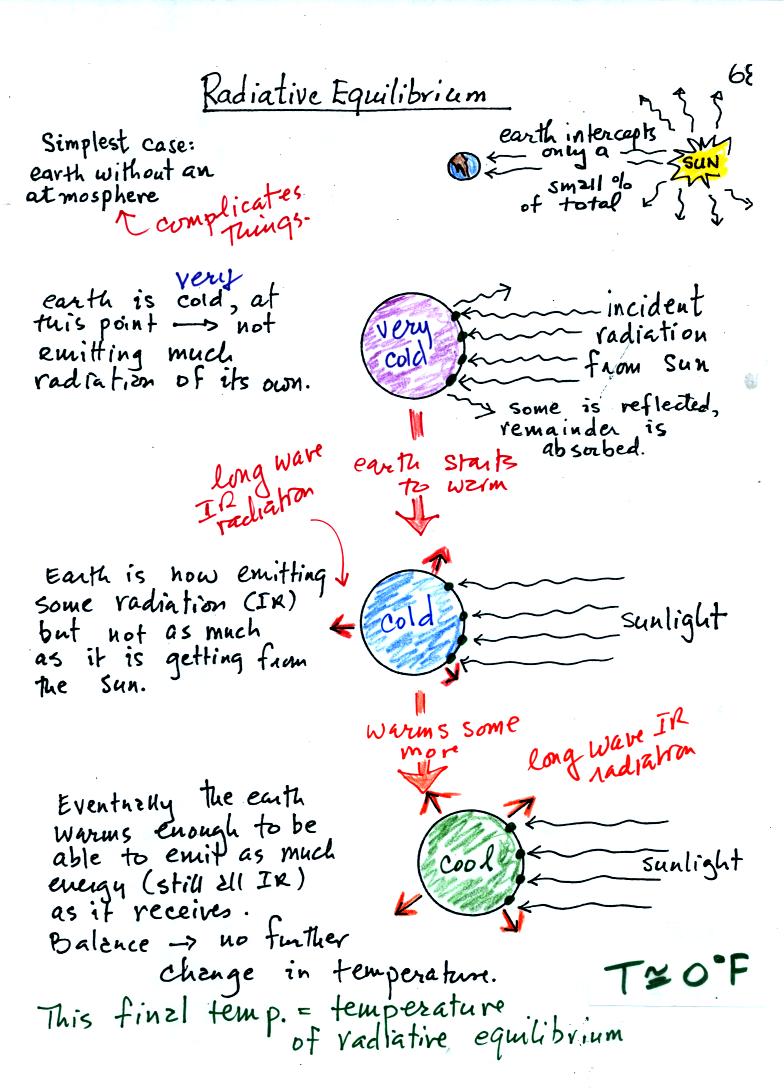
You might first wonder how, with
the sun emitting so much
more
energy than the earth, it is possible for the earth (with a temperature
of around 300 K) to be in energy
balance with the sun (6000 K). At the top right of the figure you
can see that the earth is located about 90
million miles
from the sun and therefore only absorbs a very small fraction of the
total energy emitted by the sun.
To understand how energy balance occurs we start, in Step #1, by
imagining that the earth starts out very cold (0 K) and is
not emitting
any EM radiation at all. It is absorbing sunlight however so it
will
begin to warm. This is like opening a bank account, the balance
will be zero. But then you start making deposits and the balance
starts to grow.
Once the earth starts to warm it will also begin to emit EM
radiation, though not as much as it is getting from the sun (the
slightly warmer earth in the middle picture is now colored blue).
Once you find money in your bank account you start to spend it.
Because the earth is still gaining more energy than it is losing the
earth will warm some more.
Eventually it will warm enough that the earth (now shaded green)
will
emit the same amount
of energy (though not the same wavelength energy) as it absorbs from
the sun. This is radiative equilibrium, energy balance. The
temperature at
which this occurs is about 0 F.
That is called the temperature of radiative equilibrium. You
might remember this is the figure for global annual average surface
temperature on the earth without the greenhouse effect.
Before we
start to look at radiant energy balance on the earth with an atmosphere
we
need to learn about filters. The atmosphere will filter sunlight
as it
passes through the atmosphere toward the ground. The atmosphere
will
also filter IR radiation emitted by the earth as it tries to travel
into
space.
We will first look at the effects simple blue, green, and red glass
filters have on visible light. This is just to become familiar
with filter absorption graphs.
If you try to shine white light (a
mixture of all the colors) through a
blue filter, only the blue light passes through. The filter
absorption curve shows 100% absorption at all but a narrow range of
wavelengths that correspond to blue light. Similarly the green
and red filters only let through green and red light.
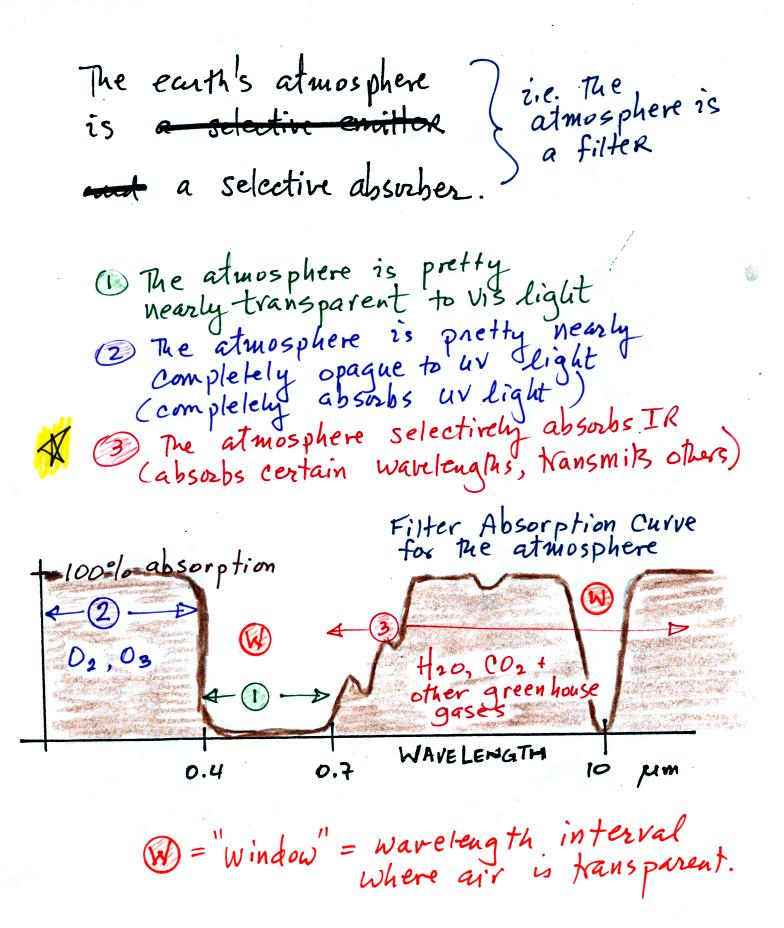
The following figure is a simplified, easier to
remember,
representation of the
filtering effect of
the atmosphere on UV, VIS, and IR light (found on p. 69 in the
photocopied notes). The figure was borrowed from a previous
semester because it was drawn more neatly.
You can use your own eyes to tell
you what the filtering
effect of the
atmosphere is on visible light. Air is clear, it is
transparent. The atmosphere transmits visible light.
In our simplified representation oxygen and ozone make the
atmosphere pretty nearly completely opaque to UV light . Don't
let the word opague bother you - we assume that the
atmosphere absorbs all incoming UV light, none of it makes it to the
ground. This is of course not entirely realistic.
Greenhouse gases make the
atmosphere a
selective absorber of IR light - the air absorbs certain IR wavelengths
and
transmits others. It is the atmosphere's ability to absorb (and
also emit) certain wavelengths of infrared light that produces the
greenhouse effect and warms the surface of the earth.
Note "the atmospheric window"
centered at 10 micrometers. Light emitted by the earth at this
wavelength will pass through the atmosphere. Another transparent
region, another window, is found in the visible part of the spectrum.
You'll find a more realistic picture of the atmospheric absorption
curve on p. 70 in the photocopied Classnotes, but the simplified
version above will work fine for us.
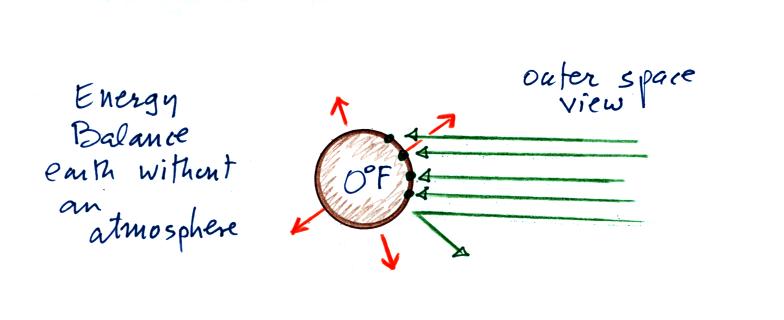
Here's the
outer space view of radiative equilibrium on the earth without an
atmosphere. The important thing to note is that the earth is
absorbing and emitting the same amount of energy (4 arrows absorbed
balanced by 4 arrows emitted).
We will be moving from an outer
space vantage point of
radiative equilibrium (figure above) to the earth's
surface (figure below).
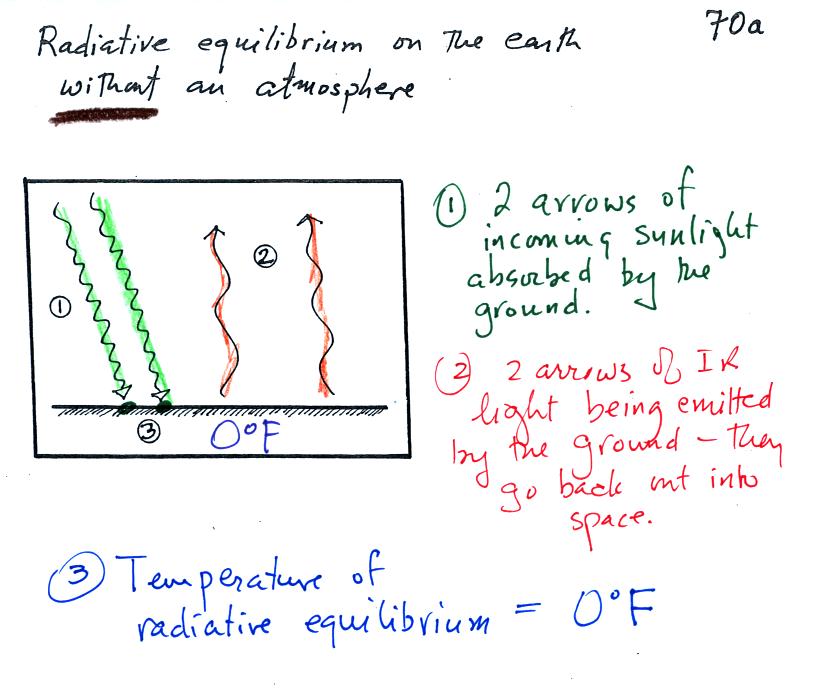
Don't let the fact that there are
4 arrows are
being absorbed and
emitted in the top figure and
2 arrows absorbed and emitted in the bottom figure
bother you. The important thing is that there are equal
numbers of arrows coming in and going out. That is what indicates
energy balance. Balance occurs then the earth has warmed to 0 F.
The next
step is to add the atmosphere.
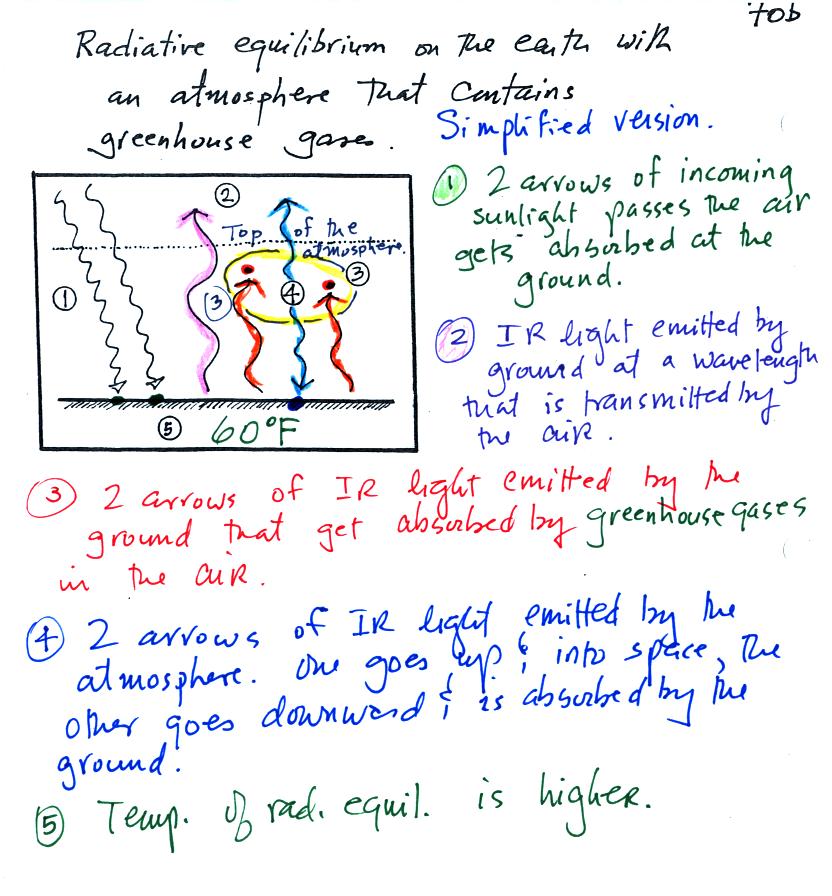
We will study a simplified version
of radiative equilibrium just so you
can identify and understand the various parts of the picture.
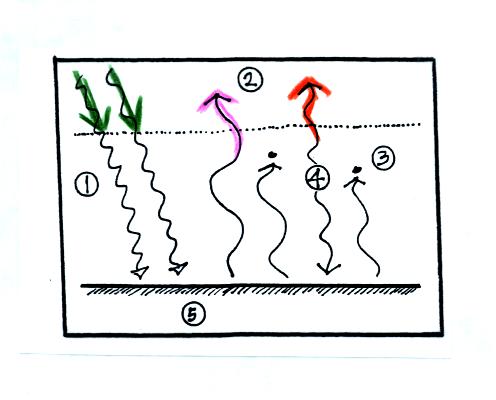
Keep an eye out for the greenhouse effect. Here's the figure that
we ended up with in class
It would be hard to sort through all of this if you weren't in
class
(and maybe even if you were) to see how it developed. So below we
will go through it again step by step (which you are free to skip over
if you wish).
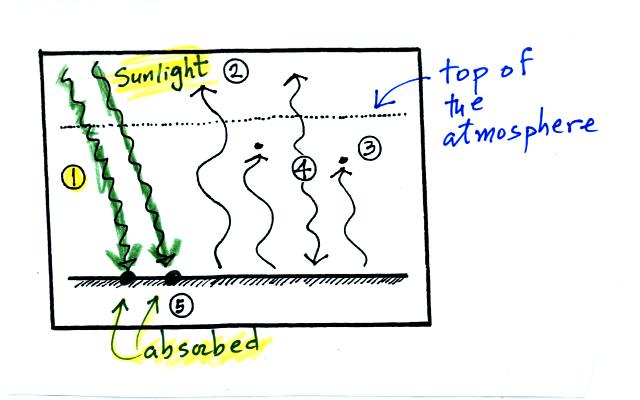
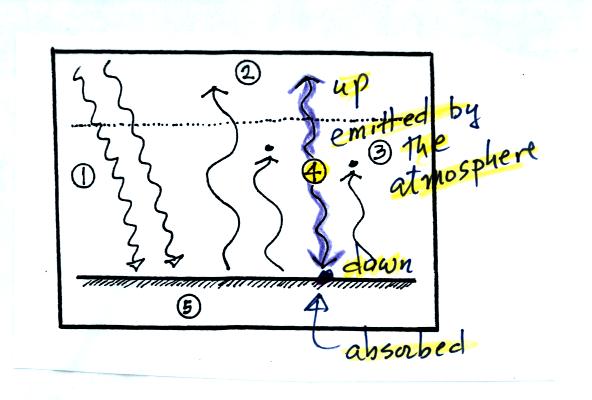
1. The
figure shows two
rays of incoming sunlight that
pass through the atmosphere, reach the ground, and are absorbed.
100% of the incoming sunlight is transmitted by the atmosphere.
This wouldn't be too bad of an assumption if sunlight were just visible
light. But it is not it is about half IR light and some of that
is going to be absorbed.
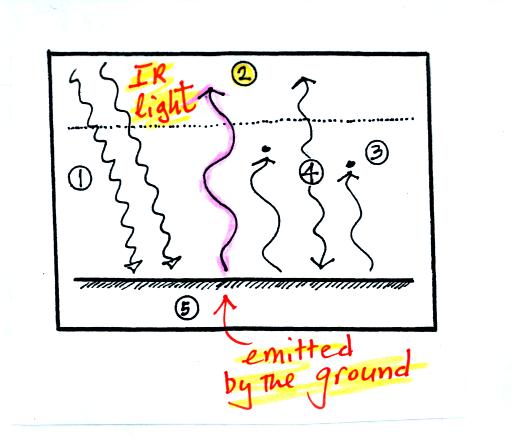
The ground is emitting 3 rays of IR radiation.
2. One of these is emitted by
the ground at a wavelength
that is
NOT absorbed by greenhouse gases in the atmosphere. This
radiation passes through the atmosphere and goes out into space.
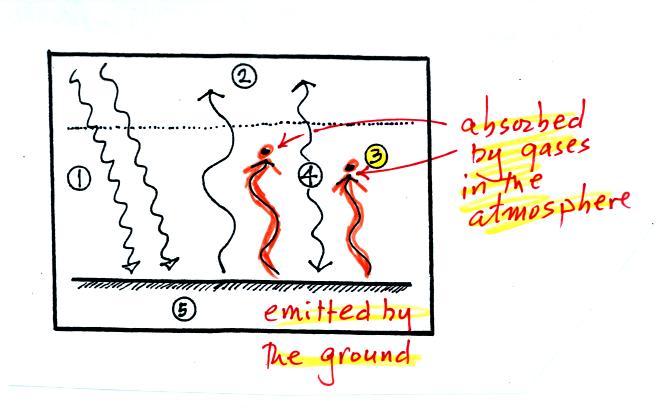
3. The other 2 units of IR radiation emitted by
the
ground are
absorbed by
greenhouse gases is the atmosphere.
4. The atmosphere is absorbing
2 units of radiation.
In order to be in radiative equilibrium,the atmosphere must also emit 2
units of radiation. 1
unit of IR radiation is sent upward into space, 1 unit is sent downward
to the ground where it is absorbed.
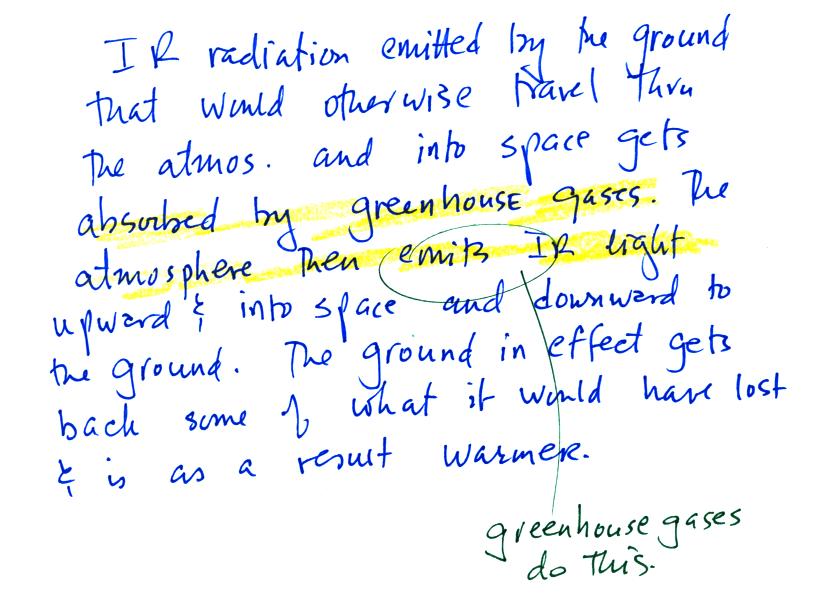
The greenhouse effect is found in this absorption and
emission
of IR radiation by the atmosphere. Here's how you might put it
into words:
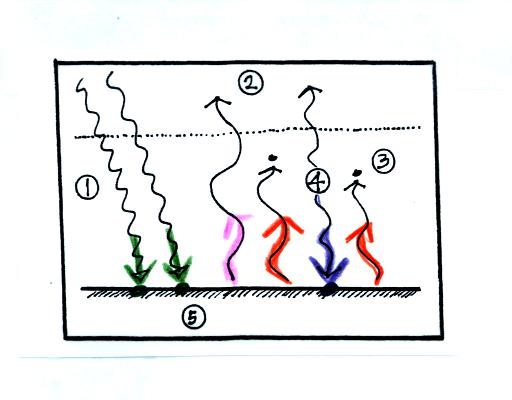
Before we go any further we will check
to be sure that
every part
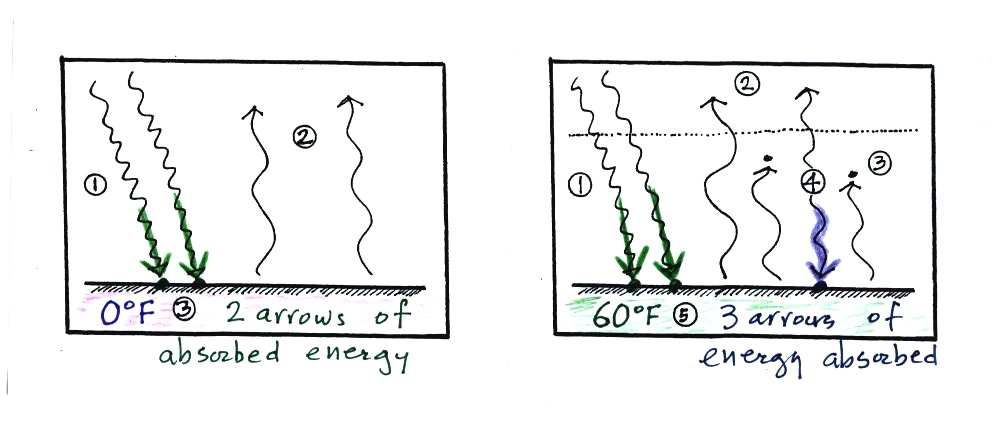
of this picture is in energy balance.
The ground is absorbing 3 units of energy (2 green
arrows and one purple arrow above) and emitting
3
units of energy (one pink and two red arrows)
The atmosphere is absorbing 2 units of energy and
emitting 2
units of
energy
2 units of energy arrive at the earth from outer
space, 2 units
of
energy leave the earth and head back out into space.
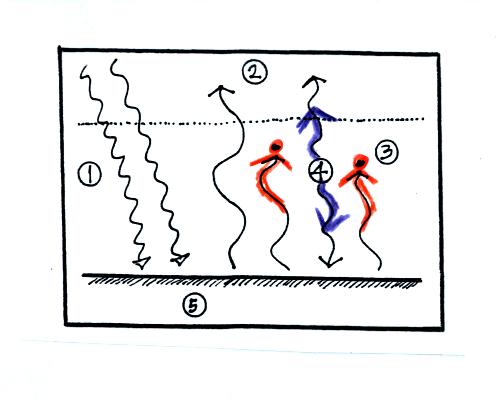
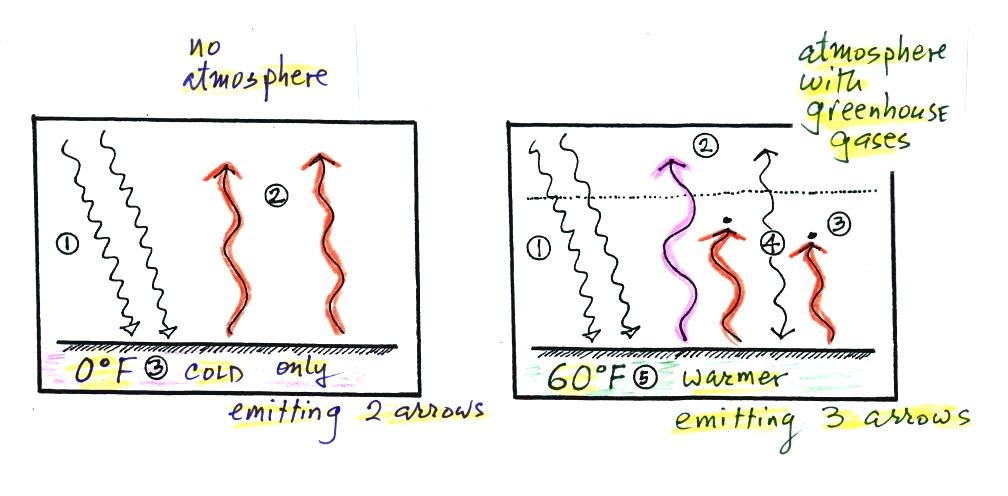
The
greenhouse effect makes the earth's surface warmer than it would be
otherwise (global annual average of 60 F instead of 0 F).
Energy balance with (right) and without (left) the
greenhouse
effect. At left the ground is emitting 2 units of energy, at
right the ground is emitting 3 units. Remember that the amount of
energy emitted by something depends on temperature. The ground
must be warmer to be able to emit 3 arrows of energy rather than 2
arrows.
Here's another explanation (that wasn't mentioned in class).
At left the ground
is getting 2 units of energy. At right it is getting three, the
extra one is coming from the atmosphere. Doesn't it seem
reasonable
that ground that absorbs 3 units of energy will be warmer than ground
that is only absorbing 2?
Class
ended with a demonstration, one that might save students (that live off
campus and
pay electric bills) some money.
Earlier today we learned that ordinary tungsten bulbs (incandescent
bulbs) produce a lot of
wasted energy. They emit a lot of infrared light that is
wasted because it doesn't light up a room (it will heat up a room but
there are better ways of doing that). The light that they do
produce is a warm white color (tungsten bulbs emit lots of orange, red,
and yellow light and not as much blues, greens and violets). Energy
efficient
compact
fluorescent lamps (CFLs) are
being touted as an ecological alternative to tungsten bulbs because
they use substantially less electricity, don't emit a lot of
wasted infrared light, and also last
longer. CFLs come with
different color temperature ratings.
The bulb with the hottest
temperature rating (5500 K ) in the figure
above is meant to mimic or simulate sunlight. The temperature of
the sun is 6000 K and lambda max is 0.5 micrometers. The spectrum
of the 5500 K bulb is similar.
The tungsten bulb (3000 K) and the CFLs with temperature ratings
of
3500 K and 2700 K produce a warmer white.
Three CFLs with the temperature ratings above were set up in class
so
that you could see the difference between warm and cool white
light. Personally I find the 2700 K bulb "too warm," it makes a
room
seem gloomy at night. The 5500 K bulb is "too cool" and creates
a stark sterile atmosphere like you might see in the hallways in a
hospital. I prefer the 3500 K bulb in the
middle.
This figure below is from an article
on compact fluorescent lamps in Wikipedia for those of you that weren't
in class and didn't see the bulb display.. You can
see a clear difference between the cool white bulb on the left
in the figure below and the warm white light produced by a tungsten
bulb (2nd from the left) and 2 CFCs with low temperature ratings (3rd
and 4th from the left).
There is one downside to these energy efficient CFLs. The bulbs
shouldn't just be discarded in your ordinary household trash because
they contain mercury. They should be disposed of properly.
Good job today in class. From where I stand it looked like
you were awake, thinking, participating, and I hope understanding the
material.