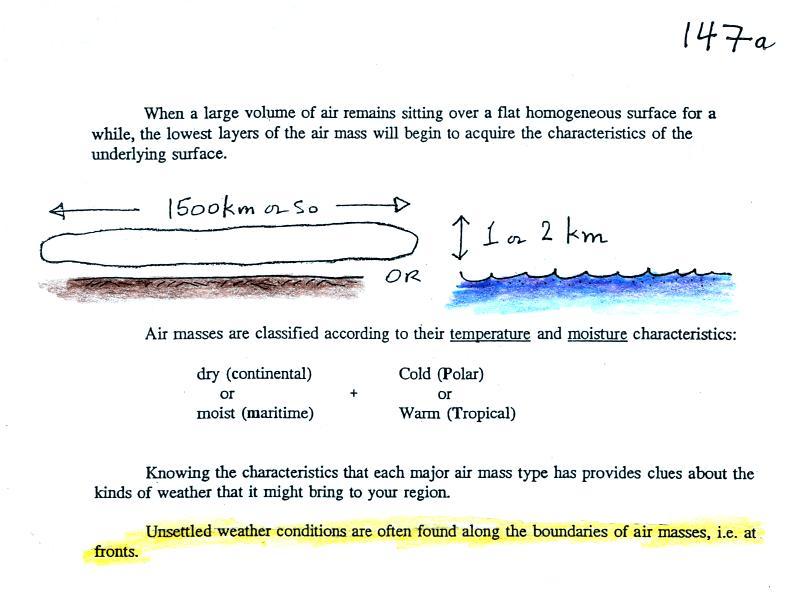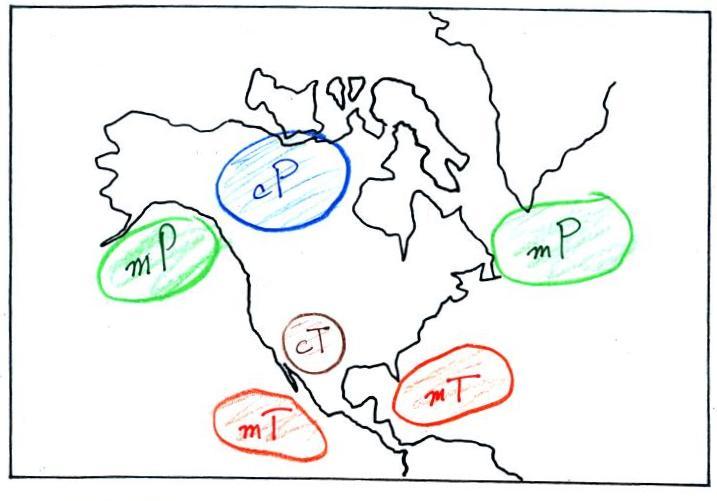

The 4 main air masses are perhaps
best illustrated on a map. The figure above shows typical source
regions for the main air mass types. Note the continental US is
not a good source region - its terrain is too varied. The US
however is where different air masses can collide.
OK back to where we left off last Monday. We were looking at
what can be learned once isobars (pressure contours) are drawn on a
surface weather map. Here's a quick review/summary.
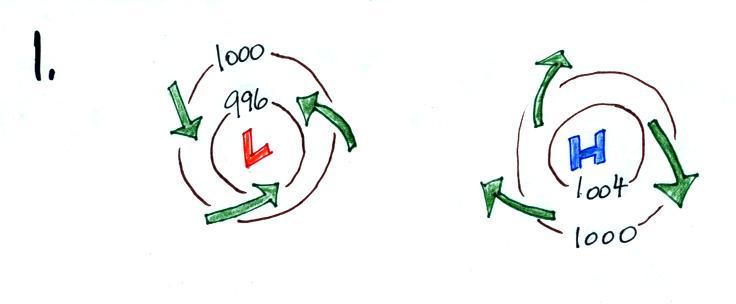
Isobars allow you to locate surface centers of High and Low
pressure. Winds spin counterclockwise around and spiral inward
toward low pressure. The converging winds rise in the
middle. Rising air expands and cools. If the air is moist
and there is sufficient cooling, clouds can form.
Winds spin clockwise and spiral ouward from high pressure. The
diverging surface winds cause sinking air motions in the center of the
high. Sinking air is compressed and warms. This keeps
clouds from forming.
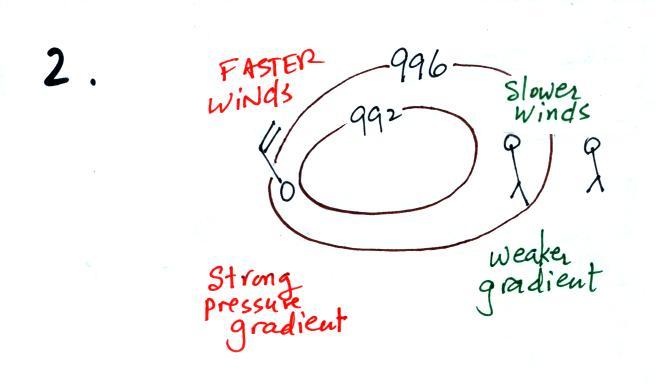
We also learned that contour
spacing provides some information about wind speed. Tightly
spaced contours indicate a strong pressure gradient and produce fast
winds. Slower winds are found where the contours are more widely
spaced (weaker pressure gradient).
3.
The
pressure pattern determines the wind direction and wind
speed. Once the winds start to blow they can affect and change
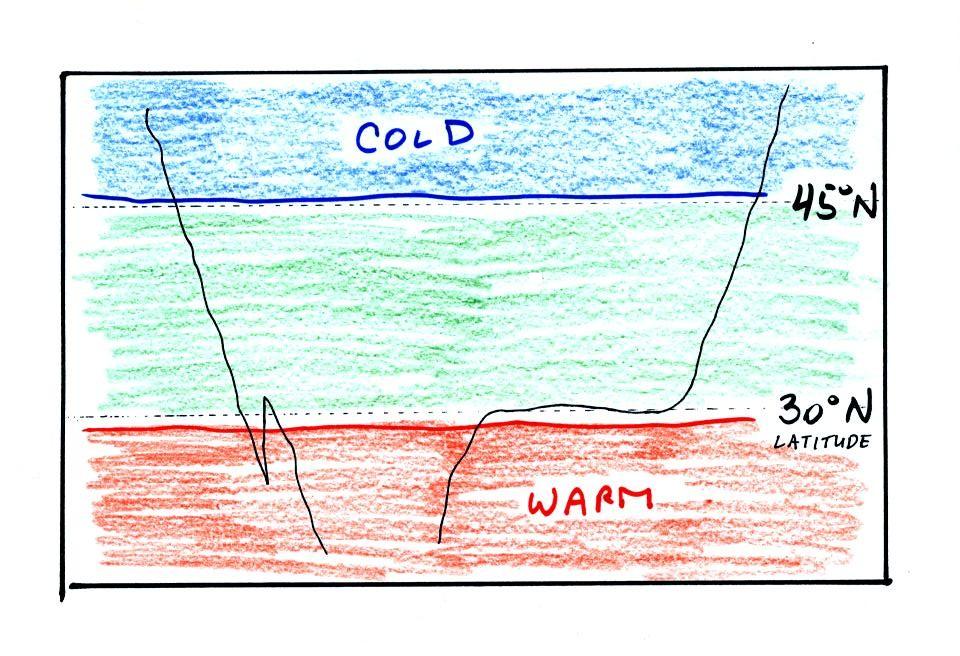
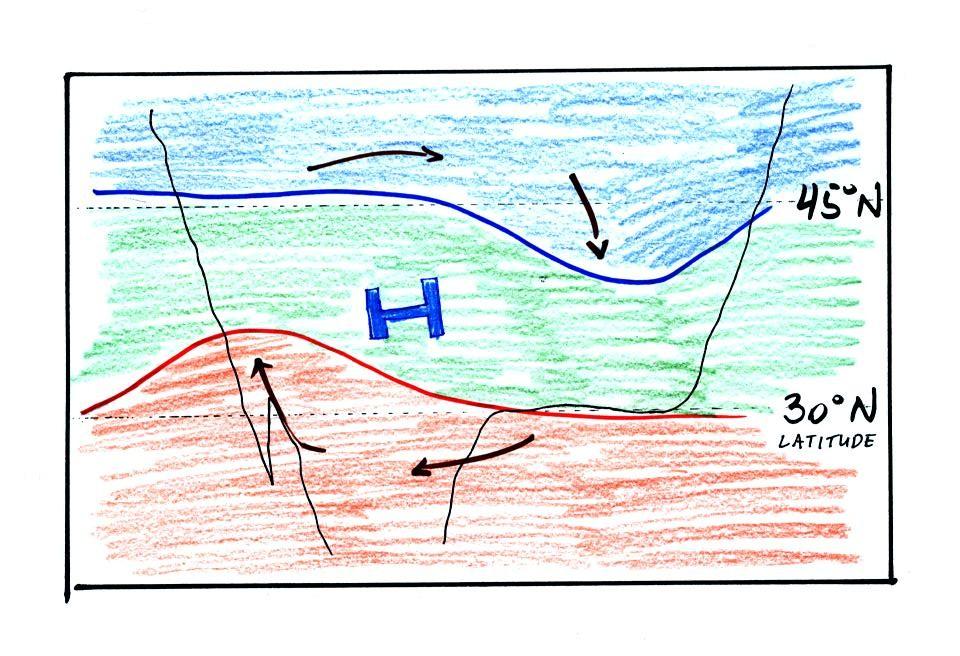
the temperature pattern. The figure below shows the
temperature pattern you would
expect to see if the wind wasn't blowing at all or if the wind was
just blowing straight from west to east. The bands of different
temperature are aligned parallel to the lines of latitude.
Temperature changes from south to north but not from west to
east.
This
picture
gets a
little
more interesting if you put centers of high or low pressure in the
middle.
The clockwise spinning winds
move warm air to
the north on
the western
side of the High. Cold air moves toward the south on the eastern
side of the High. The diverging winds also move the warm and cold
air away from the center of the High. Now you would experience a
change in temperature if you traveled from west to east across the
center of the picture.
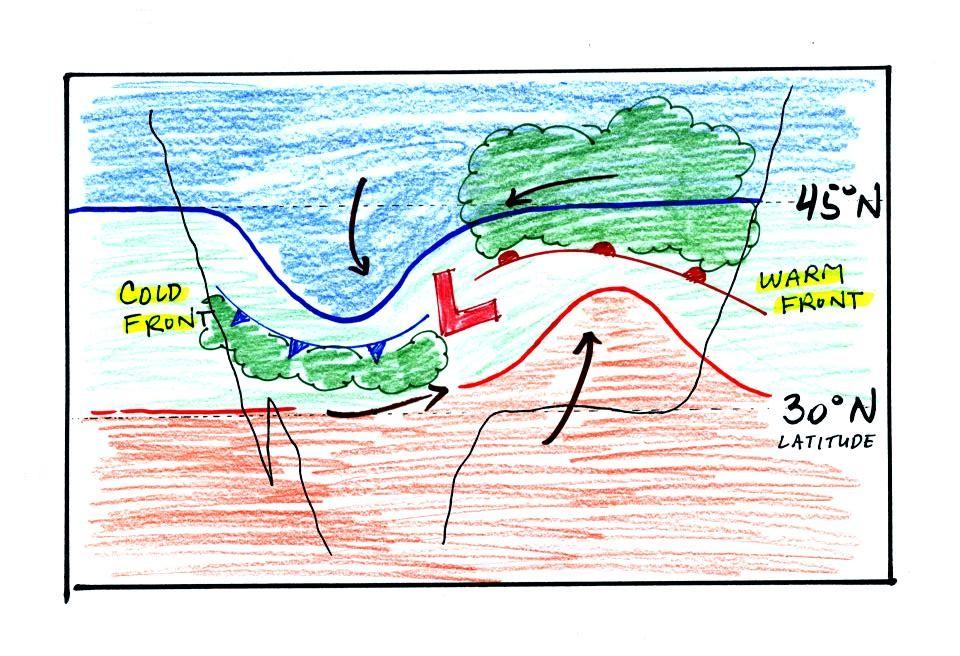
Counterclockwise winds move cold
air toward the south
on the
west side
of the Low. Warm air advances toward the north on the eastern
side of the low.
The converging winds in the case of low pressure will move the air
masses of different temperature in toward the center of low pressure
and cause them to collide with each other. The boundaries between
these colliding air masses are called fronts. Fronts are a second
way
of causing rising air motions (that's important because rising air
expands and cools, if the air
is moist clouds can form).
Cold air is moving from north toward the south on the
western side of
the low. The leading edge of the advancing cold air mass is a
cold front. Cold fronts are drawn in blue on weather maps.
The small triangular symbols on the side of the front identify it as a
cold front and show what direction it is moving. The fronts are
like spokes on a wheel. The "spokes" will spin counterclockwise
around the low pressure center (the axle).
A warm front (drawn in red with half circle symbols) is shown on
the
right hand side of the map at the advancing edge of warm air. It
is also rotating counterclockwise around the Low.
Here's
something I forgot to mention in class. The storm system
shown in the picture above (the Low together with the fronts) is
referred to
a middle latitude storm or an extratropical cyclone
(extra tropical means outside the tropics, cyclone means winds spinning
around low pressure). These storms form at middle latitudes
because that is where air masses coming from the polar regions to the
north and the more tropical regions to the south can collide.
You mostly just find warm air in the tropics. Large
storms also
form there; they're called tropical cyclones or, in our part of the
world, hurricanes.
Clouds can form along fronts (often
in a fairly narrow band along
a
cold front and over a larger area ahead of a warm front). We need
to look at the crossectional structure of warm and cold fronts to
understand better why this is the case.
The top picture below shows a crossectional
view of a cold front

At the top of the figure, cold
dense air on the left is
advancing into
warmer lower density air
on the right. We are looking at the front advancing edge of the
cold air
mass, note the blunt shape. The front edge of the cold
air mass "bunches up" because of friction as it moves across the
ground. The warm low density air is lifted
out of the way
by the cold air. The warm air is rising.
The lower figure shows an analogous situation, a big heavy
Cadillac
plowing into a bunch of
Volkswagens. The VWs are thrown up into the air by the Cadillac.
We watched a couple of short video segments at this point.
The
first used colored liquids with slightly different densities (a
water/glycerin mixture) to show
how a cold air mass can lift a warmer, less dense air mass. The
video
segment also tried to show how warm air overruns a receding mass of
colder denser air. The second video was a time lapse movie of an
actual cold front that passed through Tucson on Easter Sunday, April 4,
in 1999. It actually snowed for a short time during the passage
of the cold front. Click here
to see the cold front video (it may take a minute or two to transfer
the data from the server computer in the Atmospheric Sciences Dept., be
patient). Remember the video shows a time
lapse movie of the frontal passage. The front seems to race
through Tucson in the video, it wasn't moving as fast as the video
might lead you to believe. Cold fronts typically move 15 to 25
MPH.
On Monday we'll look at the structure of warm fronts. We'll
then learn about some of the weather changes that occur during passage
of a warm or cold front. We'll also learn how to locate fronts on
a surface weather map.
Because today is the Fall Equinox
we really need to spend a few minutes discussing some of the unusual
things that happen
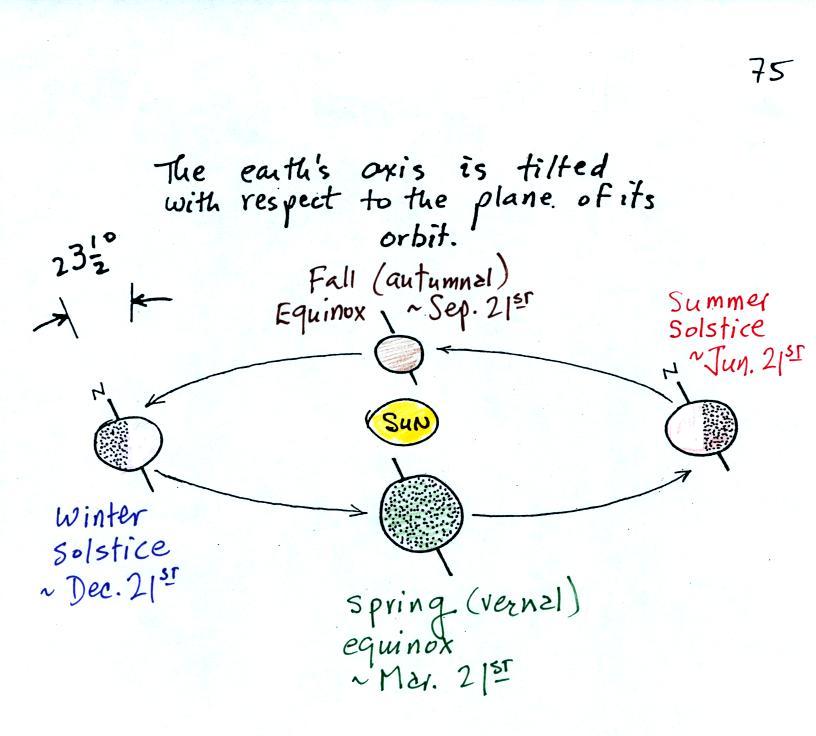
The figure above (perhaps a little
clearer version than was shown in class) shows the earth orbiting the
sun.
On
or
around Dec. 21st, the winter solstice, the north pole is tilted away
from the sun. Note that a small portion of the earth near the N.
Pole (north of the Arctic Circle) spends 24 hours in darkness.
Days are less than 12 hours long in the northern
hemisphere and the sun is low in the sky. Both factors reduce the
amount of sunlight energy reaching the ground.
On June 21st, the
summer solstice, the north pole is tilted toward the sun. Now
there are 24 hours of sunlight north of the Arctic Circle. Days
are more than 12 hours long in the northern hemisphere and the sun is
high in the sky at noon. A lot more sunlight energy reaches the
ground; that's why it is summer.
The equinoxes are a time of transition. On the equinoxes,
the N. Pole is not pointed toward or away from the sun. The line
separating day and night passes through the pole and the days
and nights are each 12 hours long everywhere on earth (except perhaps
at
the poles). On the equinoxes, the sun rises exactly in the east
and
sets
exactly in the
west. The picture below shows the position of the sun at sunrise
(around 6:30 am on the spring and fall equinox in Tucson).
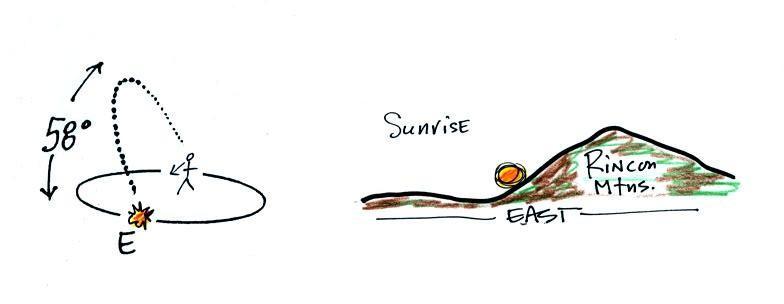
The figure
at left
traces out the path will follow in
the sky on the equinox. The sun rises in the east, exactly in the
east. The picture at right gives you an idea of what you'd see if
you looked east at sunrise (I was out on my bicycle this morning at
sunrise)
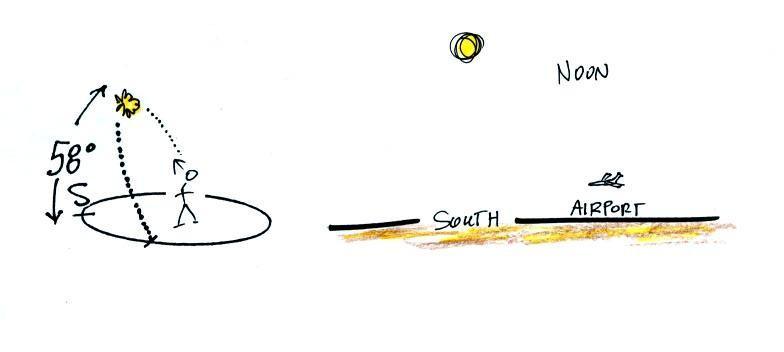
At noon you need
to look south and about 60 degrees
above the
southern
horizon to see the sun. The sun is lower in the sky (34.5 degrees
above the horizon) on the winter solstice in Tucson and much
higher
(81.5
degrees
above
the
horizon,
nearly
overhead) at noon on the summer solstice.
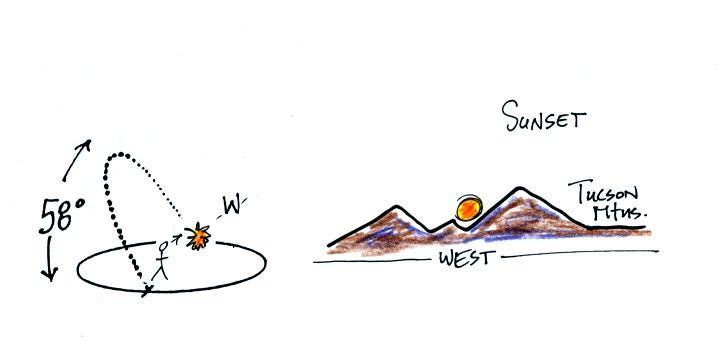
On the equinoxes the sun sets
exactly in the west at
about 6:30 pm, something I plan to check out from a vantage point on
University Ave. later today.
This is the 2 pm class.
Most of you are more likely
(perhaps) to see the sun set than see the
sun
rise. The figure below shows you about what you would see if you
looked west on Speedway (from Treat Ave.) at sunset. In the
winter the sun will set south of west, in the summer north of west
(probably further south and north than shown here). On the
equinoxes the sun sets exactly in the west.
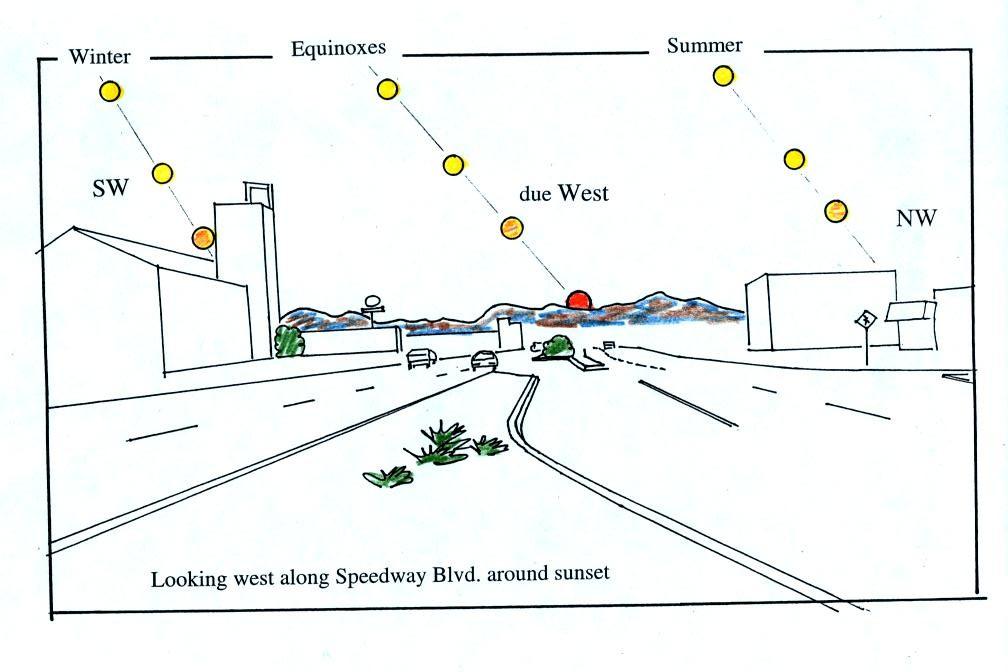
Several years ago I
positioned myself in the median near the
intersecton of Treat and Speedway and pointed my camera west. I
took a multiple exposure photograph of the sun over a 2 hour period
that ended at sunset. I'll bring the slide photograph to
class one of these days.
Something else to note in this figure and something I didn't
mention in class. Note how the sun is changing
color. It changes from a bright yellow white to almost red by the
time it sets.. This is due to scattering of sunlight by
air. The shorter wavelengths (violet, blue, green) are scattered
more readily than the longer wavelengths. At sunset the rays of
sunlight take a much longer slanted path through the atmosphere and
most of the shorter wavelengths are scattered and removed from the beam
of sunlight.
If you aren't
careful, you can get yourself seriously
injured,
even
killed,
on
or around the equinoxes. Here's
an article that appeared in the Arizona Daily Star Thursday (Sep. 22).
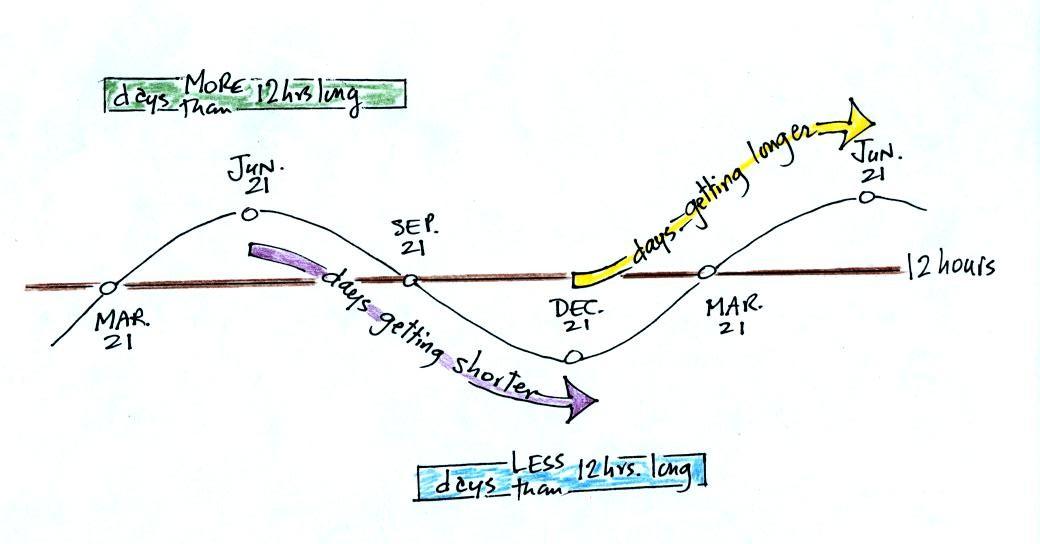
June 21, the
summer solstice, is the longest
day
of the
year (about 14 hours of daylight in Tucson). The days have slowly
been getting shorter since then. The rate of change is greatest at the
time of the equinox.
This will continue up until December
21,
the winter solstice, when there will be about 10 hours of
daylight. After that the days will start to lengthen as we make
our way back to
the summer solstice.
