Thursday Sep. 13, 2012
click here to download today's notes in a more printer friendly format

Some mariachi music to celebrate Mexican Independence Day (from Spain) coming up this weekend (Sept. 16).  You heard Cancion del Mariachi (3:27), El Cascabel (7:05), and El Picador (World Drifts In) (2:47).  Not nearly enough time for  Crystal Frontier (9:13) but you can listen to it on your own if you want (and meet all the muscians).  All of these videos were recorded at the  Barbican Theater in London in 2002.

Quiz #1 is Thursday next week (Sept. 20) and the Quiz #1 Study Guide is now online.  Quiz #1 will also cover material on the Practice Quiz Study Guide.  Note that there is now an additional review scheduled for next week: Tuesday afternoon (Sept. 18) from 2 - 2:50 pm in Saguaro Hall 225.

A take home Optional Assignment was collected today and an In-class Optional Assignment was handed out in class and collected at the end of class.  If you weren't in class and would like to download the in-class assignment, answer the questions, and turn it in at the start of class next Tuesday you can earn at least partial credit.

The Experiment #1 reports are due next Tuesday.  If you haven't returned the materials you can bring them by my office and leave them in the box just inside the door.  You'll find copies of the Supplementary Information handout nearby.


First though a couple of examples involving the ideal gas law to refresh your memory and allow you can see how changing one or more of the variables can affect pressure.


A can of spray paint is a sealed rigid container.  That means N (number of gas molecules) and V (volume) stay constant.  Heating up a can of spray paint (something you shouldn't do) will increases the temperature and increase the pressure.  If the pressure gets too high the can will explode.

In this next example we add some air to a tire.

In this case the volume, V, and the temperature of the air, T, remain constant.  But we are adding air so N will increase.  This causes pressure to increase.


We're working at understanding why warm air rises and cold air sinks.  The ideal gas law was the 1st step. 

Step #2 Charles' Law

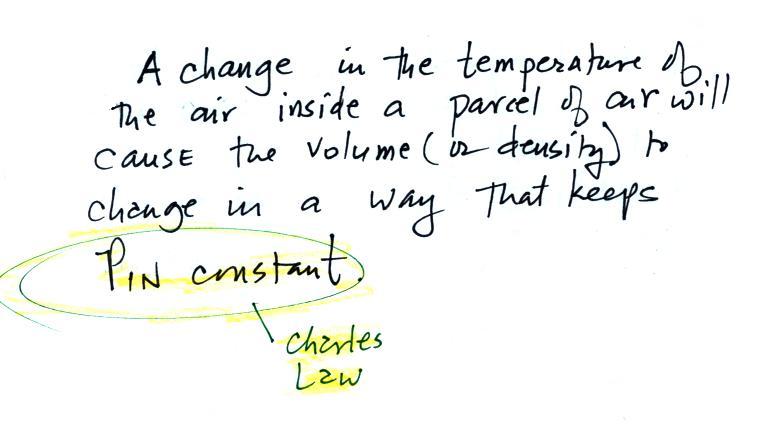
In Charles Law we assume that the pressure of a parcel of air will remain constant (parcel is just another word for volume).  Changing the temperature of a volume of air will cause a change in density and volume and pressure will stay constant.  This is an important situation because this is how 
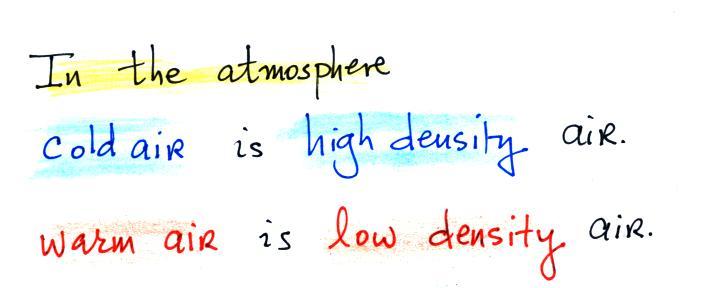
volumes of air in the atmosphere behave.

The explanation below is a little more detailed and more carefully illustrated version of what was done in class.


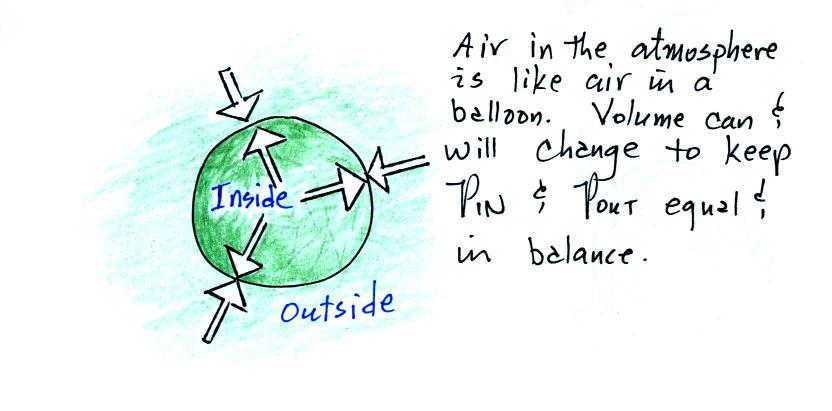
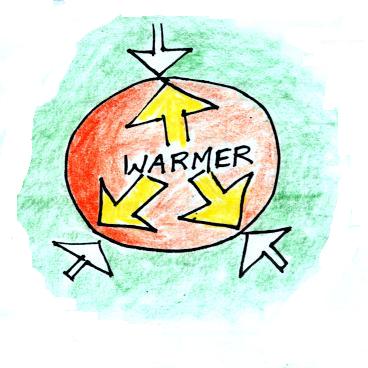
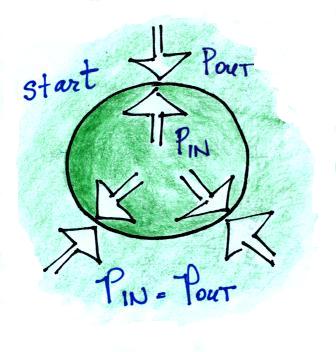
We start with a balloon of air.  The air inside and outside the balloon (or parcel) are exactly the same. 

Note the pressure pushing inward is balanced by the pressure of the air inside the balloon that is pushing outward.  If we change something inside the balloon that upsets this pressure balance, the balloon would expand or shrink until the pressures were again in balance.


Volumes of air in the atmosphere will always try to keep the pressure of the air inside the parcel constant (P inside is always trying to stay equal to P outside).  That's why we say air in the atmosphere obeys Charles' Law.

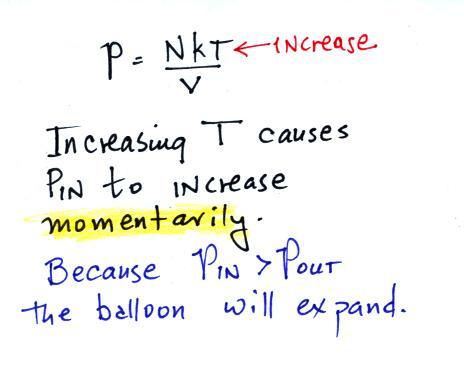
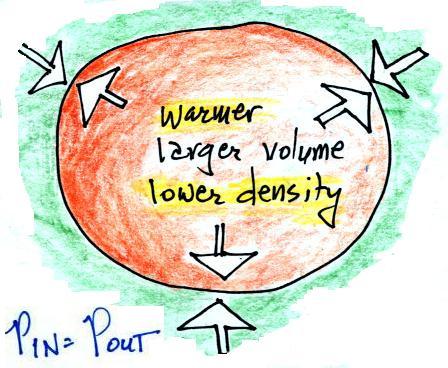
First let's imagine warming the air inside a balloon.  We'll won't change the temperature of the air outside the balloon.


Increasing the temperature will momentarily increase the pressure.  This creates an imbalance.  Now that P inside is greater than P outside the balloon will expand.


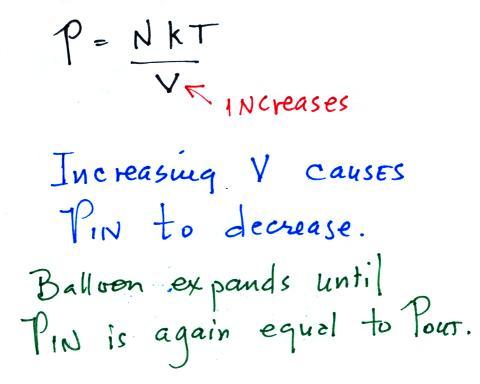
Increasing the volume causes the pressure to start to decrease.  The balloon will keep expanding until P inside is back in balance with P outside. 

We're left with a balloon that is larger, warmer, and filled with lower density air than it was originally. 


The pressures inside and outside are again the same.  The pressure inside is back to what it was before we warmed the air in the 
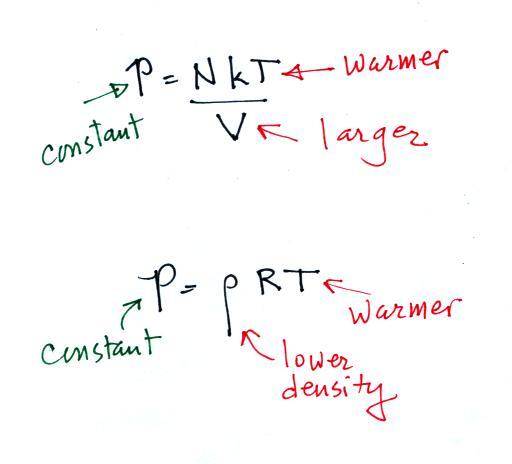
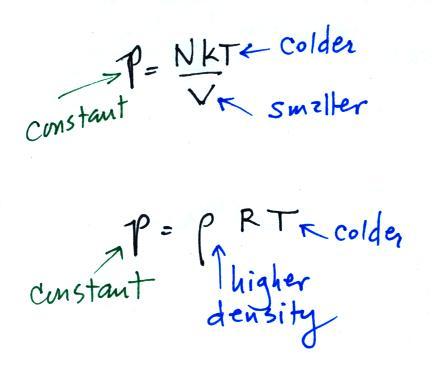
balloon.  You can increase the temperature and volume of a parcel together in a way that keeps pressure constant (which is what Charles' law requires).  Or you can increase the temperature and decrease the density together and keep the pressure constant.l


We can go through the same kind of reasoning and see what happens if we cool the air in a parcel.  I've included all the steps below; that wasn't done in class.


We'll start with a parcel of air that has the same temperature and density as the air around it.

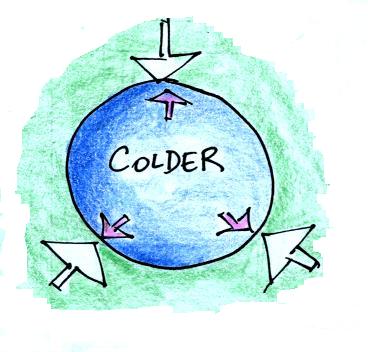
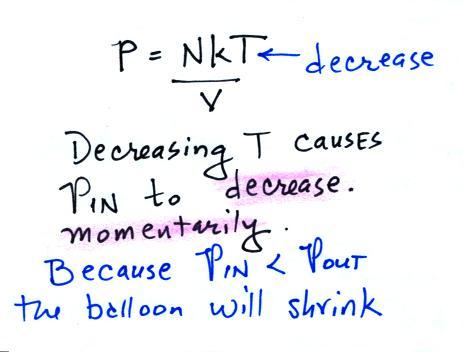
We'll cool the air inside the parcel.  The air outside stays the same.


Reducing the air temperature causes the pressure of the air inside the balloon to decrease.  Because the outside air pressure is greater than the pressure inside the balloon the parcel is compressed.


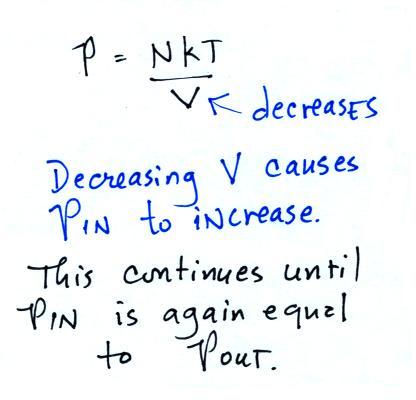
The balloon will get smaller and smaller (and the pressure inside will get bigger and bigger) until the 
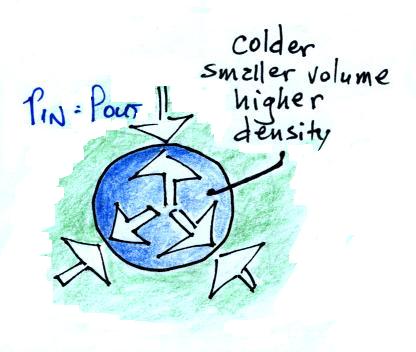
pressures inside and outside the balloon are again equal.  The pressure inside is back to the value it had before you cooled the air in the parcel.


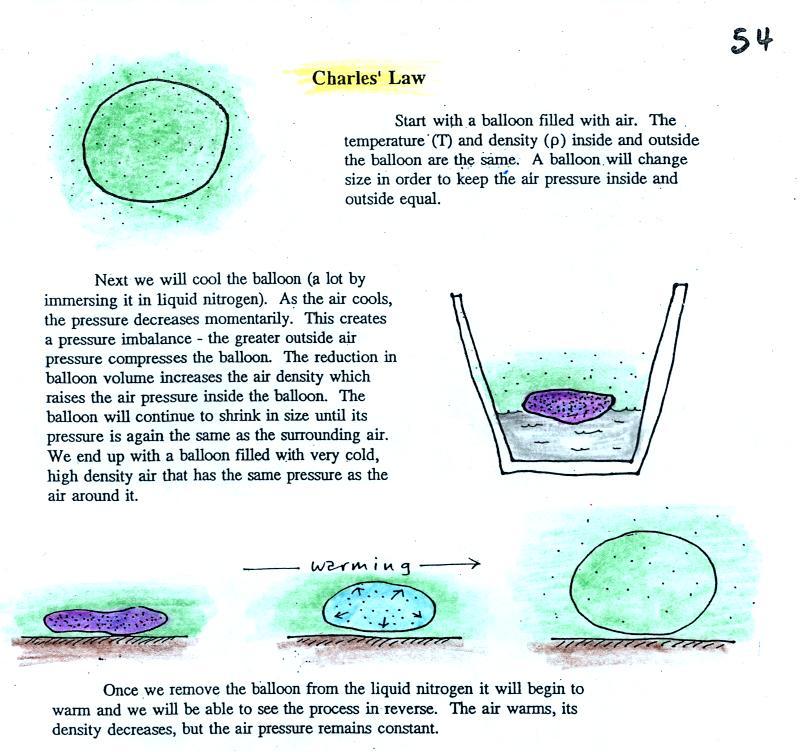
If you want to skip all the details and just remember one thing, here's what I'd recommend (a statement that I didn't show in class)


Charles Law can be demonstrated by dipping a balloon in liquid nitrogen.  You'll find an explanation on the top of p. 54 in the photocopied ClassNotes.


The balloon shrinks down to practically nothing when dunked in the liquid nitrogen.  It is filled with very cold, very high density air.  When the balloon is pulled from the liquid nitrogen and starts to warm up it expands.  Density in the balloon decreases.  The volume and temperature keep changing in a way that kept pressure constant (pressure inside the balloon is staying equal to the air pressure outside the balloon).  Eventually the balloon ends up back at room temperature (unless it pops while warming up).


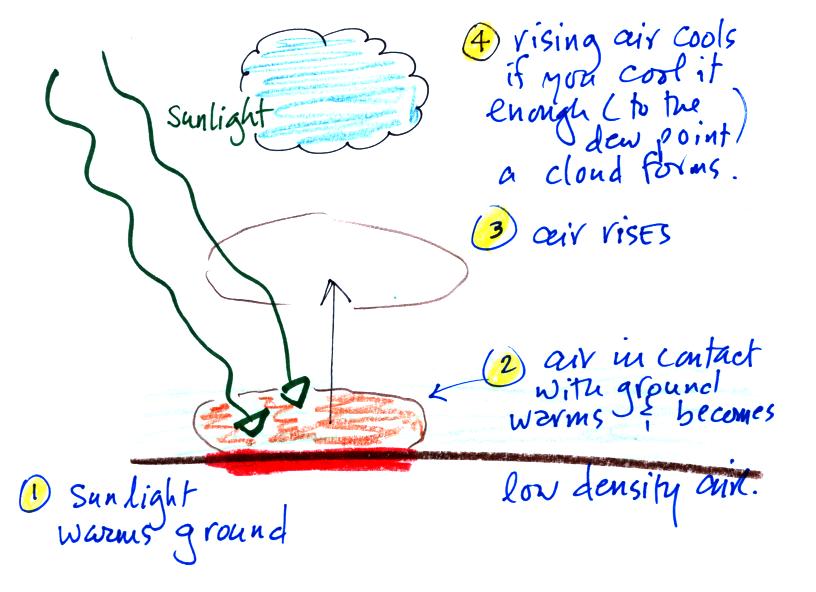
Step #3 Vertical forces acting on parcels of air

And finally the last step toward understanding why warm air rises and cold air sinks.  We'll have a look at the forces that act on parcels of air in the atmosphere.
  This information is found on p. 53 in the photocopied ClassNotes.


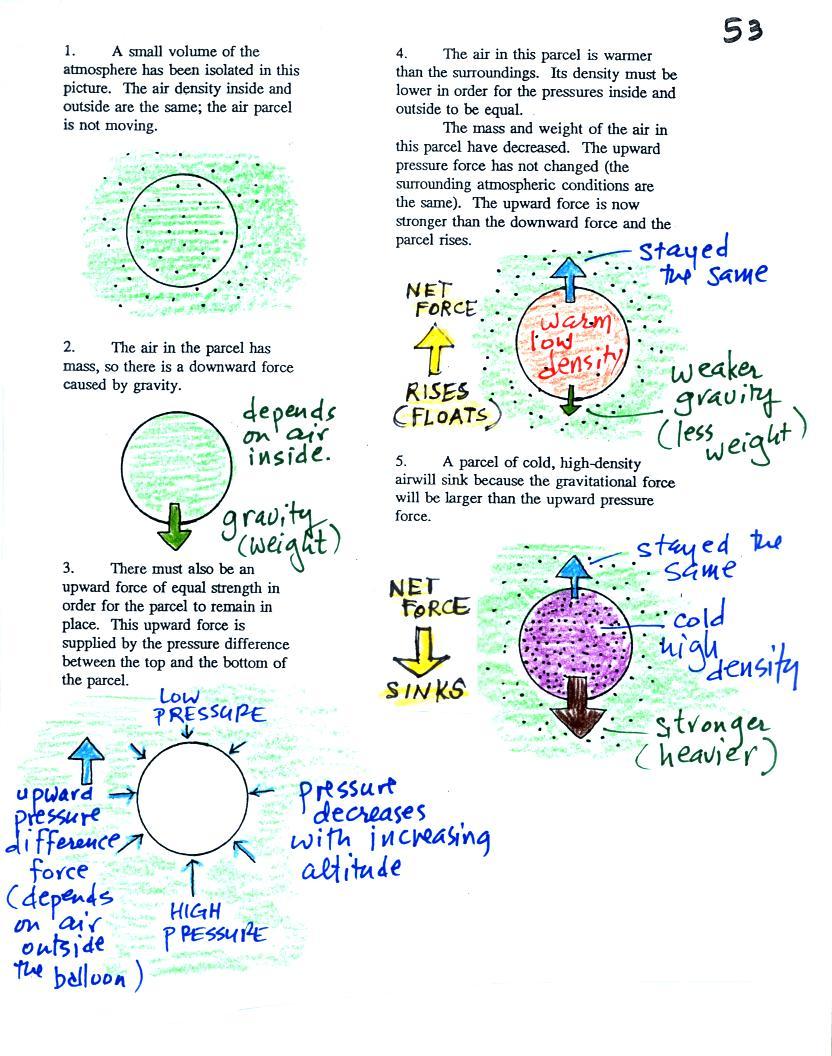
Basically it comes down to this - there are two forces acting on a parcel of air in the atmosphere. 
They are shown on the left hand side of the figure above.

First is gravity, it pulls downward.  The strength of the gravity force (the weight of the air in the parcel) depends on the mass of the air inside the parcel. 


Second there is an upward pointing pressure difference force.  This force is caused by the air outside (surrounding) the parcel.  Pressure decreases with increasing altitude.  The pressure of the air at the bottom of a parcel pushing upward is slightly stronger than the pressure of the air at the top of the balloon that is pushing downward.  The overall effect is an upward pointing force.


When the air inside a parcel is exactly the same as the air outside, the two forces are equal in strength and cancel out.  The parcel is neutrally bouyant and it wouldn't rise or sink, it would just sit in place.

Now have a look at the right hand side of the figure.
If you replace the air inside the balloon with warm low density air, it won't weigh as much.  The gravity force is weaker.  The upward pressure difference force doesn't change (because it is determined by the air outside the balloon which hasn't changed) and ends up stronger than the gravity force.  The balloon will rise.

Conversely if the air inside is cold high density air, it weighs more.  Gravity is stronger than the upward pressure difference force and the balloon sinks.

It all comes down to how the density of the in parcel compares to the density of the air surrounding the parcel.  If the parcel is filled with low density air it will rise.  A parcel full of high density air will sink.


We did a short demonstration to show how density can determine whether an object or a parcel of air will rise or sink.  We used balloons filled with helium (see bottom of p. 54 in the photocopied Class Notes).  Helium is less dense than air even when it has the same temperature as the surrounding air.  A helium-filled balloon doesn't need to warmed up in order to rise.


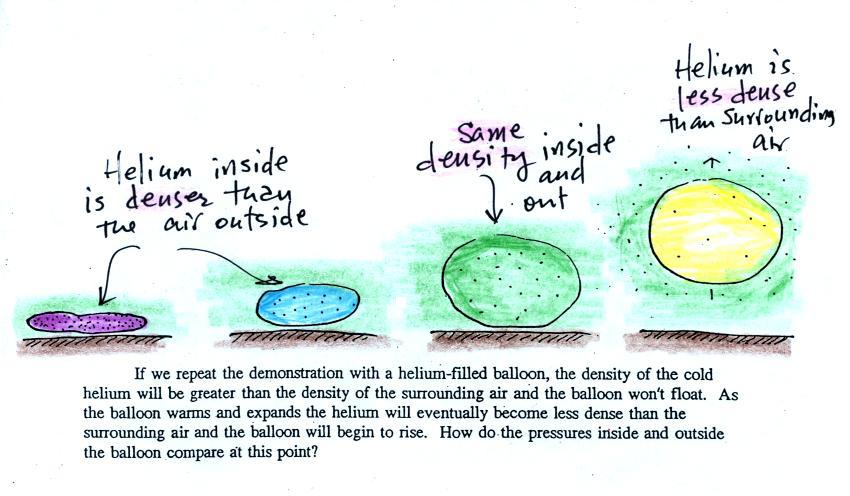
We dunked the helium-filled balloon in some liquid nitrogen to cool it and to cause the density of the helium to increase.  When removed from the liquid nitrogen the balloon didn't rise, the gas inside was denser than the surrounding air (the purple and blue balloons in the figure above).  As the balloon warms and expands its density decreases.  The balloon at some point has the same density as the air around it (green above) and is neutrally bouyant (it's still cooler than the surrounding air).  Eventually the balloon becomes less dense that the surrounding air (yellow) and floats up to the ceiling (which in ILC 150 is about 30 feet high)


Something like this happens in the atmosphere. 


Sunlight shines through the atmosphere.  Once it reaches the ground at (1) it is absorbed and warms the ground.  This in turns warms air in contact with the ground (2)  As this air warms, its density starts to decrease.  When the air density is low enough, small "blobs" of air separate from the air layer at the ground and begin to rise, these are called "thermals."  (3) Rising air expands and cools (we've haven't covered this yet and it might sound a little contradictory).  If it cools enough (to the dew point) a cloud will become visible as shown at Point 4.  This whole process is called free convection; many of our summer thunderstorms start this way.


Time now to start another a new block of material today - surface and upper-level weather maps.  We began by learning how weather data are entered onto surface weather maps.

Much of our weather is produced by relatively large (synoptic scale) weather systems - systems that might cover several states or a significant fraction of the continental US.  To be able to identify and characterize these weather systems you must first collect weather data (temperature, pressure, wind direction and speed, dew point, cloud cover, etc) from stations across the country and plot the data on a map.  The large amount of data requires that the information be plotted in a clear and compact way.  The station model notation is what meterologists use.


A small circle is plotted on the map at the location where the weather measurements were made.  The circle can be filled in to indicate the amount of cloud cover.  Positions are reserved above and below the center circle for special symbols that represent different types of high, middle, and low altitude clouds.  The air temperature and dew point temperature are entered to the upper left and lower left of the circle respectively.  A symbol indicating the current weather (if any) is plotted to the left of the circle in between the temperature and the dew point; you can choose from close to 100 different weather symbols (on a handout distributed in class).  The pressure is plotted to the upper right of the circle and the pressure change (that has occurred in the past 3 hours) is plotted to the right of the circle. 

We worked through this material one step at a time (refer to p. 36 in the photocopied ClassNotes).  Some of the figures below were borrowed from a previous semester or were redrawn and may differ somewhat from what was drawn in class.


The center circle is filled in to indicate the portion of the sky covered with clouds (estimated to the nearest 1/8th of the sky) using the code at the top of the figure (which you can quickly figure out).  3/8ths of the sky is covered with clouds in the example above.


Then symbols are used to identify the actual types of high, middle, and low altitude clouds observed in the sky.  Positions are reserved above the center circle for high and middle altitude clouds.  A symbol for low clouds (if present) goes below the center circle.  Later in the semester we will learn the names of the 10 basic cloud types.  Six of them are sketched above and symbols for them are shown. 

A complete list of cloud symbols was on a handout distributed in class (a copy can be found here ) You do not, of course, need to remember all of the cloud symbols.


A straight line extending out from the center circle shows the wind direction.  Meteorologists always give the direction the wind is coming from In this example the winds are blowing from the NW toward the SE at a speed of 5 knots.  A meteorologist would call these northwesterly winds. 

Small barbs at the end of the straight line give the wind speed in knots.  Each long barb is worth 10 knots, the short barb is 5 knots.  Knots are nautical miles per hour.  One nautical mile per hour is 1.15 statute miles per hour.  We won't worry about the distinction in this class, we will just consider one knot to be the same as one mile per hour.


Here are four more examples.  What is the wind direction and wind speed in each case.  Click here for the answers.

The air temperature and the dew point temperature are probably the easiest data to decode.


The air temperature in this example was 64o F (this is plotted above and to the left of the center circle).  The dew point temperature was 39o F and is plotted below and to the left of the center circle.  The box at lower left reminds you that dew points range from the mid 20s to the mid 40s during much of the year in Tucson.  Dew points rise into the upper 50s and 60s during the summer thunderstorm season (dew points are in the 70s in many parts of the country in the summer).  Dew points are in the 20s, 10s, and may even drop below 0 during dry periods in Tucson.

And maybe the most interesting part.


A symbol representing the weather that is currently occurring is plotted to the left of the center circle (in between the temperature and the dew point).  Some of the common weather symbols are shown.  There are about 100 different weather symbols that you can choose from (click here if you didn't get a copy of the handout distributed in class today) There's no way I could expect you to remember all of those weather symbols.