Wed., Feb. 7, 2007
The Optional Assignment was collected at the beginning of class.
Distribution of the Experiment #2
materials began in class today.
A preliminary Quiz #1 Study Guide is now
available online (it probably won't change much between now and early
next week). The quiz next week will cover material on the Practice Quiz Study Guide also.
We will
mostly finish up the material on surface weather maps today.

Here is the surface map we have been analyzing. We have added a
cold and a warm front. Some of the criteria used to located
fronts on maps are listed below.
Criteria used to locate fronts:
1. Temperature changes. Cold air behind a cold front and cold air
ahead of a warm front.
2. Changes in air's moisture content. The air behind a cold front
is often very dry. In Arizona the air ahead of a cold front may
also be dry (in this case there might not be many clouds as the front
passes through).
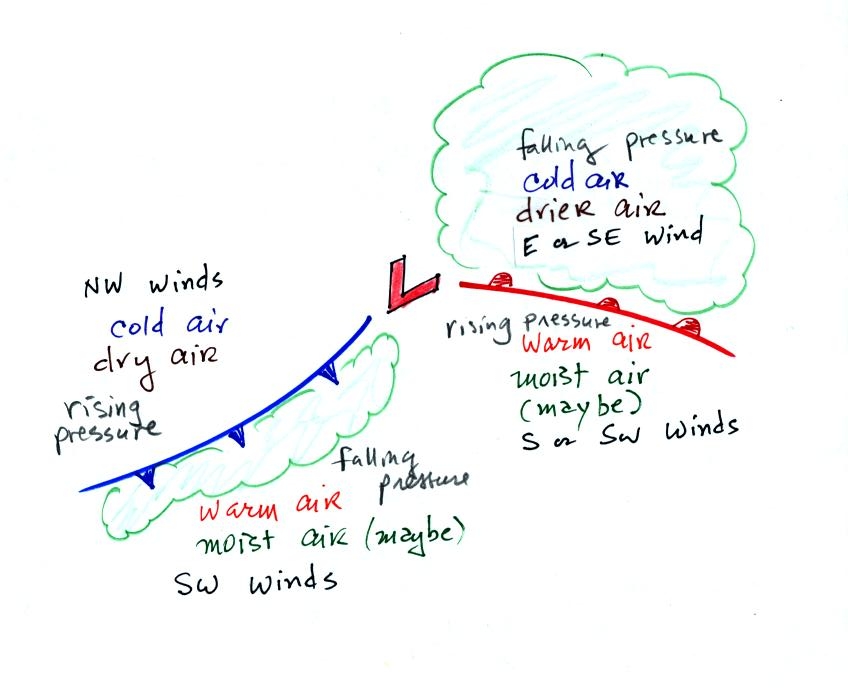
3. Shift in wind direction. Winds typically change from
southwesterly ahead of an approaching cold front and become
northwesterly once the front passes. It makes sense that the warm
air ahead of the cold front is coming from the south. Cold air
behind the front comes from the north. Winds generally turn from
easterly or southeasterly ahead of a warm front to southerly or
southwesterly after the front has passed through.
4. Pressure changes. Pressure falls ahead of approaching warm and
cold fronts. Pressure begins to rise once the fronts have passed
through.
5. Clouds and precipitation. If clouds from along a cold
front they often form in a fairly narrow band (the warm air is pushed
up suddenly by the relatively fast moving cold front). That is
not to say that they won't produce much rain; the clouds could be
strong thunderstorms and could produce severe weather. The warm
air rises more gradually with warm front and the clouds and
precipitation usually cover a larger area.
Storms like these (a low pressure center with fronts) is are called
middle latitude storms or extratropical
cyclones. They form at middle latitudes because that is where
warm air and cold air can collide.
Hurricanes form at lower latitudes (subtropics) and are called tropical
cyclones.
The term cyclone refers to winds spinning around low pressure.
The term anticyclone is often used to refer to a center of high
pressure.
There are
a couple of other fronts that you might see on surface weather
maps. We won't cover them in much detail here.
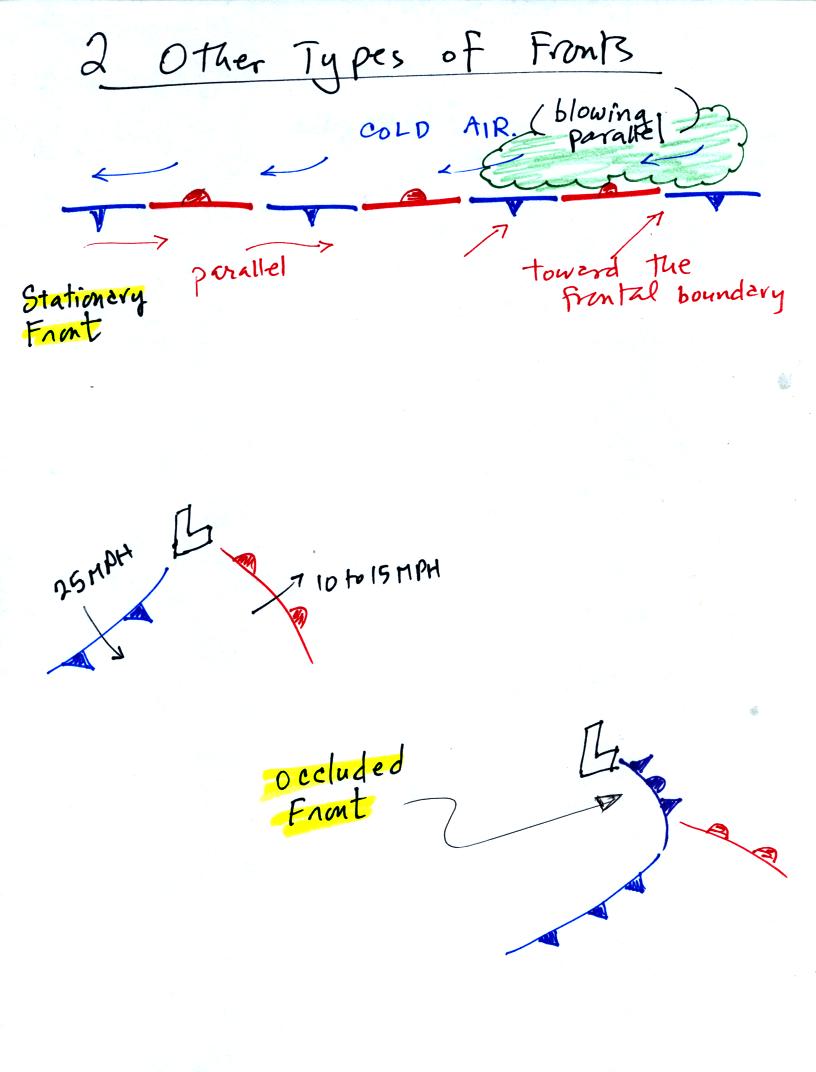
Stationary fronts don't move. This is because the cold air
on one side of the front is blowing parallel to the front. Note
the warm air can be blowing parallel to the front or toward the
front. In the latter case the warm air will overrun the cold air
and clouds and precipitation can form.
Occluded fronts form when a fast-moving cold front overtakes a slower
warm front.
Next we
will learn a little bit about upper level charts. These maps show
conditions at various altitudes above the ground. Conditions up
there are important because they can strongly influence conditions at
the ground.
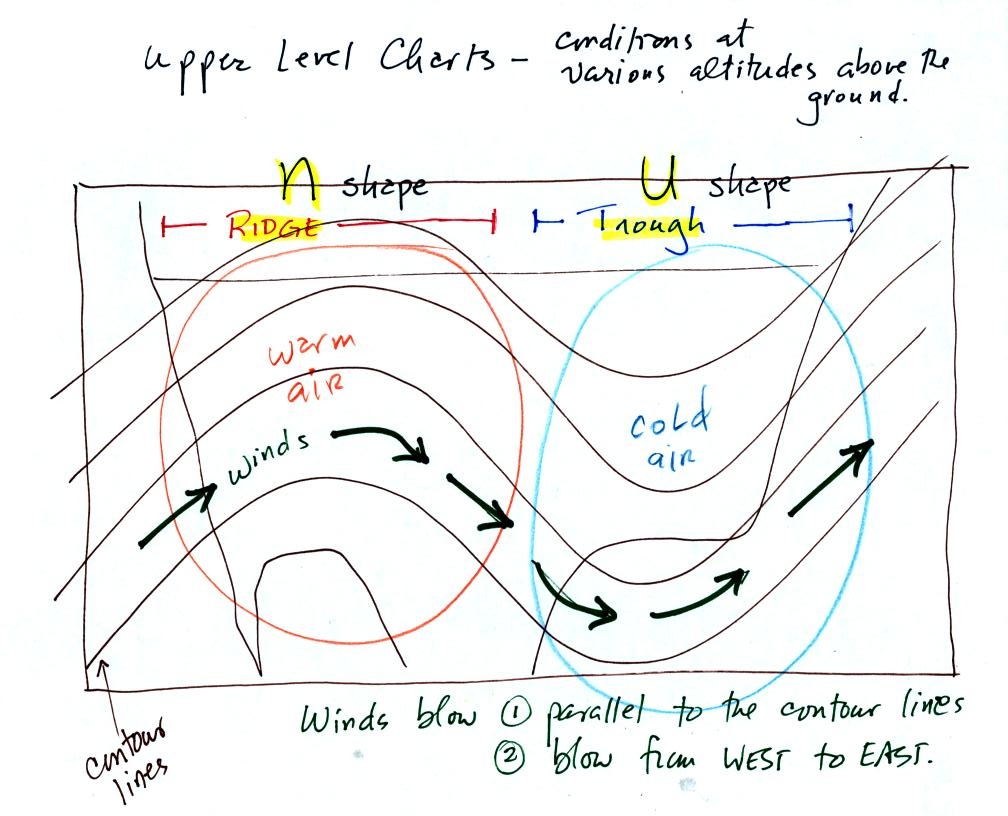
The sketch above shows some of the main features you are likely to see
on an upper level chart.
The contour lines on the left side of the wavy pattern bend northward
and have an "n" shape. This portion of the map is called a
ridge. The air between the ground and this upper level would be
relatively warm.
The contour lines dip southward on the right side of the chart and have
a "u" shape. This is a trough. You would find cold air
between the ground and this upper level in this portion of the
atmosphere.
The upper level winds blow from west to east and blow parallel to the
contour lines (surface winds blow across the contour lines slightly
toward low pressure).
Upper level charts are discussed in much more detail on pps 115-199 in
the photocopied Class Notes.
We will try to understand better where the terms ridge and trough come
from. We'll also understand why ridges are produced by warm air
and troughs are associated with cold air. We will find out that
the contour lines on upper level charts aren't isobars (pressure
contours). What are they? We'll learn why the contour
line values decrease as you move northward.
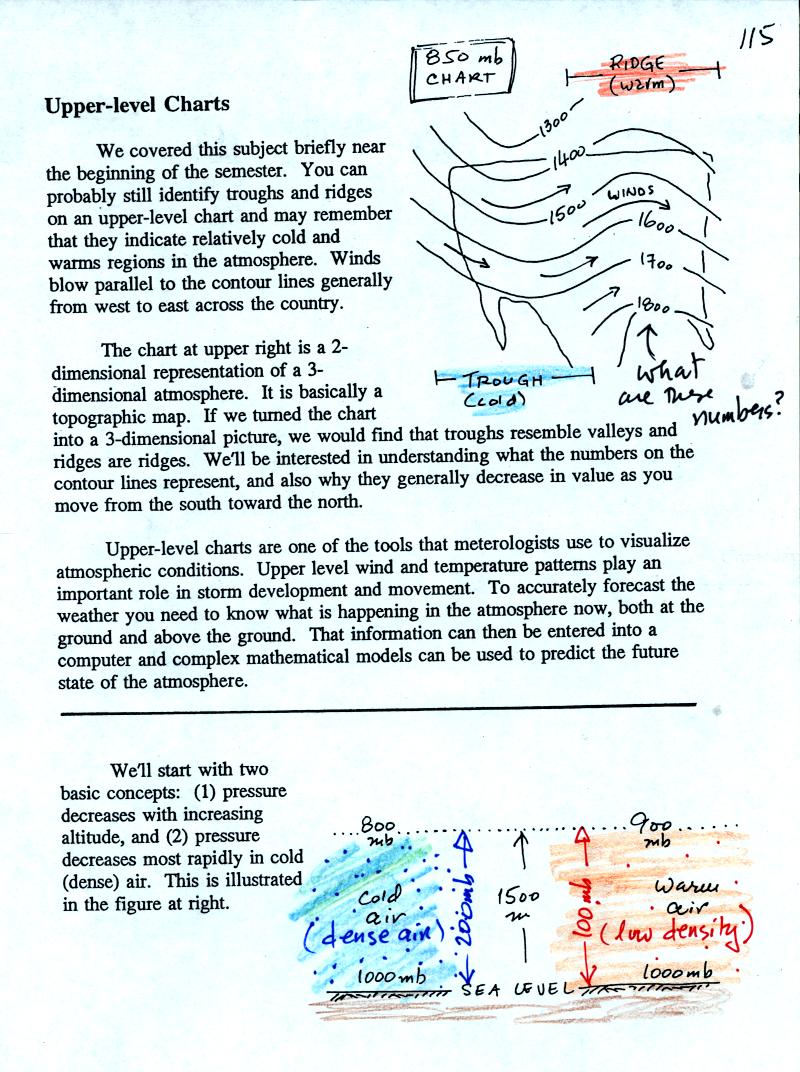
You really only need to remember two things from earlier in the
semester: (1) pressure decreases with increasing altitude, and
(2) pressure decreases rapidly in cold high-density air [it decreases
more slowly with increasing altitude in warm, low-density air].
This is shown at the bottom of the figure above. Pressure drops
from 1000 mb to 800 mb when moving upward 1500 meters in the cold
air. It decreases from 1000 mb to 900 mb in the same distance in
the warm low density air.
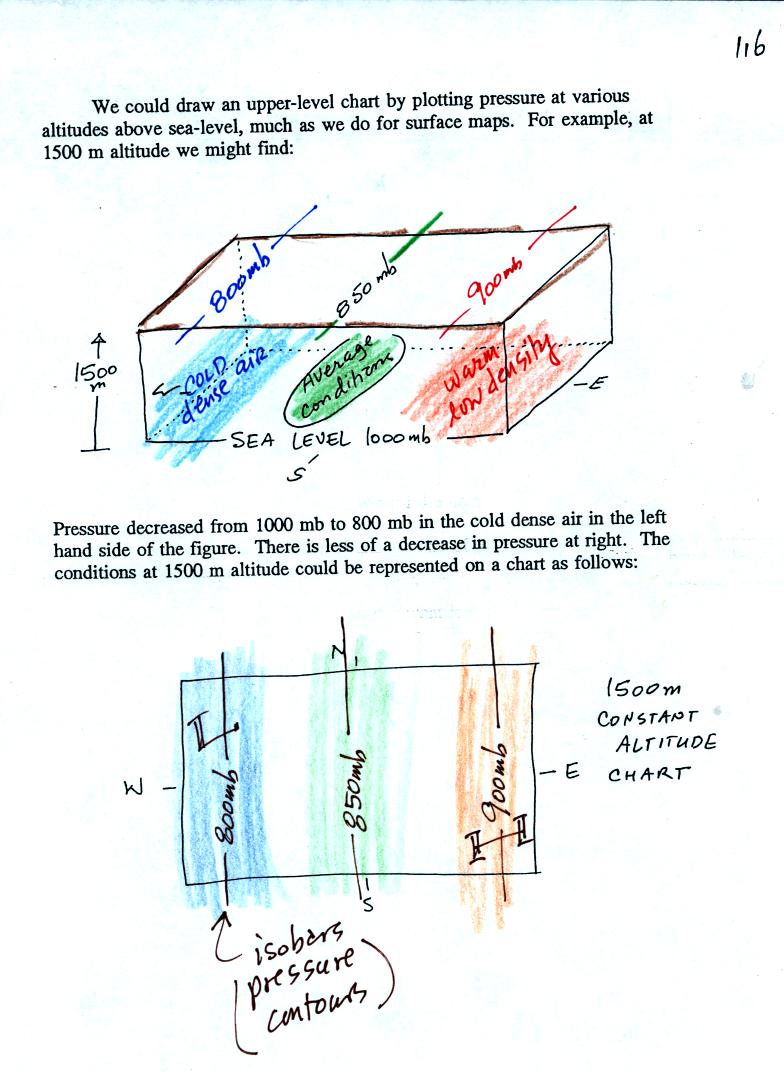
One way of depicting upper level conditions would be
to measure
pressure values at some fixed altitude above the ground. This
approach is shown above. Pressures range from 800 mb to 900 mb at
1500 meters altitude. The
pressure pattern could then be plotted on a constant altitude chart
using isobars. Note the lowest pressures are found in the
cold air, higher pressures would be found in the warm air.
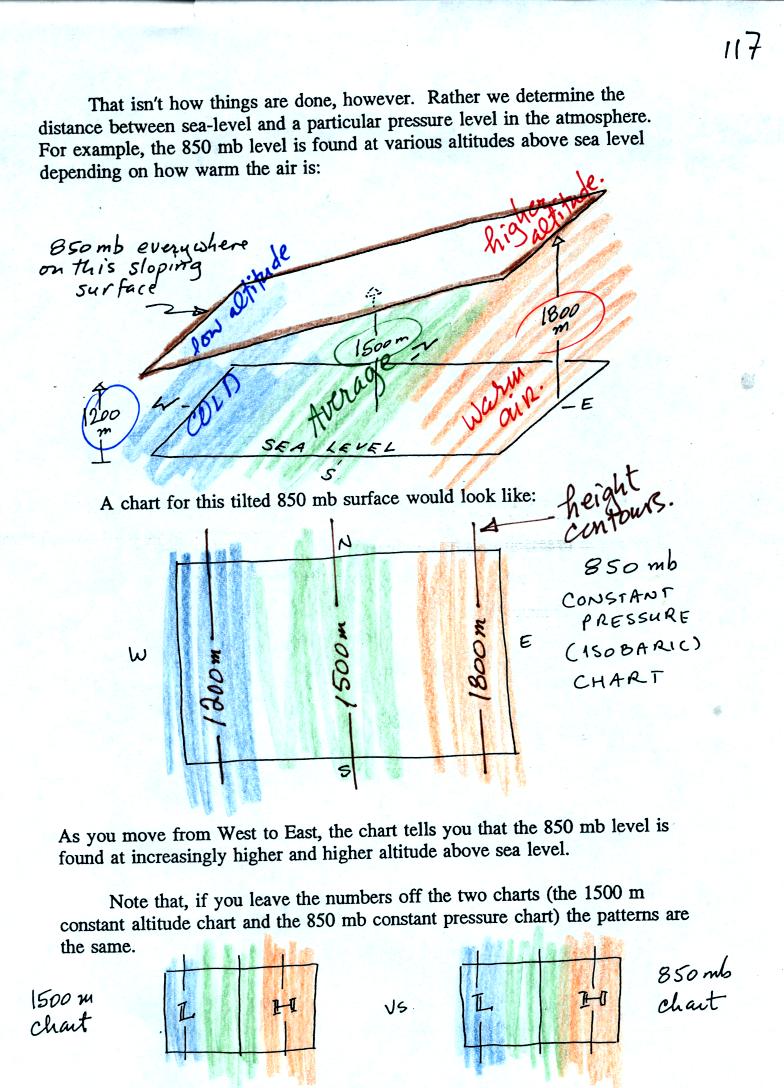
Just to make life difficult for NATS 101 students meterologists do
things differently. Rather than plotting conditions
at a constant altitude
above the
ground, meterologists measure and plot conditions at a particular
reference pressure level above the ground.
In the picture above starting at 1000 mb at the ground and travelling
upward until you find the pressure has dropped to 850 mb. You
make a note of the altitude at which that occurs. In the cold
dense air pressure decreases rapidly so you wouldn't need to go very
high, only 1200 meters. In the warm air pressure decreases more
slowly, you would have to going higher, to 1800 m.
Every point on the
sloping surface above has the same pressure, 850 mb. The altitude
above the ground is what is changing. You could draw what amounts
to a topographic map of the sloping constant pressure surface by
drawing contour lines of altitude or height.
Note that the two charts (constant altitude or constant pressure) have
the same overall pattern (they should they're both depicting the same
upper level atmospheric conditions.
This is where we were forced to
end class on Wednesday. But these
are the online notes. We're not under the same constraints here.
In the example above temperature changed smoothly from cold to warm as
you move from left to right (west to east).
See if you can figure out what temperature pattern is producing the
wavy 850 mb constant pressure surface below.
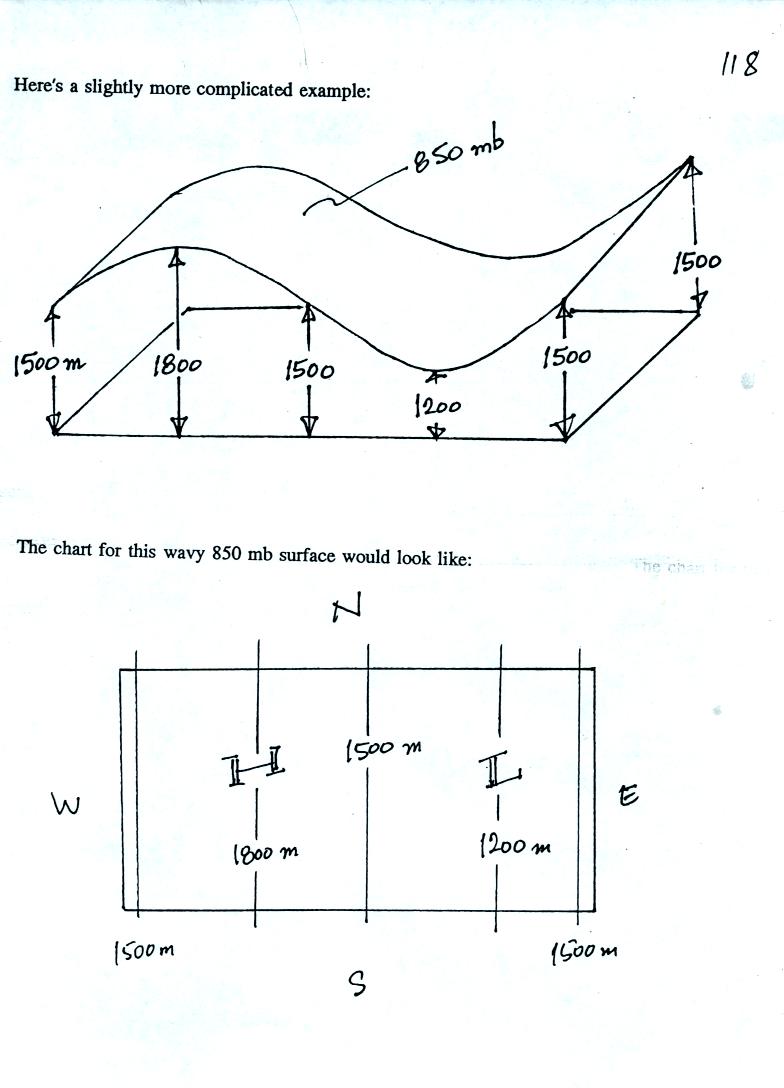
It shouldn't be too hard if you remember that the 850 mb level will be
found at relatively high altitude in the warm air where pressure
decreases slowly with increasing altitude. The 850 mb level will
be found closer to the ground in cold air where pressure decreases
rapidly with increasing altitude. Click here when you think you have
it figured out.
In the next figure we are going to add south to north temperature
changes in addition to the west to east temperature gradient.
Here's what the temperature pattern will look like.
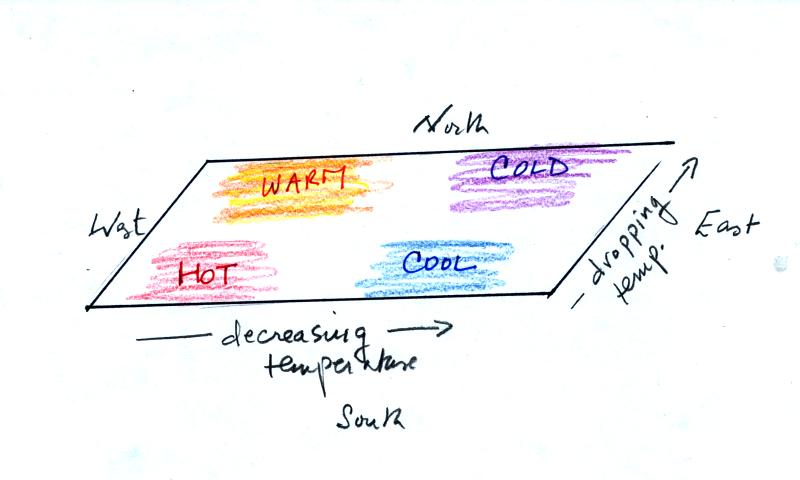
Temperature drops as you move from west to east (as it did in the
previous pictures) and now it drops as you move from south to
north. What will the wavy 850 mb constant pressure surface look
like now? Click here
when you think you know (or if you just want to see the answer and
would rather not think about it).
Here's
another figure with some questions to test your understanding of this
material.
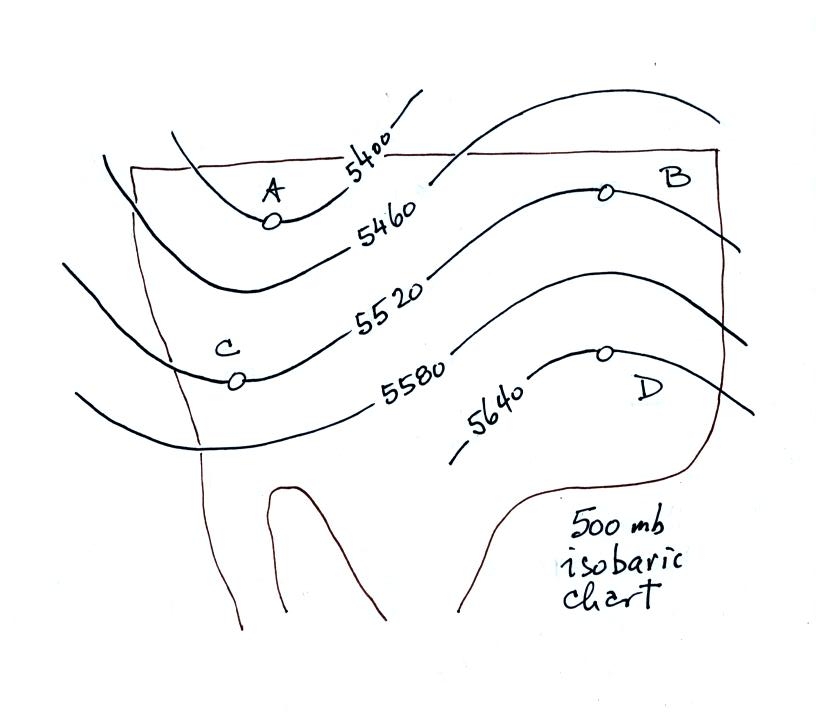
This is a 500 mb constant
pressure chart not an 850 mb chart like in the previous examples.
Is the pressure at Point C greater than, less
than, or equal to the pressure at Point D (you can assume that Points C
and D are at the same latitude)? How do the pressures at Points A
and C compare?
Which of the four points is found at the lowest altitude above the
ground, or are all four points found at the same altitude?
The coldest air would probably be found below which of the four
points? Where would the warmest air be found?
What direction would the winds be blowing at Point C?
Click here for all the
answers.