Tuesday Aug. 26, 2014
Music from Lucius "Until We Get
There" and "Turn It Around"
(learn more about them at www.ilovelucius.com/about/);
Chaos Chaos"Winner"
(www.chaoschaosmusic.com/),
and Au Revoir Simone "The Lead is
Galloping" (www.aurevoirsimone.com/).
Sorry about the interruption in the middle of the Au Revoir Simone
song.
Course Introduction
ATMO 170 is off and running for another semester. We
first briefly discussed the Course
Information handout. Please read through that information
carefully on your own and let me know if you have any
questions.
A textbook is not required for this class. If you want to
get a more complete picture of the subject than we will have time
to do in class, you might want to purchase one of the textbooks
that are being used in the other ATMO 170A1 sections. Or if
you'd like to borrow one of the copies
of introductory level textbooks that I have in my office,
just let me know. Otherwise you should be able to do
perfectly well in the class by reading the online notes. It
is important to read through the online notes even if you are in
class.
A set of photocopied ClassNotes (available in the ASUA
Bookstore in the Student Union) is required. You should try
to purchase a copy as soon as you can because we will probably be
using the first page in class on Thursday. Some changes to
the notes were made over the summer but if you know someone with a
set of ClassNotes from the Fall 2013 or Spring 2014 class they
should work fine this semester also.
Writing is an important part of
this class and is described in more detail on the Writing Requirements handout.
Please have a careful look
at that also and
let me know if you have any questions.
The first half of your writing grade is an experiment
report. You only need to do one of the experiments, so think
about which of the experiments (listed on the handout) you might
like to do. I'll bring a signup sheet to class on
Thursday. I'm also planning on bringing about 45 sets of
materials for the first experiment on Thursday. Materials
checkout is first come first served.
The so-called One Side of One Page (1S1P) reports make up the
second part of your writing grade. Topics will appear
periodically during the semester on the class webpage. As
you write reports you will earn points (the exact number of points
will depend on the topic and the quality of your report).
Your goal should be to earn 45 1S1P pts, the maximum number
allowed, by the end of the semester.
You'll be allowed to revise and raise your grade on the first
draft of your experiment report. So you should be able to
earn a pretty high score on that. And, unless you
procrastinate, you can just keep on writing 1S1P reports until
you've earned 45 points. There's no reason not to earn a
high writing grade.
Grade example
Your final grade in this class will depend on your quiz scores,
how much extra credit you earn (from optional take home and in
class assignments), your writing grade, and (perhaps) your score
on the final exam. A sample grade report from the Fall 2013
class is shown below (the numbers are class averages).
Doe_J
quiz1 -45 (170 pts possible) 73.5% quiz scores
quiz2 -46 (165 pts possible) 72.1%
quiz3 -54 (175 pts possible) 71.2%
quiz4 -48 (180 pts possible) 73.3%
2.4 EC points extra
credit earned on optional assignments
writing scores
writing scores: 34.0 (expt/book report) + 45.0 (1S1P pts)
writing grade: 98.8%
overall averages (prior to the Final
Exam)
average (no quiz scores dropped): 77.8% + 2.4 =
80.2%
average (lowest quiz score dropped): 79.4% + 2.4 = 81.8%
you DO need to take the final exam
27.0 pts missed on the final exam = 73.0%
exam score
overall average is 80.1% (B)
final grade
The 4 quiz grades are shown at the top.
The next entry shows that the average student earned 2.4
points of extra credit points. You will have the opportunity
to earn at least 3 extra credit points.
A score of 34 points on the experiment report and 45 1S1P pts
resulted in a writing percentage grade of 98.8%. There's no
good reason not to end up with a writing score close to 100% (over
even greater than 100%)
The overall average without any quiz scores dropped is shown
next. Since the result, 80.2%, is less than 90.0% the
average student last fall did have to take the final exam
The second average (with the lowest score dropped) is a little
higher, 81.8%.
If you do well on the final exam it will count 40% of
your overall grade (trying to maximize the benefit it can
have). If you don't do so well on the final it only counts
20% (minimizing the damage it can cause). In this example
the final exam score (73 %) was lower than the 81.8% value, so the
final exam only counted 20% and the overall score was 81.0%.
So even though this average student had C grades on all 4 quizzes
and the Final Exam, the student ended up with a B in the
class. That is due largely to the high writing grade and the
fact that the student did have some extra credit points.
Comments about the class
Next a couple of comments about the class from Spring 2014:
comment #1
The important thing is to keep up with material as it's
covered in class. You don't necessarily need to come to
class to do this. You should definitely be reading the
online lecture notes on a regular basis.
comment #2
Don't let concerns like this wait until the end of the
semester. Let me or one of the TAs know of your concerns
so that they can be addressed during the semester.
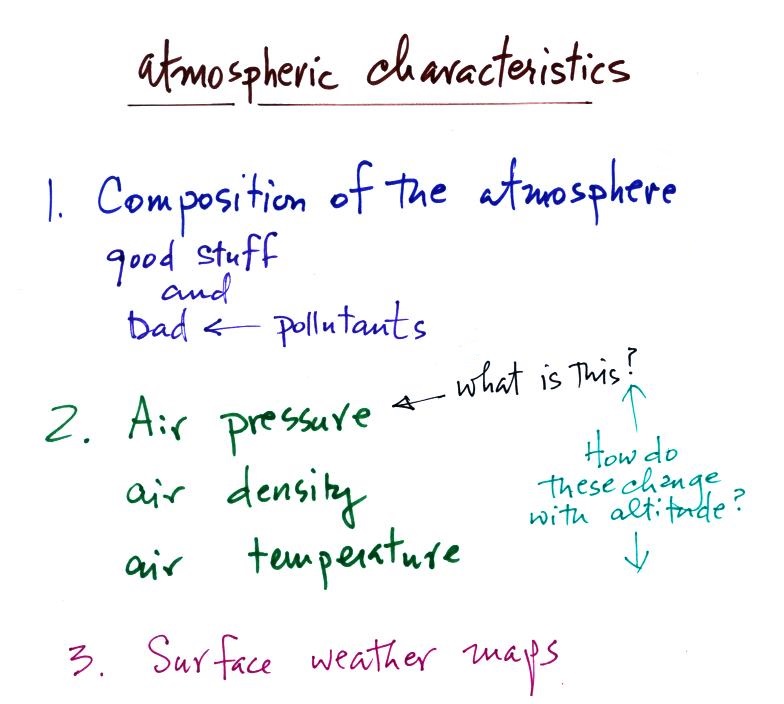
"Chapter 1" - the earth's atmosphere
We did cover a little course material in
class today just so you can get an idea of how that will work.
If we were using a book we'd
start in Chapter 1 and here's some of what we would first be
looking at in this course. None of this material was mentioned or
covered in class. This is an example
of extra information that I stick in the online notes even
though we didn't cover it in class. Skim
through this, no need to worry about all the details at this
point.
We will come back to the first item - the composition of the
atmosphere.
Before we do that however, here
are a few questions to get you thinking about the air around
you.
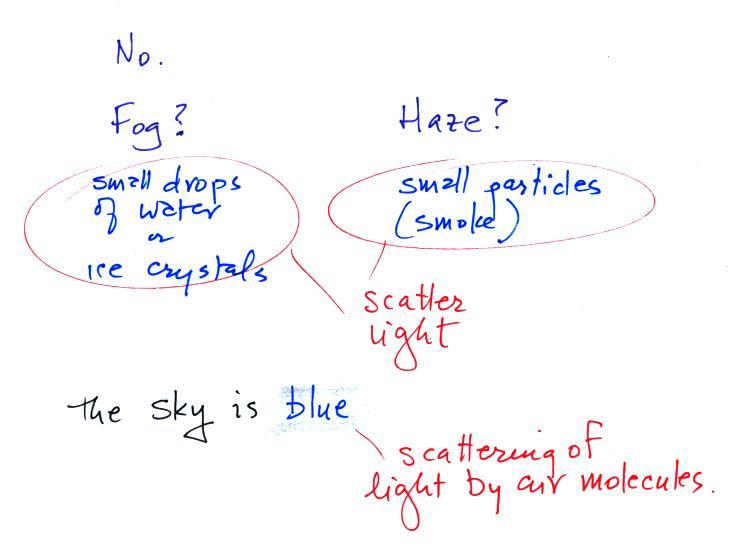
Can
you see air?
Air
is
mostly clear, transparent, and invisible (that would be true
of the air in the classroom). Sometimes the air looks
foggy, hazy, or smoggy. In these cases you are "seeing"
small water droplets or ice crystals (fog) or small particles
of dust or smoke (haze and smog). The particles
themselves may be too small to be seen with the naked eye but
are visible because they scatter (redirect) light.
I didn't really mention or explain what that is but it's a pretty
important concept and we will learn more about it in a
week or so.
And to be completely honest air isn't really invisible.
If you shine a bright light through enough air, such as when
sunlight shines through the atmosphere, the air (the sky)
appears blue. This is a little more complicated form of
scattering of sunlight by air molecules. We'll come back
to this later as well.
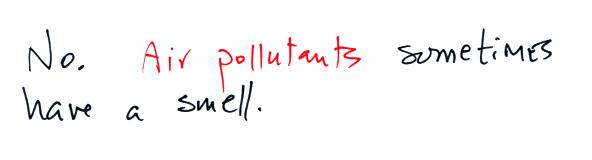
Can you
smell air?
I don't think you can smell or
taste air (air containing nitrogen, oxygen, water vapor, argon
and carbon dioxide). But there are also lots of other odors
you can sometimes smell (freshly cut grass, hamburgers on a
grill, etc). I don't consider these normal constituents of
the atmosphere.
You can probably also smell certain pollutants. I suspect
our sense of smell is sensitive enough for us to detect certain
air pollutants even when their concentration is very small
(probably a good thing because many of them are
poisonous).
Natural gas (methane) used in
hot water heaters, some stoves, and furnaces is odorless.
A chemical (mercaptan) is added to natural gas so that you can
smell it and know when there is a leak before it builds up to a
concentration that could cause an explosion.
Can you feel air
It is harder to answer this question.
We're always in contact with air. Maybe we've grown so
accustomed to it we aren't aware of how it feels. We can
certainly feel whether the air is hot or cold, but that have
more to do with energy exchange between us and our
surroundings. And we can feel wind.
In a week or two we will see that, here in the classroom, air
pressure is pressing on every square inch of our bodies with 12
or 13 pounds of force. If that were to change suddenly I'm
pretty sure we'd feel it and it would probably really hurt.
Now back to material we did cover in
class.
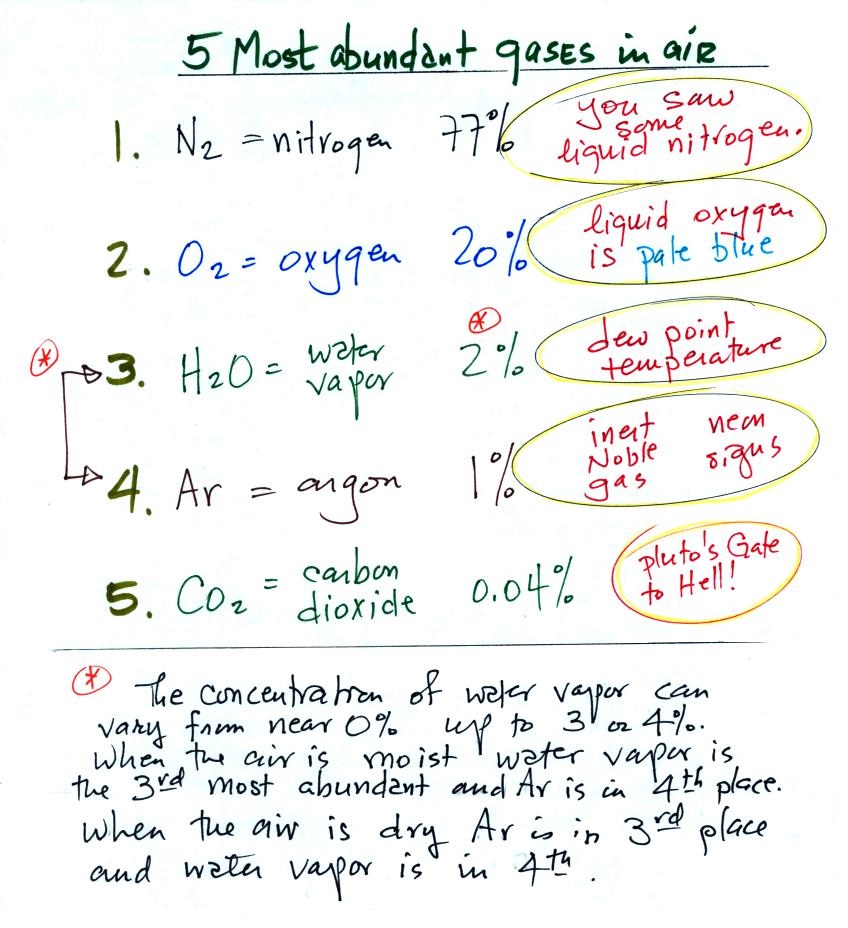
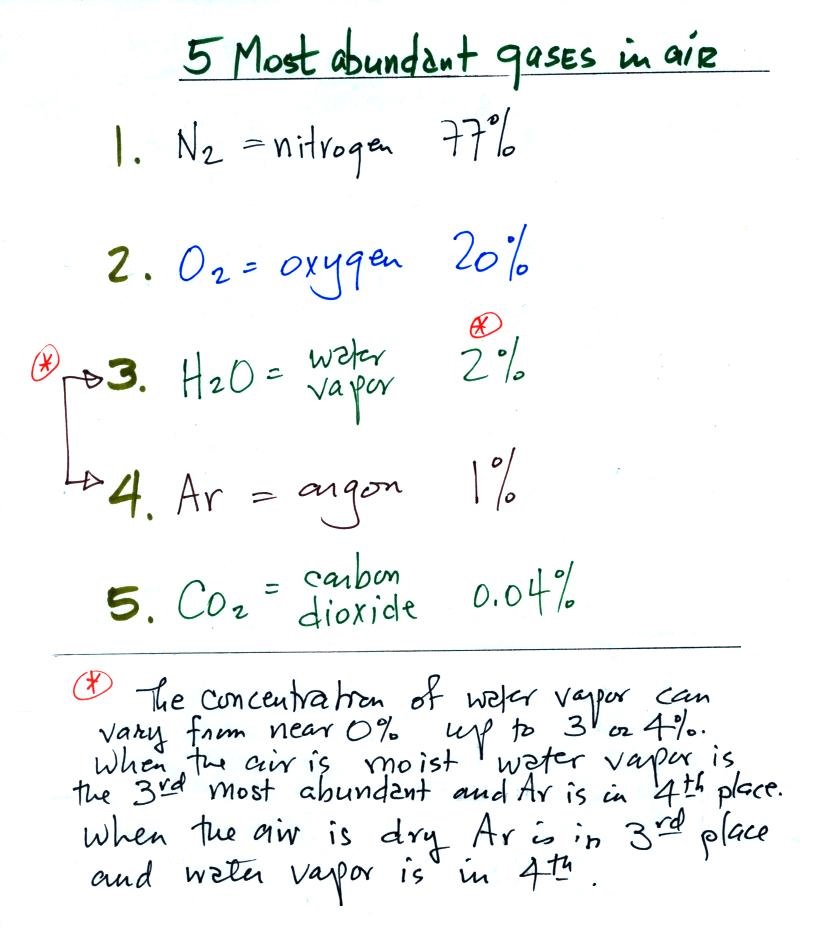
What are the 5 most abundant
gases in air?
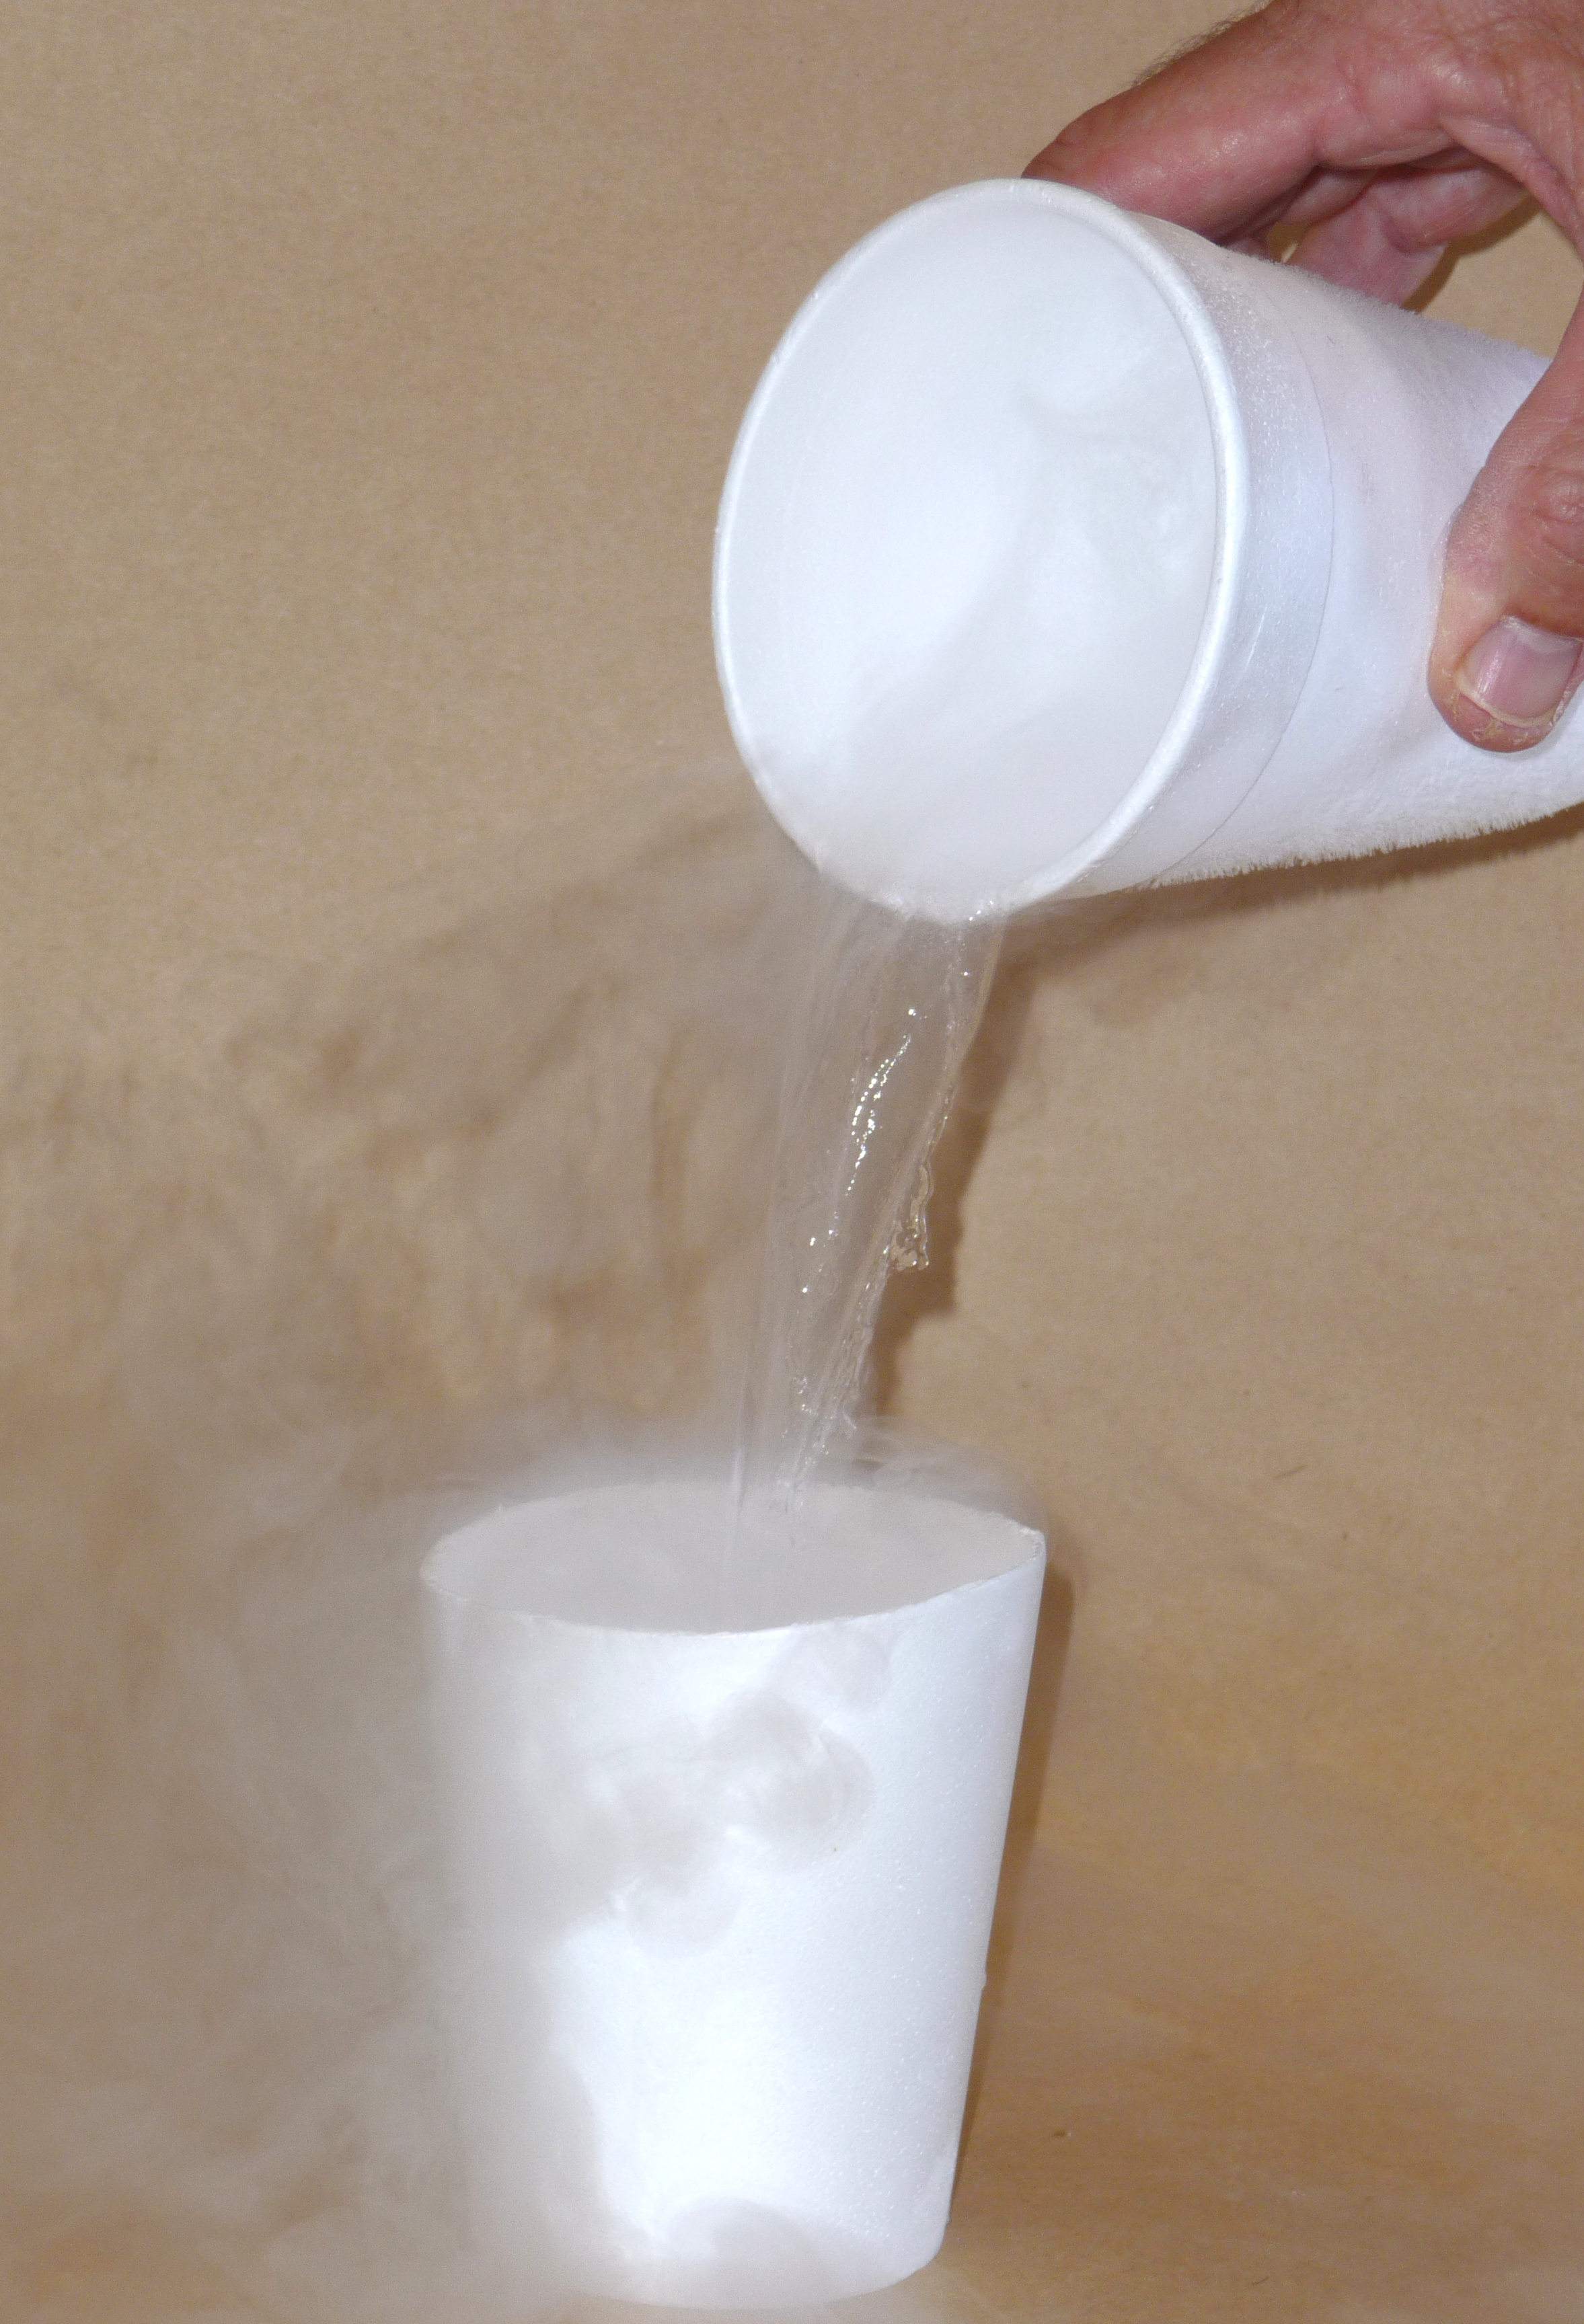
Let's start with the most abundant gas in the atmosphere.
I poured some of this same material (in liquid form) into a
Styrofoam cup. Here's a photo I took back in my office.
You can see the liquid, it's
clear, it looks like water. At least one student
(probably many more) knew that this was liquid
nitrogen. It's very cold and begins to boil
(evaporate) at -321o
F.
The most abundant gas in the atmosphere is nitrogen.
We'll use liquid nitrogen in several class demonstration this
semester mostly because it is so cold.
Nitrogen was discovered in 1772 by Daniel Rutherford (a
Scottish botanist). Atmospheric nitrogen is relatively
unreactive and is sometimes used to replace air in packaged
foods to preserve freshness. You don't need to worry
about details like this for a quiz.
Oxygen is the second most abundant gas in the
atmosphere. Oxygen is the most abundant element (by
mass) in the earth's crust, in ocean water, and in the human
body.
A couple of
photographs of liquid oxygen are shown above (it
boils at -297o F).
It has a (very faint) pale blue
color (I was pretty disappointed because I had
imagined it might be a deep vivid blue). I'd
love to bring some liquid oxygen to class but it's not
readily available on campus. And oxygen is very
reactive. I suspect you'd need to be very
careful with liquid oxygen.
When
heated (such as in an automobile engine) the oxygen and
nitrogen in air react to form compounds such as nitric
oxide (NO), nitrogen dioxide (NO2), and nitrous
oxide (N2O). Together as a group these
are called oxides of nitrogen; the first two are air
pollutants, the last is a greenhouse gas.
Water vapor and argon are the 3rd and 4th most abundant gases in
the atmosphere. A 2% water vapor concentration is listed
above but it can vary from near 0% to as high as 3% or 4%.
Water vapor is, in many locations, the 3rd most abundant gas in
air. In Tucson most of the year, the air is dry enough that
argon is in 3rd position and water vapor is 4th.
Water vapor, a gas, is invisible. Water is the only
compound that exists naturally in solid, liquid, and gaseous
phases in the atmosphere.
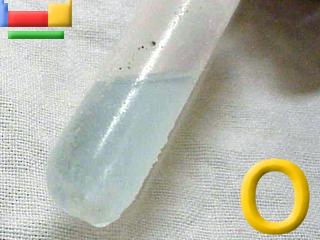
Argon is an unreactive noble gas (helium, neon, krypton, xenon, and radon are also inert gases).
Here's a picture of solid argon
(argon "ice"). It melts at melts
at -309o F and
boils at -302o F;
it's doing both in this picture. (image source).
The concentration of carbon dioxide is much smaller than the
other gases (you don't need to remember the actual value).
That doesn't mean it isn't important. We'll spend a lot of
time this semester talking about water vapor and also carbon
dioxide. Water vapor and carbon dioxide are the two best
known and most important greenhouse gases. The greenhouse
effect warms the earth. Concentrations of greenhouse gases
such as carbon dioxide are increasing and there is concern this
will strengthen the greenhouse effect and cause global
warming. That's a topic we'll look at during the semester.
Here's a little more
explanation (from Wikipedia)
of why noble gases are so unreactive. Don't worry about
all these additional details, none of
this was covered in class. The noble gases
have full valence
electron shells. Valence electrons are the outermost electrons of an atom and are normally the only
electrons that participate in chemical bonding. Atoms with full valence
electron shells are extremely stable and therefore do not tend
to form chemical bonds and have little tendency to gain or lose
electrons (take electrons from or give electrons to atoms of
different materials).
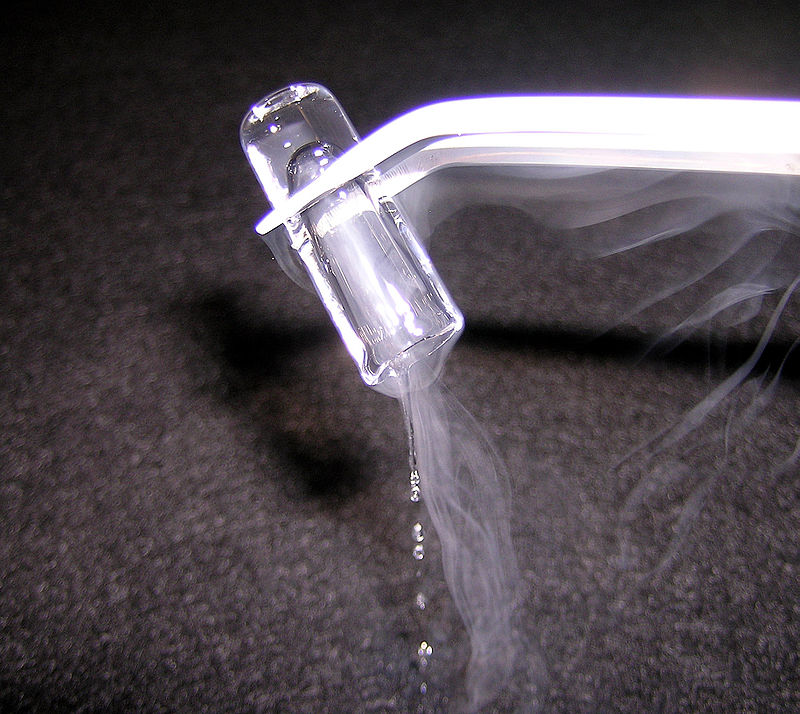
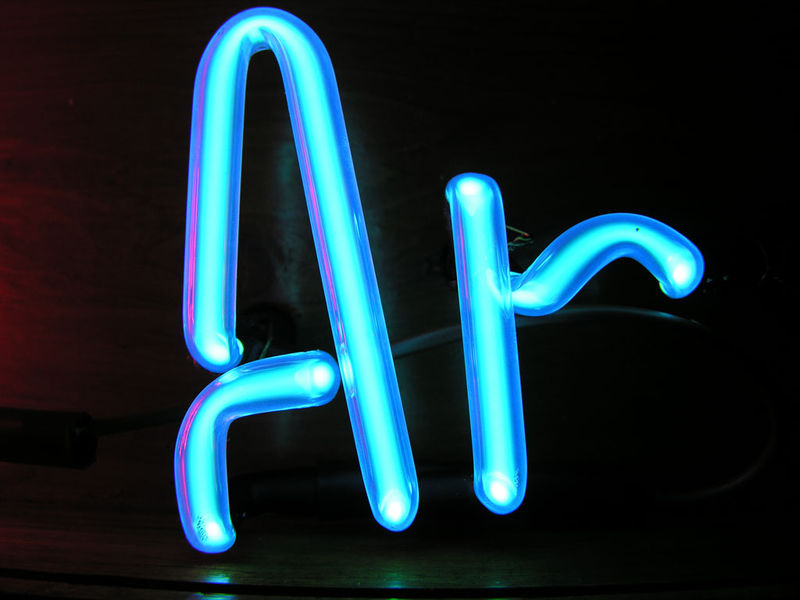
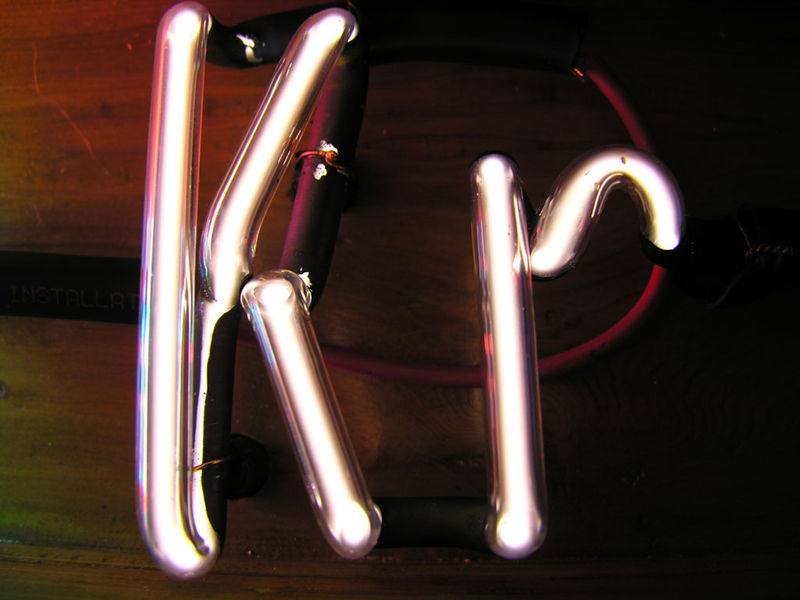
Noble gases are often used used in neon signs; argon produces a
blue color. The colors produced by Argon (Ar), Helium (He),
Kryton (Kr), Neon (Ne) and Xenon (Xe), which are also noble gases,
are shown above (source of the
images). The inert gases don't react with
the metal electrodes in the bulbs. Neon bulbs and
fluorescent bulbs (including energy saving CFLs) often also
contain mercury vapor (which means you should dispose of them
carefully when they burn out). The mercury vapor emits
ultraviolet light that strikes phosphors of different kinds on the
inside of the bulb. Different colors are emitted depending
on the particular type of phosphor used in the bulb.
If we were using a textbook we'd probably find something like
the following table near the beginning of the book (this
table is from a Wikipedia
article about the earth's atmosphere).
I like our list of the 5 most abundant gases better. It's
much more manageable. There is almost too much information
in a chart like this, you might be overwhelmed and not remember
much. Also unless you are familiar with the units on the
numbers they might be confusing. And notice you don't find
water vapor in 3rd or 4th position near the top of the
chart. That's because this is a list of the gases in dry
air. Unless you're very attentive, you might miss that fact
and might not see water vapor way down at the bottom of the chart.
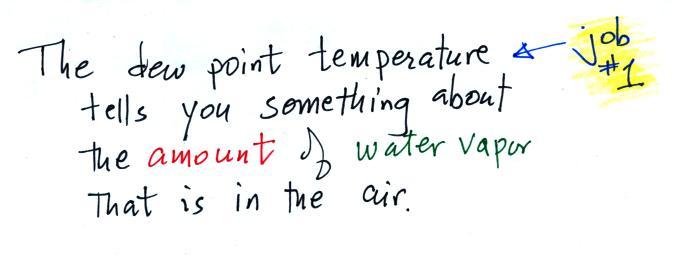
Dew point temperature and the summer monsoon
Water plays an important role in the formation of clouds, storms,
and weather. Meteorologists are very interested in knowing
and keeping track of how much water vapor is in the air at a
particular place and time. One of the variables they use is
the dew point temperature. The value of the dew
point gives you an idea of how much water vapor is actually in the
air. A high dew point value means more water vapor in the
air and higher the water vapor concentration.
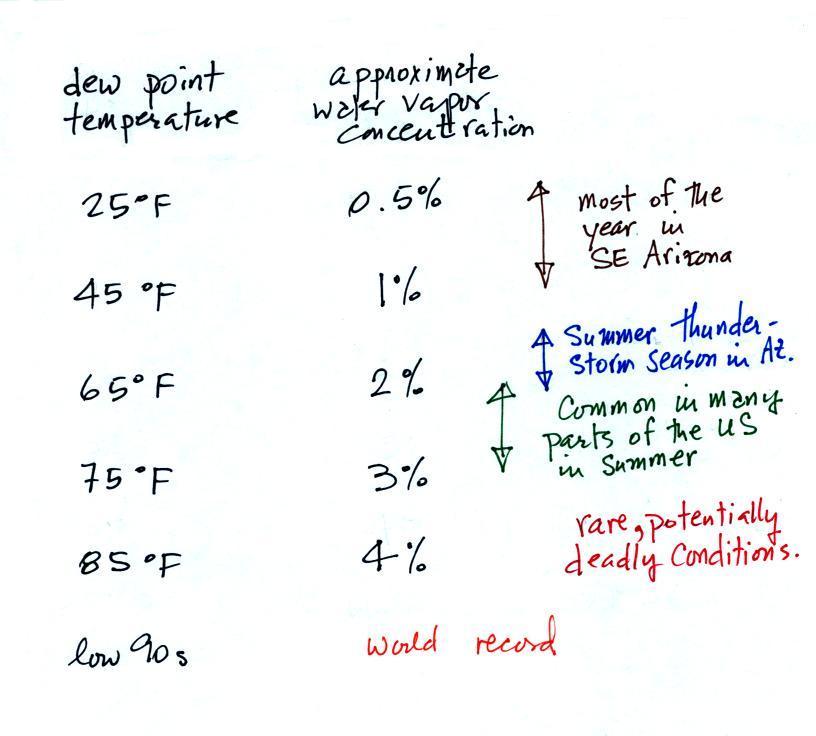
The chart below gives a rough equivalence between dew point
temperature and percentage concentration of water vapor in the
air.
Air temperature will always be equal to or warmer than the dew
point temperature. Experiencing 80o dew points would be very
unpleasant and possibly life threatening because your body
might not be able to cool itself ( the air temperature would
probably be in the 90s or maybe even warmer).
Click here
to see current dew point temperatures across the U.S.
Here's a
link concerning unusually high, even record setting dew
point temperatures.
At one time the dew point temperature was used to identify the
official start of the summer monsoon season in Tucson (the summer
thunderstorm season).
monsoon = a seasonal change in the
direction of the prevailing winds.
most of year - dry westerly winds
summer months - moist east & southeasterly winds
The following graph is from the Tucson
National Weather Service Office and shows the start of the
summer monsoon this year.
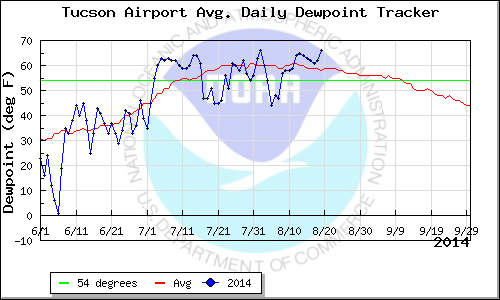
Dates on the x-axis, average daily dew
point values on the y-axis
blue = this
summer's data, red =
average values, green = 54o
F
Dates (running from June 1 through to the
end of September) are plotted along the x-axis and dew point
temperature is shown on the y-axis. Average observed
daily dew point values for this year are in blue. The red line shows average daily
dew point values for this time of the year. Dew point
values were very low (near 0 F) in early June - the air was
very dry. Then mostly they ranged from 30 to 40 F for
the remainder of June.
Traditionally the summer monsoon would start when the
daily average dew point remained at or above 54 F (the green line above) for 3 days in
a row. That occurred on July 3 this year. The
dew point values have dropped below 54 F on a couple of
occasions this summer.
The red line shows that we should expect the summer monsoon
to be ending soon. The air today is very moist (65 F dew
point) this morning. The National Weather Service is
calling for a 60% chance of precipitation this afternoon and
has issued a Flash Flood Watch (which will turn to a warming
if flash flooding does occur). The air will probably dry
out some tomorrow and thunderstorms are out of the picture by
the end of the week.
The moist air that is in place today is due to the
proximity of Hurricane Marie which is shown below on a
satellite photo (the hurricane is in the lower left corner of
the picture).
The counterclockwise spinning motion of the hurricane winds
and the motion of the hurricane toward the NW is pushing moist
air up the Gulf of California and into Arizona.
Here's a time lapse
movie of cloud development from yesterday (the movie
goes up to about 5 pm). Early in the movie you'll see
some middle altitude clouds streaming in from the
southeast. If you look carefully you'll then see how
thin high altitude clouds moving from the southwest.
By midday solar heating has warmed the ground. Air in
contact with the ground warms, becomes buoyant, and begins to
rise. The rising motion cools the air clouds form.
This is how summer thunderstorms usually get initiated.
The activity yesterday stayed mostly over the mountains, I'm
hoping we'll get some rain in the valley, in mid town today.
Dew point temperature continued
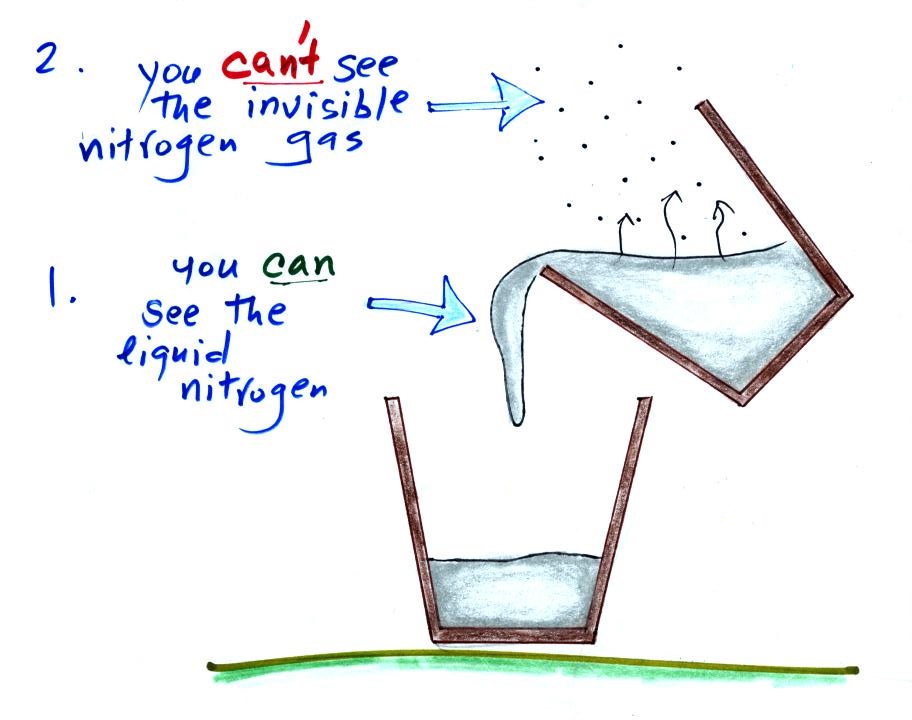
Now let's go back to the cup of liquid
nitrogen
We can see liquid nitrogen but we can't see the
nitrogen gas being produced by the evaporation of
liquid nitrogen. The white cloud that surrounds the cup
of liquid nitrogen isn't nitrogen gas, what is it?
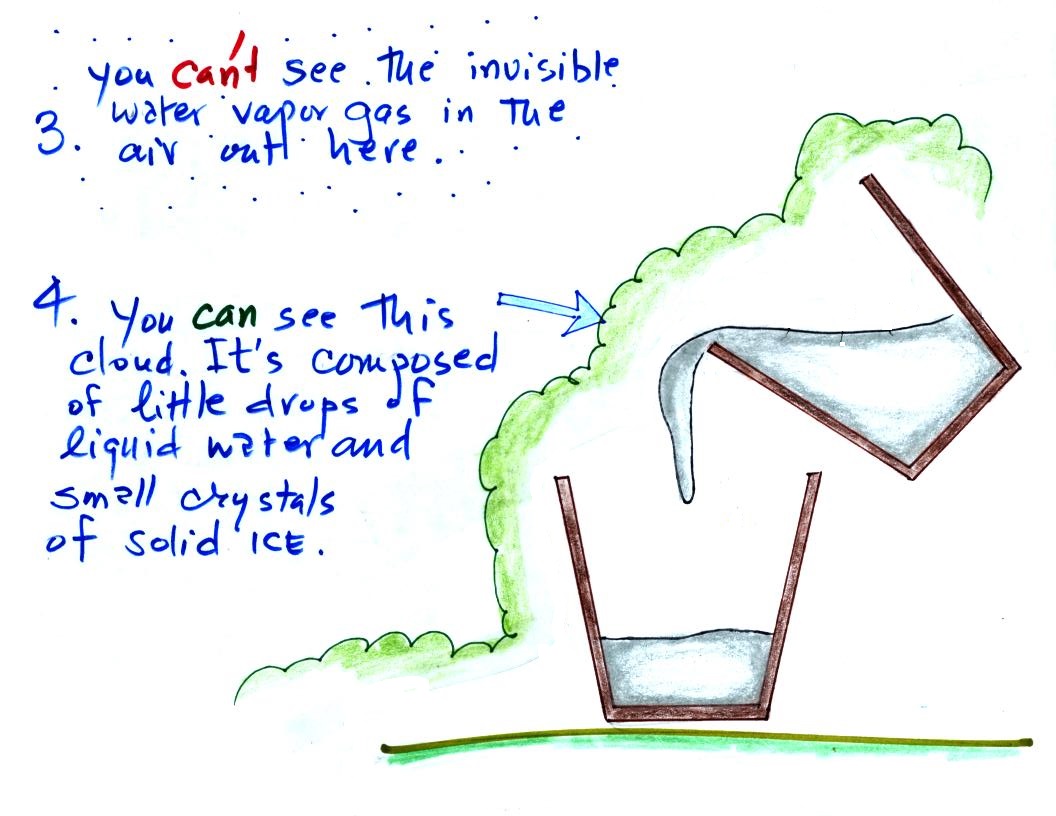
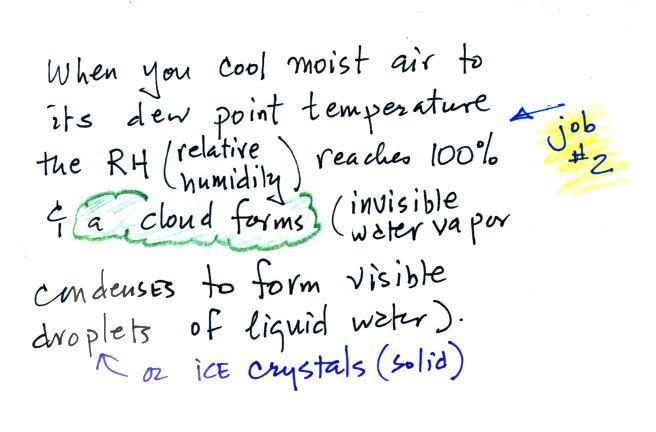
The white cloud isn't water vapor because water vapor, a gas,
is invisible just like nitrogen gas. When the air is cooled
however, by coming into contact with the liquid nitrogen, the
water vapor condenses and forms small droplets of water (liquid)
or ice crystals (solid). That's what you are
able to see, a cloud composed of water droplets or ice crystals.
We're seeing a demonstration of the dew
point's second job.
If you cool air next to the ground to its dew point, water
vapor will condense and coat the ground with water. The
ground will be covered with dew. If a little thicker layer
of air is cooled fog will form.
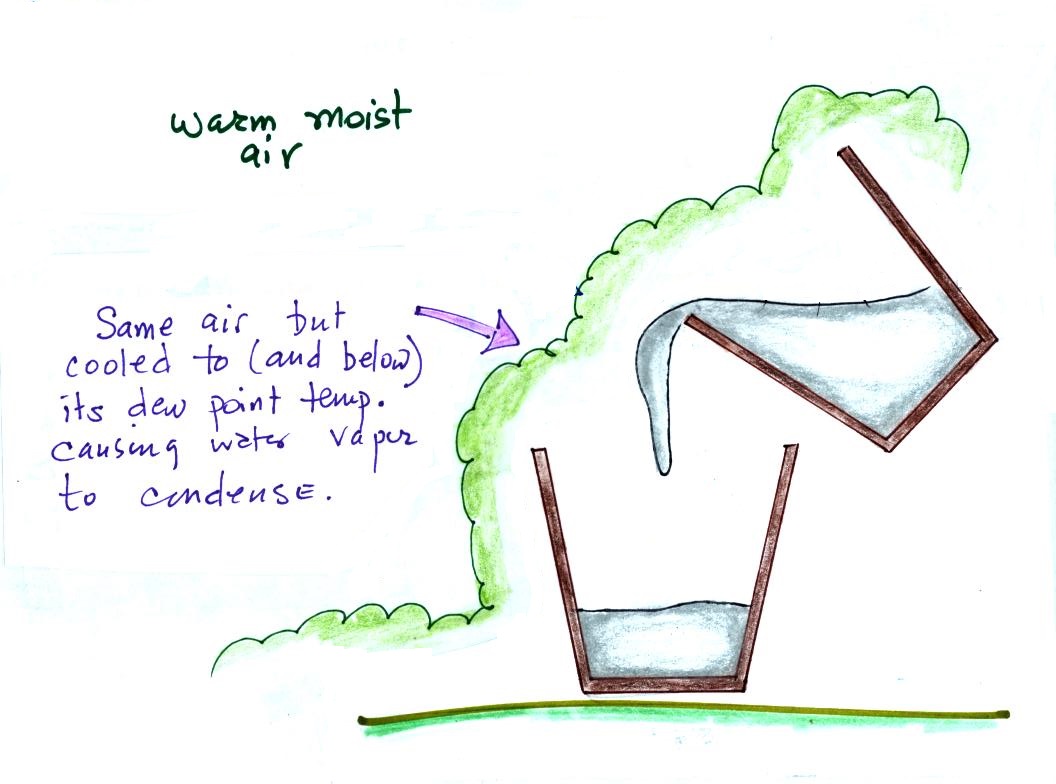
We can't ordinarily see the water vapor (the moisture) in
air. It's only when the moist air is cooled to its dew point
and the water vapor condenses that we can see it.
Closing remarks and Pluto's Gate to Hell
We were nearing the top of the hour at this point which is
probably enough for the first day of class. None of what follows was mentioned in class.
When you have a free moment try to recall the 5 most abundant
gases in air without looking at your notes. Then try to
remember something about each of them. You'll find what I
think is a reasonable list at the end of today's notes.
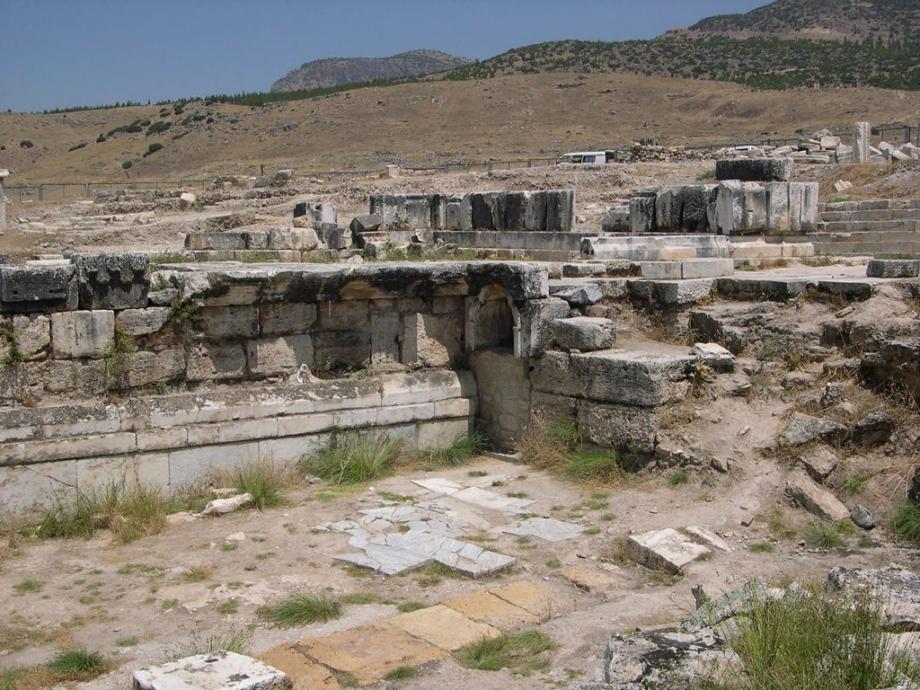
Pluto's
Gate to Hell was discovered in early
2013 at the ancient city of
Hierapolis in southwestern Turkey
(Pluto was the Roman god of the
underworld, he was called Hades by
the Greeks)
The
picture above at left shows the site
as it appears now (source
of this photograph).
The gate is the opening in the
wall near the center of the
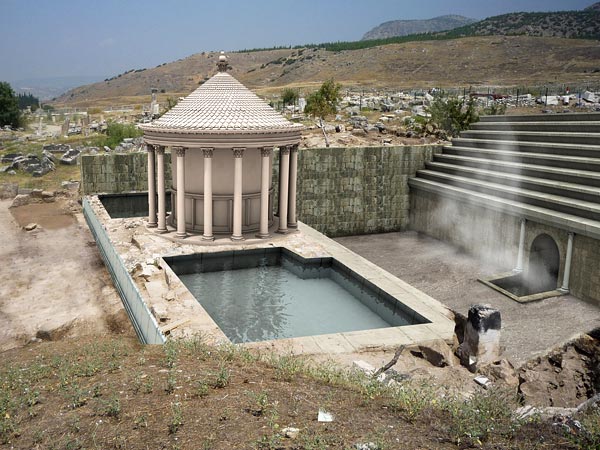
picture. The site as it
might have appear in ancient
times is shown above at
right. This photograph,
credited to Francesco D'Andria,
the lead Italian archaelogist
that announced the discovery in
March 2013, is found in a news
report from the National
Geographic Society.
The
"gate" was built on top of a
cavern and, in ancient times, a
mist of deadly vapors could be
seen coming from the cave (the
mist is shown in the right
picture above). Here's a
quote from the Slate
article where I first read
about the discovery:
"Two
millennia ago, visitors to Pluto's
Gate could buy small birds or
other animals (the sale of which
supported the temple) and test out
the toxic air that blew out of the
mysterious cavern. Only the
priests, high and hallucinating on
the fumes, could stand on the
steps by the opening to
hell. They would sometimes
lead sacrificial bulls inside,
later pulling out their dead
bodies in front of an awed crowd.
As
the Greek geographer, philosopher,
and prolific traveler Strabo, who
lived from 64/63 B.C. to 24 A.D.,
so enticingly described it: 'This
space is full of a vapor so misty
and dense that one can scarcely
see the ground. Any animal
that passes inside meets instant
death. I threw in sparrows
and they immediately breathed
their last and fell.' "
The Italian archaeologists working at the
site would occasionally notice birds dying if they flew into the
vapors coming from the came. The deadly gas was carbon
dioxide. Carbon dioxide is not ordinarily thought of as a
poisonous gas but in high enough concentrations it can
asphyxiate you (cause you to suffocate).