Tuesday Oct. 17, 2017
La Santa Cecilia "Losing Game"
(3:15), "La
Negra" (3:16), "I Won't Cry
for You" (3:40), "Odiame"
(3:40) and a selection or two
from the first all female mariachi band in New York City Mariachi
Flor de Toloache "Rhythm in
Motion" (3:26), "Dulces
Recuerdos" (3:37)
An In-class
Optional Assignment was handed out in class today. If
you weren't in class and would like to download the assignment,
answer the questions, and turn in the assignment before the quiz
on Thursday you can do so. You will earn at least partial
credit on the assignment.
How much of the sunlight arriving at the top of the
atmosphere actually makes it to the ground?
In the simplified explanation of the greenhouse
effect last week we assumed that 100% of the sunlight arriving
at the top of the earth's atmosphere passed through the
atmosphere and got absorbed at the ground. That would be a
reasonable assumption if sunlight were just visible light, but
it's not. We will now look at how realistic that
assumption is.

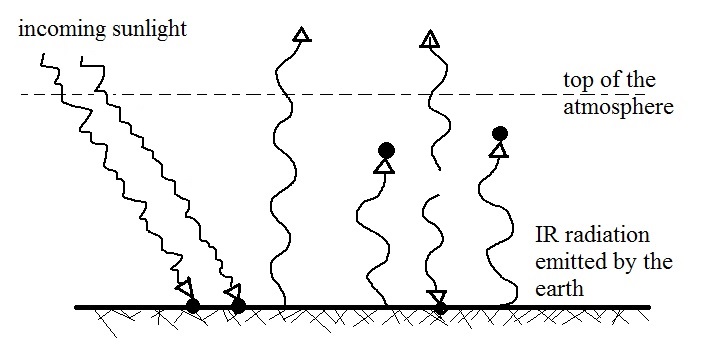
The bottom figure above shows that on average (averaged over
the year and over the globe) about half (50%)
of the incoming sunlight makes it through the atmosphere and
gets absorbed at the ground. This is the only number in
the figure you should try to remember.
About 20% of the incoming sunlight is absorbed by gases in the
atmosphere. Sunlight is a mixture of mostly visible and near
IR light. There are smaller amounts of far IR and
light. Ozone and oxygen will absorb most of the UV (UV makes
up only 7% of sunlight). Roughly half (49%) of sunlight is
IR light and greenhouse gases will absorb some of that.
The remaining 30% of the incoming sunlight is reflected or
scattered back into space (by the ground, clouds, even air
molecules).
Expt. #3 students take note.
The object of Expt. #3 is to measure the
energy in the sunlight arriving at the ground here in
Tucson. About 2 calories of sunlight energy pass through a
one square centimeter area every minute at the top of the
atmosphere. Since about 50% of that will reach the ground,
you should get a value of about 1 calorie/(cm2
min).
The first question on the In-class
Assignment follows up on what we have just learned.
|
|
Here is our simplified
version of the greenhouse effect from the other day.
This figure is in energy balance
|
This is a more realistic
representation because it allows only half of the incoming
sunlight to reach the ground. The other half is
absorbed by the atmosphere.
As shown here the figure is incomplete and is not in
energy balance. The atmosphere is absorbing 3 units
of energy but not emitting any. We need to add 3
arrows of emitted energy. The question is what
direction to send them, up or down.
|
A more realistic picture of energy balance on the earth
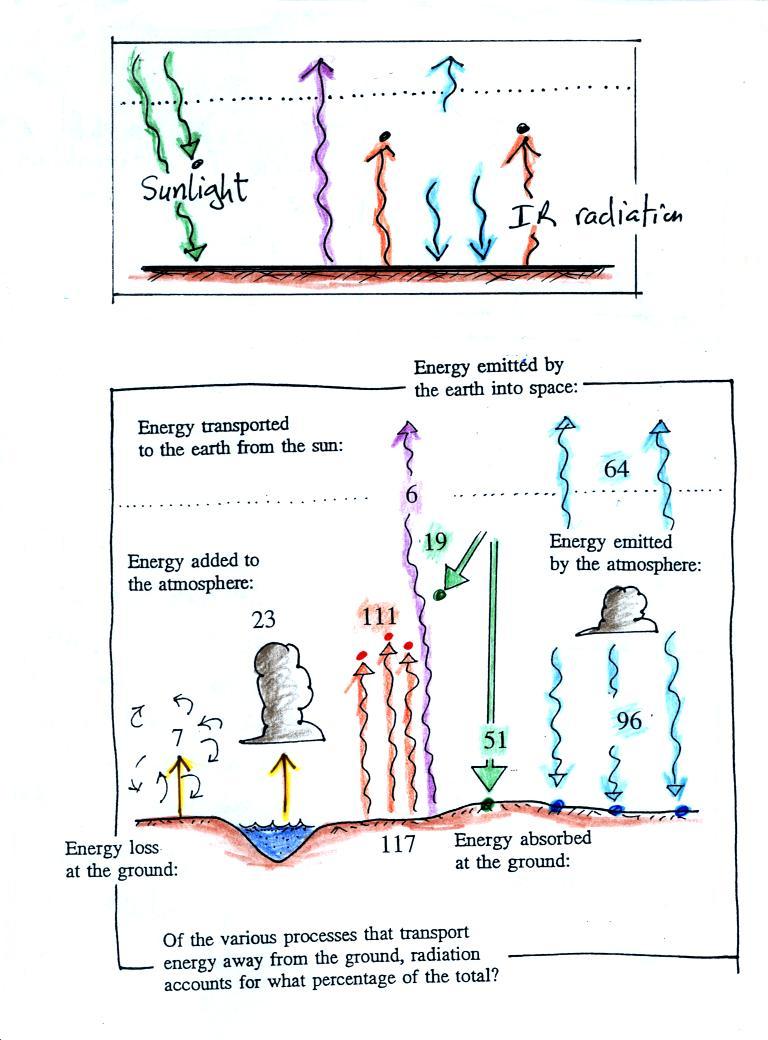
The top part of the figure below is our new and improved but
still simplified representation of energy balance and the
greenhouse effect.
In the top figure you should recognize the incoming
sunlight (green), IR emitted by the ground that passes through the
atmosphere (violet), IR radiation emitted by the ground that is
absorbed by greenhouse gases in the atmosphere (orange) and IR
radiation emitted by the atmosphere (blue).
The lower part of the figure is pretty complicated. It would
be difficult to start with this figure and find the greenhouse
effect in it. That's why we used a simplified version.
Once you understand the upper figure, you should be able to find
and understand the corresponding parts in the lower figure (I've
tried to use the same colors for each of the corresponding parts).
The figure assumes that 100 units of sunlight energy are
arriving at the top of the atmosphere. About half of the
incoming sunlight (51 units in green, we rounded that down to 50
in an earlier figure) reaches the ground and is absorbed. 19
units of sunlight (we rounded that up to 20 in the earlier figure)
are absorbed by gases in the atmosphere. The 30 units of
reflected sunlight weren't included in the figure.
The ground emits a total of 117 units of IR light. Only 6
shine through the atmosphere and go into space. The
remaining 111 units are absorbed by greenhouse gases.
There were 3 somewhat surprising things to
notice in the figure.
(1). How can the
ground be emitting more energy (117 units) than it gets from
the sun (51 units ) and still be in energy balance?
The answer is that the ground isn't just receiving sunlight
energy. It is also getting energy from the atmosphere.
That's thanks to the greenhouse effect. Most of the energy
emitted by the ground is absorbed by greenhouse gases in the
atmosphere. The atmosphere then emits some of this energy
downwards. The ground gets back some of what it would
otherwise have lost.
If you're really paying attention you would notice that 117 units
emitted doesn't balance 96 + 51 = 147 units absorbed. The
surface is emitting 117 units but an additional 30 units are being
carried from the ground to the atmosphere by conduction,
convection, and latent heat (at the far left of the figure).
That brings everything into balance (117 + 30 = 147). Note
how much smaller the energy transport by conduction, convection,
and latent heat are compared to radiant energy transport.
(2).
Why are the amounts of energy emitted upward (64
units) and downward (96 units) different?
One reason might be that the lower atmosphere is warmer than the
upper atmosphere (warm objects emit more energy than cold
objects). But I think a better explanation is that there is
more air in the bottom of the atmosphere (the air is denser) than
near the top of the atmosphere. It is the air in the
atmosphere that is emitting radiation. More air = more
emission.
Note that the atmosphere is emitting more energy downward than
upward in our simplified version of the greenhouse effect.
(3).
The ground is receiving more energy from the
atmosphere (96 units) than it gets from the sun (51 units)!
Doesn't that seem surprising? I think the main reason for
this is that the sun just shines for part of the day (half the day
on average over the course of a year). We receive energy
from the atmosphere 24 hours per day, 365 days per year.
A common misconception about the cause of global
warming.
Many people know that sunlight contains UV light and that the
ozone layer absorbs much of this dangerous type of high energy
radiation. People also know that release of chemicals such
as CFCs are destroying stratospheric ozone and letting some of
this UV light reach the ground. That is all correct.
But then they conclude that it is this additional UV energy
reaching the ground that is causing the globe to warm. This is not correct.
There isn't enough additional UV light to cause significant
warming. The additional UV light will cause cataracts and
skin cancer and those kinds of problems but not global warming.
If all 7% of the UV light in sunlight were to reach the ground
it probably would cause some warming. But it probably
wouldn't matter because some of the shortest wavelength and most
energetic forms of UV light would probably kill us and most other
forms of life on earth. We wouldn't be around long enough to
have to worry about climate change. Ultraviolet Light is the
subject of one of the new 1S1P
Report topics.
Enhancement of the greenhouse effect and global warming
Here's the real cause of global warming and the reason for
concern (this is also the last time you'll see these
energy balance pictures)

The figure (p. 72b in the photocopied Class Notes) on the left
shows energy balance on the earth without an atmosphere (or
with an atmosphere that doesn't contain greenhouse
gases). The ground achieves energy balance by emitting
only 2 units of energy to balance out what it is getting from
the sun. The ground wouldn't need to be very warm to do
this, only 0 F.
If you add an atmosphere and greenhouse gases, the
atmosphere will begin to absorb some of the outgoing IR
radiation. The atmosphere will also begin to emit IR
radiation, upward into space and downward toward the
ground. After a period of adjustment you end up with a
new energy balance. The ground is warmer and is now
emitting 3 units of energy even though it is only getting 2
units from the sun. It can do this because it gets a
unit of energy from the atmosphere. This is what I refer
to as the beneficial greenhouse effect. It makes the
earth more habitable by raising the average surface
temperature to 60 F.
In the right figure the concentration of greenhouse gases
has increased even more (due to human activities). The
earth might find a new energy balance. In this case the
ground would be warmer and could be emitting 4 units of
energy, but still only getting 2 units from the sun.
With more greenhouse gases, the atmosphere is now able to
absorb 3 units of the IR emitted by the ground. The
atmosphere sends 2 back to the ground and 1 up into
space. A new balance is achieved but the earth's surface
is warmer. How much warmer? That's the big
question. An even bigger question is what effects that
warming will have.
Don't worry about all the details in this figure, just notice
the trend. As greenhouse gas concentrations increase,
the earth warms.
The effects of clouds on daytime high and nighttime low
temperatures
This is a topic that I often "beat to death." I want to
keep it as short and simple as I can this semester.
Here are some pretty typical high and low temperatures for this
time of year in Tucson (we've been running well above normal for
the past week or so). Notice the effects that clouds have:
they generally lower the daytime high temperature (it doesn't get
quite as hot on a cloudy day as it would on a clear day) and raise
the nighttime low temperature (it doesn't get quite as cold on a
cloudy night as it would on a clear night).
Sunlight is what warms the earth during the day. Sunlight is
mostly visible and near-IR light. Clouds are good reflectors
of visible and near IR light (clouds appear white). A
smaller fraction of the incoming sunlight will reach the ground on
a cloudy and it won't get as warm.
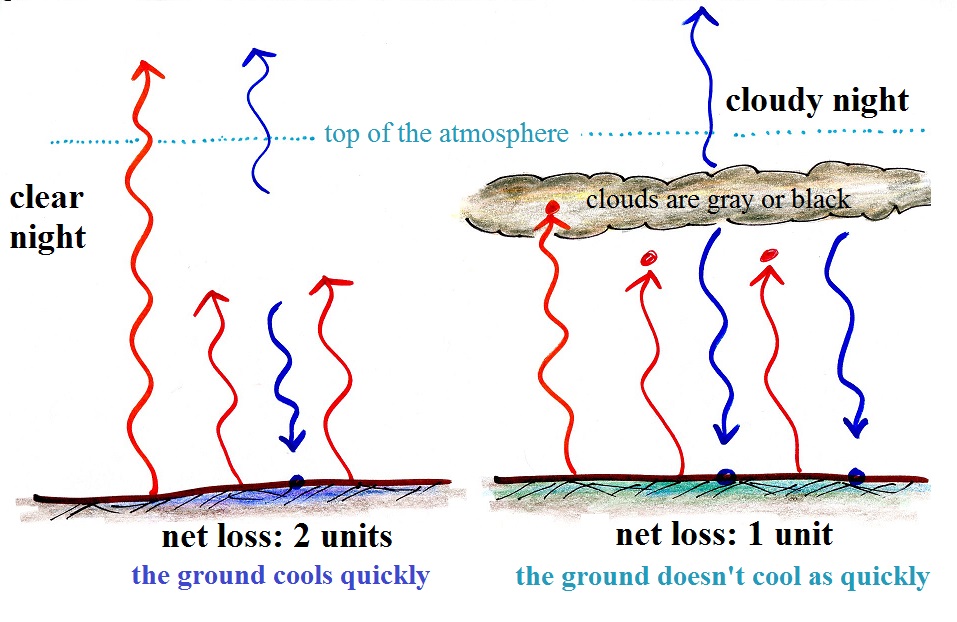
The situation is different at night. The sun is no longer
in the picture. The ground cools by emitting far-IR
light. Without an atmosphere at all this IR energy would
travel out to space and the ground would cool very quickly and get
very cold. Greenhouse gases absorb some of this IR light
emitted by the ground and re emit a portion of it back to the
ground.
It turns out that clouds are good absorbers of far-IR light too
(they absorb some of the wavelengths that greenhouse gases do
not). I've colored the cloud layer grey in the right picture
above. If our eyes were sensitive to far IR instead of
visible clouds would appear gray or black. I've also added
some orange to the gray cloud because clouds also emit far IR
light. Some of this emitted IR light is downward to
the ground and reduces the rate at which the ground cools.
It doesn't get as cold on a cloudy night as it would on a clear
night.
This is the end of the material that
will be covered on Quiz #2 coming up on Thursday this week.
The next block of material we will be
covering includes humidity variables. These are ways
of measuring and tracking the amount of moisture in the
air. We'll learn a little bit about how clouds form
and will learn how to identify and name clouds. Only 2
of the 10 basic cloud types are able to produce significant
amounts of precipitation. It's not as easy to produce
precipitation as you might think. This is something
else we'll be looking at.
Today: introduction to humidity variables
This topic and the terms that we will
be learning are probably new and might be confusing.
So here's an introduction. We will be
mainly be interested in 4 variables:
Your task will be to learn the
"jobs" of these variables, their units, and what can cause them
to change value.
The back page of today's In-Class
Optional Assignment covered this topic.
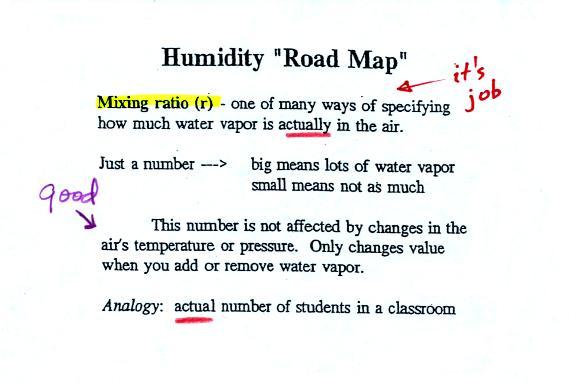
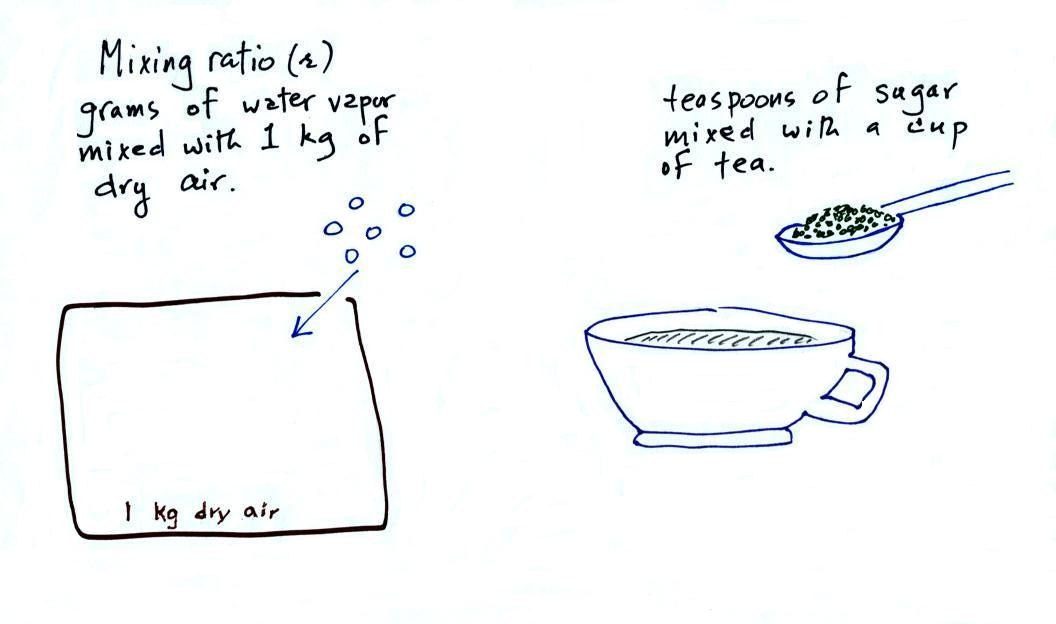
Mixing ratio ( r )
The bottom half of the figure below can
be found on p. 83 in the ClassNotes.
Mixing ratio tells you how much water vapor
is actually
in the air. Mixing ratio has units of grams of
water vapor per kilogram of dry air (the amount of water vapor
in grams mixed with a kilogram of dry air). A kilogram
of air is about one cubic meter of air (about one cubic yard
of air). Mixing ratio is basically the same idea as teaspoons
of sugar mixed in a cup of tea.
The value of the mixing ratio won't change
unless you add water vapor to or remove water vapor from the
air. Warming the air won't change the mixing
ratio. Cooling the air won't change the mixing ratio (with one exception
- when the air is cooled below its dew point temperature and
water vapor starts to condense). Since the mixing
ratio's job is to tell you how much water vapor is in the air,
you don't want it to change unless water vapor is actually
added to or removed from the air.
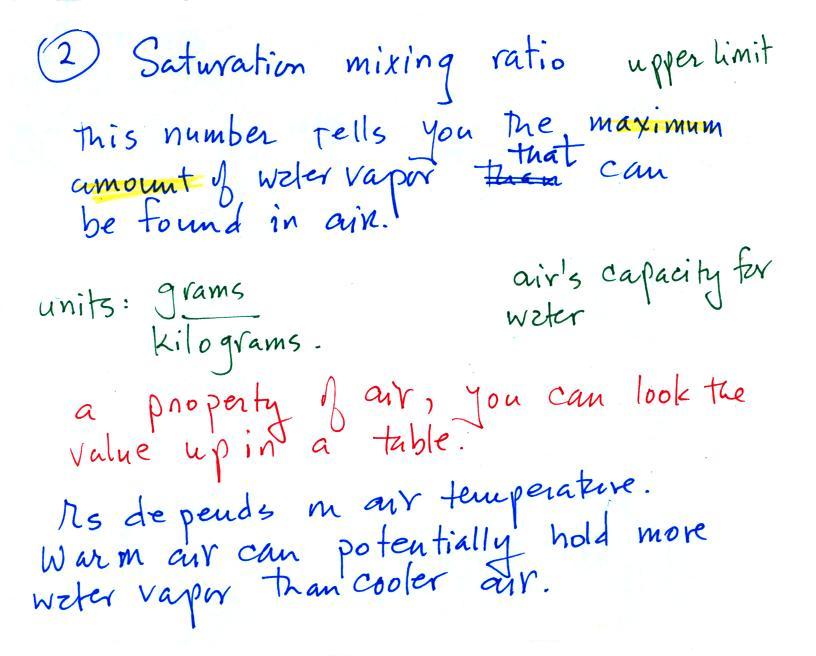
Saturation mixing ratio ( rS )
Saturation mixing ratio is just an upper limit
to how much water vapor can be found in air, the air's capacity
for water vapor. It's a property of air and depends on
the air's temperature; warm air can potentially hold
more water vapor than cold air. It doesn't
say anything about how much water vapor is actually in the air
(that's the mixing ratio's job). This
variable has the same units: grams of water vapor per kilogram
of dry air. Saturation mixing ratio values for different
air temperatures are listed and graphed on p. 86 in the
ClassNotes.

The sugar dissolved in tea analogy is still
helpful. Just as is the case with water vapor in air,
there's a limit to how much sugar can be dissolved in a cup of
hot water. And not only that, the amount depends on
temperature: you can dissolve more sugar in hot water than in cold
water.
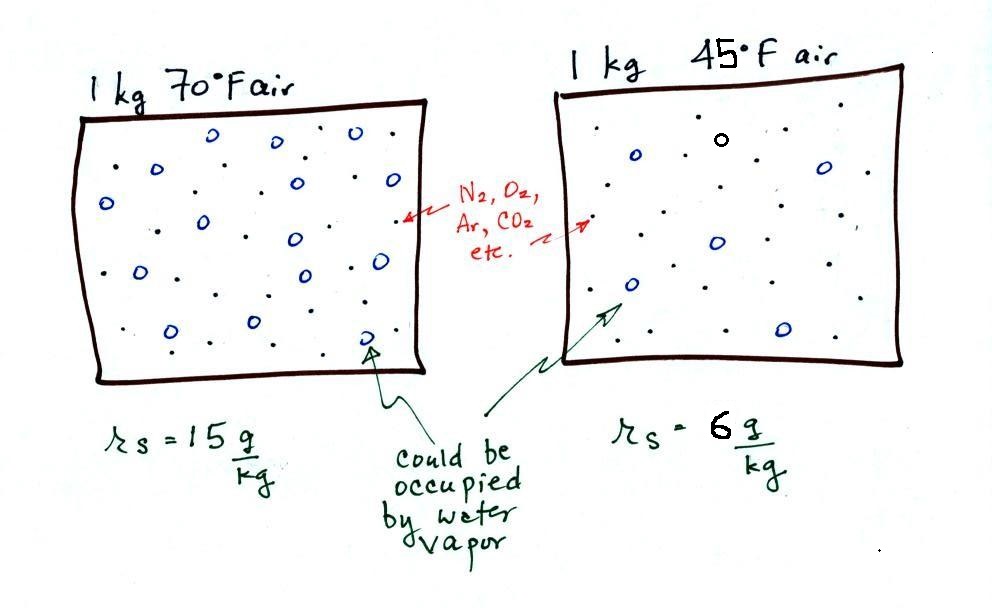
The dependence of saturation mixing ratio on air
temperature is illustrated below:
The small specks represent all
of the gases in air except for the water vapor. Each of
the open circles represents 1 gram of water vapor
that the air could potentially hold. There are 15 open
circles drawn in the 1 kg of 70 F air; each 1 kg of 70 F air
could hold up to 15 grams of water vapor. The 40 F air
only has 5 open circles; this cooler air can only
hold up to 5 grams of water vapor per kilogram of dry air.
The numbers 15 and 5 came from the table on p. 86.
Now we have gone and actually
put some water vapor into the volumes of 70 F and 40 F air (the
open circles are colored in). The same amount, 3 grams of
water vapor, has been added to each volume of air. Three
of the open circles have been colored in. The mixing
ratio, r, is 3 g/kg in both cases. One of the
figures is almost filled to capacity, with water vapor the other
is not. That's basically what the 3rd humidity variable,
relative humidity, tells us
Relative humidity (RH)
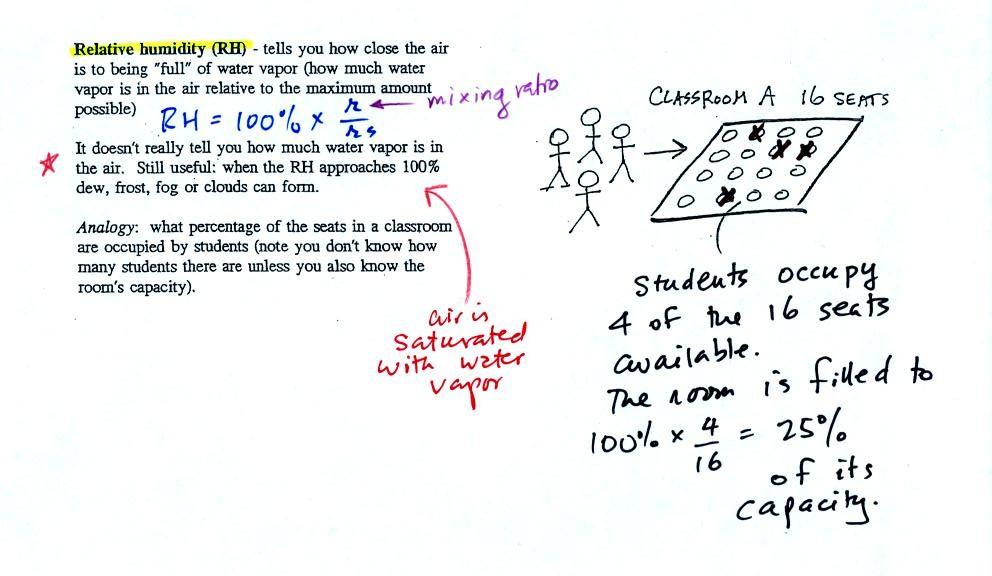 |
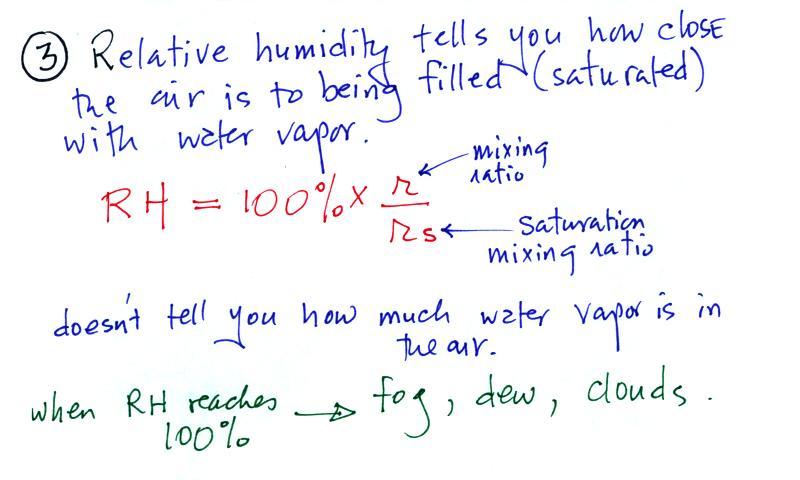
The relative humidity is the
variable most people are familiar with. It tells you how
"full" the air is with water vapor, how close it is to
being filled to capacity with water vapor, how
close the air is to being "saturated" with water
vapor. RH has units of %.
In the analogy (sketched on the right hand side of p. 83 in
the photocopied notes) 4 students wander into Classroom A which
has 16 empty seats. Classroom A is filled to
25% of its capacity. You can think of 4, the
actual number of students, as being analogous to the mixing
ratio. The classroom capacity is analogous to the
saturation mixing ratio. How full the room is is analogous
to the relative humidity.
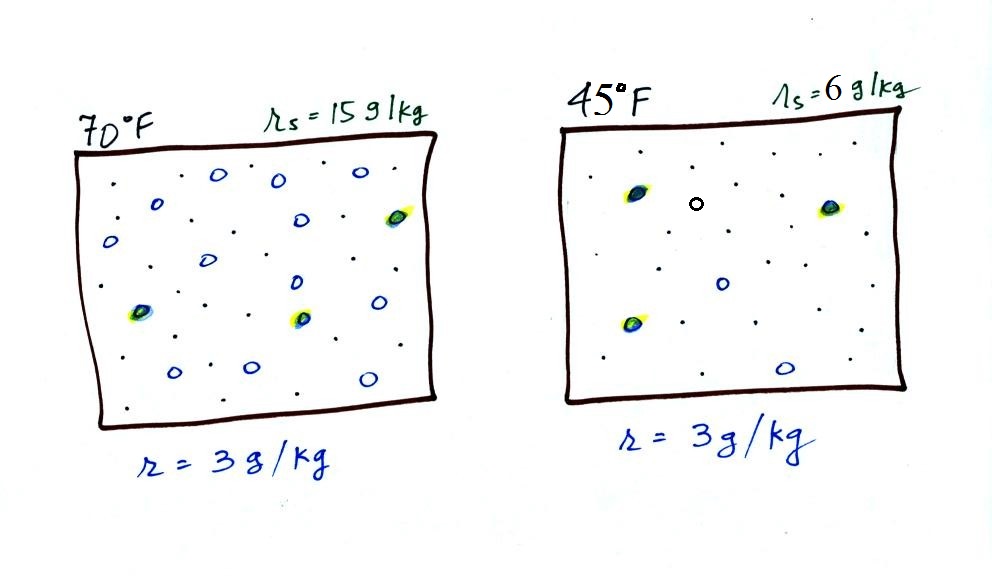
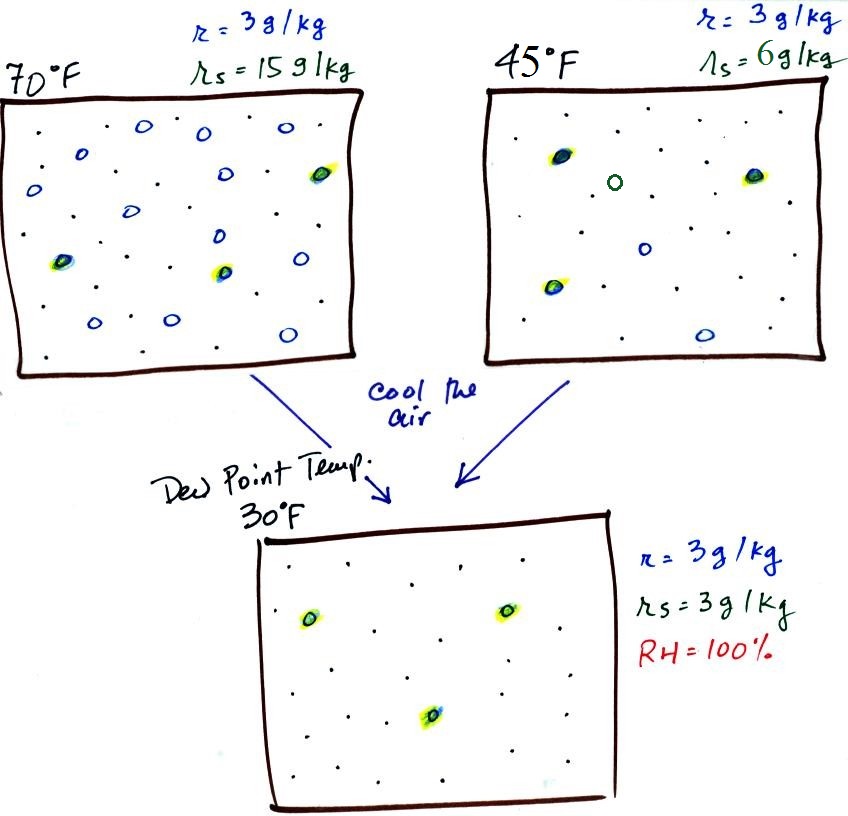
The figure below goes back to the volumes (1 kg each) of 70 F
and 40 F air that could potentially hold 15 grams or 5 grams of
water vapor.

Both the 70 F and the 40 F air each contain 3 grams of water
vapor. The 70 F air is only filled to 20% of capacity (3 of
the 15 open circles is colored in) because this warm air's
capacity, the saturation mixing ratio, is large. The RH in
the 40 F is 60% even though it has the same actual amount of water
vapor because the 40 F air can't hold as much water
vapor and is closer to being saturated.
Something important to note: RH doesn't
really tell you how much water vapor is actually in the air.
The two volumes of air above contain the same amount of water
vapor (3 grams per kilogram) but have very different values of
relative humidity. You could just as easily have two volumes
of air with the same relative humidity but different actual
amounts of water vapor.
What is the RH good for if it doesn't tell you how much
moisture is in the air? When the RH reaches 100% dew, fog,
and clouds form. RH tells you whether clouds or fog are
about to form or not.
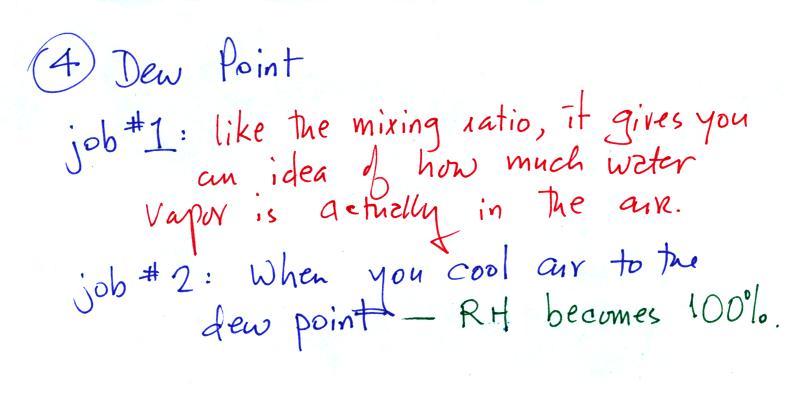
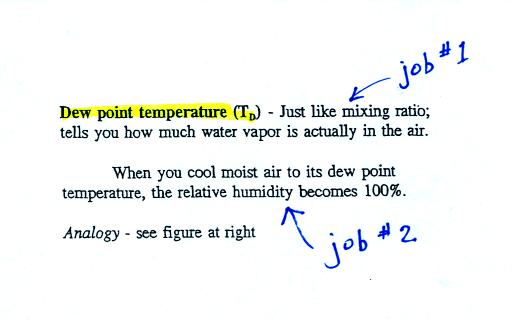
Dew point temperature
The dew point temperature has
two jobs. First it gives you an idea of the actual amount
of water vapor in the air. In this respect it is
just like the mixing ratio. If the dew point temperature
is low the air doesn't contain much water vapor. If it is
high the air contains more water vapor. This is something
we learned early in the semester.
The dew point is a temperature and has units of
oF or oC
Second the dew point tells you how much you
must cool the air in order to raise the RH to 100% (at which
point a cloud, or dew or frost, or fog would form). This
idea of cooling the air until the RH increases to 100% is
important and is something we will use a lot.
If we cool the 70 F air or the 40 F air to 30
F we would find that the saturation mixing ratio would decrease
to 3 grams/kilogram. Since the air actually contains 3
g/kg, the RH of the 30 F air would become 100%. The 30 F
air would be saturated, it would be filled to capacity with
water vapor. 30 F is the dew point temperature for 70 F
air that contains 3 grams of water vapor per kilogram of dry
air. It is also the dew point temperature for 40 F air
that contains 3 grams of water vapor per kilogram of dry air.
Because both volumes of air had the same amount of water
vapor, they both also have
the same dew point temperature.
Now back to the
student/classroom analogy.
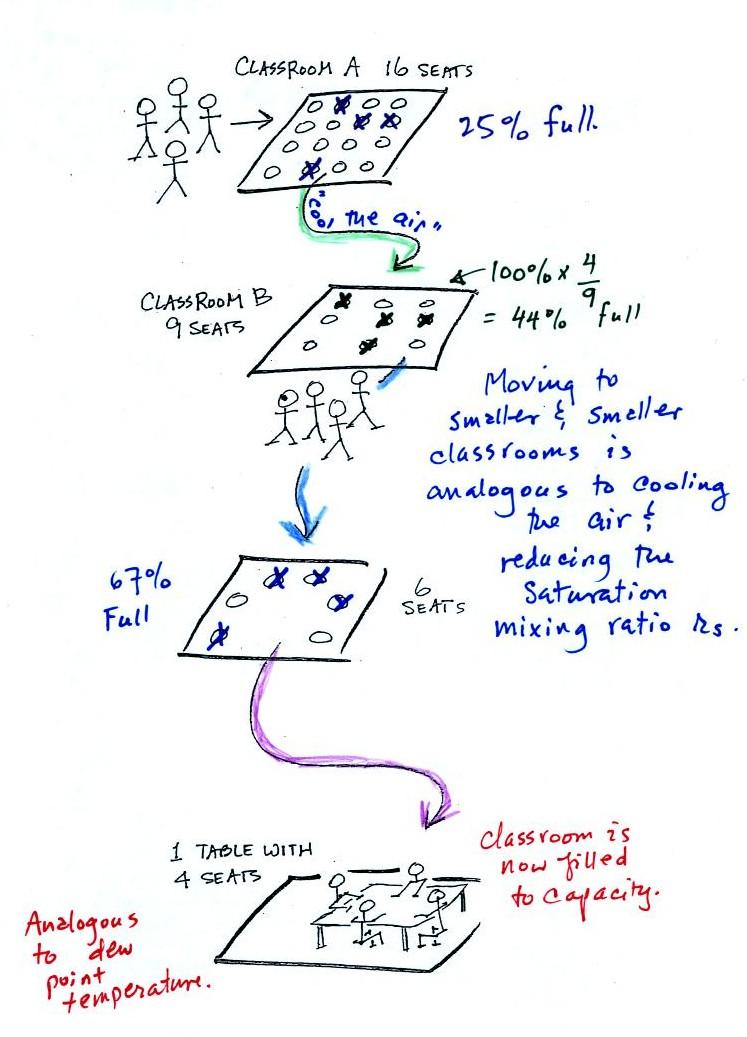
The 4 students move into classrooms of
smaller and smaller capacity. The decreasing capacity of
the classrooms is analogous to the decrease in
saturation mixing ratio that occurs when you cool air.
Eventually the students move into a classroom that they just
fill to capacity. This is analogous to
cooling the air to the dew point.