Step #3 Two vertical forces
acting on a parcel of air in the atmosphere
Let's start with a parcel
of air that is neutrally buoyant. I.e. it doesn't rise
or sink, it hovers.
How is this possible? We know that gravity exerts a
downward force on the air parcel (shown in the left figure
below). What keeps it from sinking? There must
be an upward force of equal strength to cancel out the
effect of gravity.
The upward force is
produced by the air surrounding the parcel that pushes on
the bottom, top, and sides of the volume of air.
Pressure decreases with increasing altitude. So the
pressure pushing upward at the bottom of the parcel is a
little stronger than the pressure downward on the top of the
balloon. The overall effect is an upward pressure difference
force.
The strength of the upward pressure
difference force depends on the distance between the top and
bottom of the balloon.
Now we will look at what happens if we warm or cool the
volume of air.
When we warm the air parcel its volume will
increase. The density of the air inside the parcel
will decrease but the parcel's weight stays the same; it
still contains the same amount (mass) of air. The
pressure difference force has increased because the distance
between the top and bottom of the parcel is larger.
The upward pressure difference force is now stronger than
the downward gravity force (the weight). The net force
is upward and the parcel will rise.
When you cool the air the volume shrinks. The pressure
difference force becomes weaker. The volume still
contains the same amount of air so its weight hasn't
changed. The downward force is now stronger than the
upward force. The net force is downward and the parcel
will sink.
Convection demonstration
Here's
a short demonstration of the role that density plays in
determining whether a balloon will rise or sink (or hover)

We will use
balloons filled with helium (see bottom of page54 in the
photocopied Class Notes). Helium is less dense
than air even when it has the same temperature as the
surrounding air. The downward gravity force
(weight of the helium filled balloon) is weaker than the
upward pressure difference force. You don't need
to warm a helium-filled balloon to make it rise.
We
dunk the helium filled balloon in liquid nitrogen to cool it
off. When you pull the balloon out of the liquid
nitrogen it has shrunk. The helium is denser than the
surrounding air. I set it on the table (dark
blue labels above) and it just sat there.
As the balloon of helium warms and expands its density
decreases (light blue label). For a brief moment it
has the same density as the surrounding air. It's
neutrally buoyant at this point, it would hover. Then
it warms back to near room temperature where it is again
finds itself less dense than the air and lifts off the
table.
Free convection
Free convection is one way of causing
rising air motions in the atmosphere. We will soon see
that rising air is important because it can lead to cloud
and storm formation.
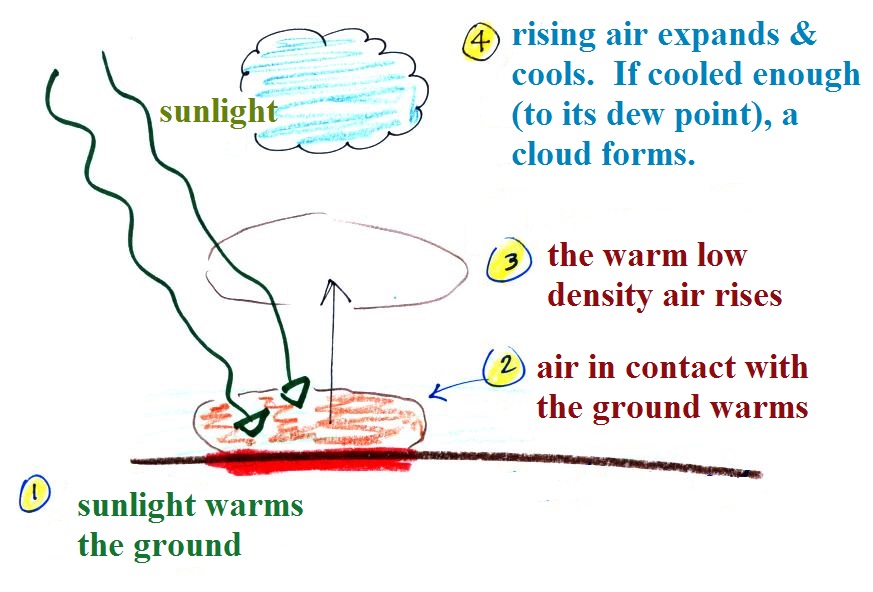
Sunlight shines through the
atmosphere. Once it reaches the ground at (1) it is
absorbed and warms the ground. This in turns warms air
in contact with the ground (2) As this air warms, its
expands and its density starts to decrease (pressure is
staying constant). When the density of the warm air is
low enough (lower than the surrounding air), small "blobs"
of air separate from the air layer at the ground and begin
to rise, these are called "thermals." (3) Rising air
expands and cools (we've haven't covered this yet and it
might sound a little contradictory). If it cools
enough (to the dew point) a cloud will become visible as
shown at Point 4. This whole process is called
convection; many of our summer thunderstorms start this way.
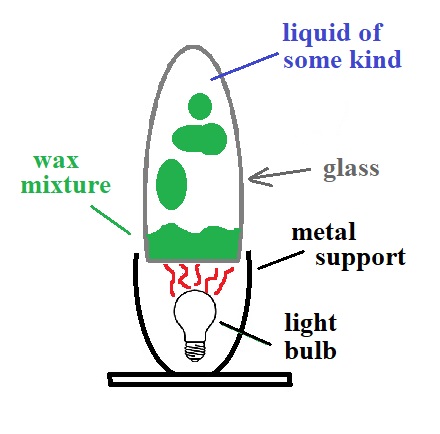
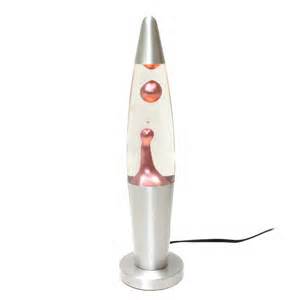
I brought a "lava lamp" to class to give you some
appreciation for what free convection looks like.
The basic construction is shown below at left. A
photograph of an actual lava lamp is shown at right (source
of the image)
 |
|
Heat from the light bulb first of all melts the colored wax
mixture. The melted wax then warms, expands slightly
and its density decreases. Once the density of the
melted wax is lower than the liquid inside the glass, blobs
of wax will float upward. The blobs will bump into
each other and sometimes break into smaller blobs.
Near the top of the lamp the blobs must cool enough to
become slightly denser than the liquid and they will sink
back toward the bottom of the lamp. Here's a short video
showing an operating lava lamp.
Archimedes' principle
Here's another way of trying to understand
why warm air rises and cold air sinks - Archimedes Law or
Principle (see page 54a
& page 54b in
the ClassNotes). It's perhaps a simpler
way of understanding the topic. A gallon bottle of
water can help you to visualize the law.
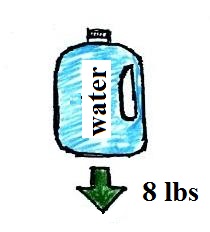
A gallon of water weighs
about 8 pounds (lbs). I wouldn't want to carry that
much water on a hike unless I thought I would really need
it.
Here's something that is kind of surprising.
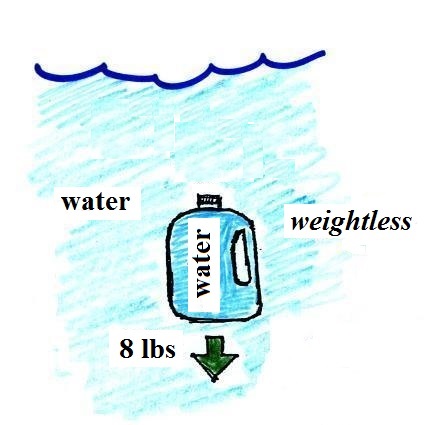
If you submerge the gallon of
water in a swimming pool, the jug becomes, for all
intents and purposes, weightless. The weight of
the water (the downward gravity force) doesn't just go
away. Once the jug is immersed, there must be an
upward force of some kind, one that can cancel out
gravity. Archimedes' recognized that this would
happen and was able to determine how strong the upward
force would be.
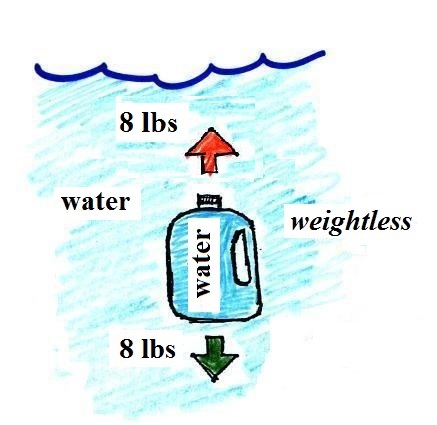
The strength of the upward buoyant force is the weight
of the fluid displaced by the bottle. In this case
the 1 gallon bottle will displace 1 gallon of pool
water. One gallon of pool water weighs 8
pounds. The upward buoyant force will be 8 pounds,
the same as the downward force. The two forces are
equal and opposite.
What Archimedes law doesn't really tell you is
what causes the upward buoyant force. You should
know what the force is - it's the upward pressure
difference force.
|
|
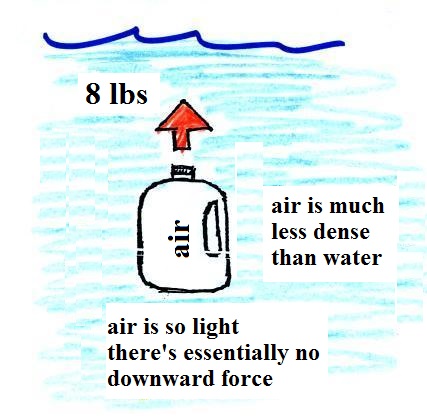
| We've poured out the water and
filled the 1 gallon jug with air. Air is much
less dense than water; compared to water, the
jug will weigh practically nothing. But it still
displaces a gallon of water and experiences the 8 lb.
upward buoyant force. The bottle of air would
rise (actually it shoots) up to the top of the pool. |
The density of the material inside
and outside the bottle are the same. A
bottle filled with water is weightless. |
Next we'll fill the bottle with
something denser than water (I wish I had a gallon of
mercury)
|
|
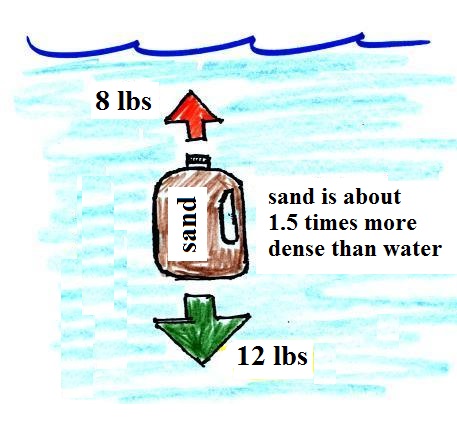
| Sand is about 50% denser than
water. The weight of a gallon of sand is
more than a gallon of water. The downward
force is greater than the upward force and the
bottle of sand sinks. |
|
You can sum all of this up by
saying anything that is less dense than water will float
in water, anything that is more dense than water will sink
in water.
Most types of wood will float
(ebony and ironwood will sink). Most rocks sink
(pumice is an exception).
The fluid
an object is immersed in doesn't have to be water,
or even a liquid for that matter. You could
immerse an object in air. So we can apply
Archimedes Law to parcels of atmospheric air.

Air that is less dense
(warmer) than the air around it will rise. Air that is
more dense (colder) than the air around it will sink.
Here's a little more
information about Archimedes.
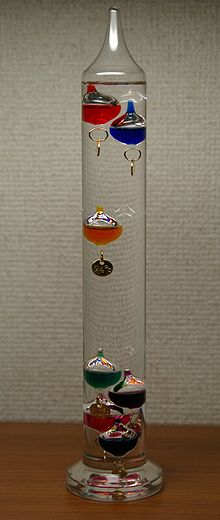
I want to show one last application
of some of what we have been learning - a Galileo
thermometer. That's assuming it survives the trip
from my office to our classroom. It's fairly
fragile.
Here's an explanation of how/why a
Galileo thermometer works. It requires some time to
process.
Just like air, the fluid in the thermometer will expand
slightly if it warms. It will shrink when it cools.
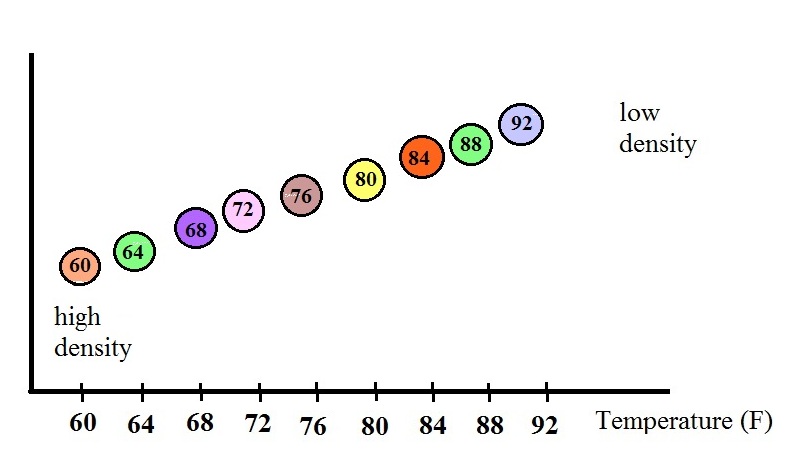
The changes in the volume of the fluid
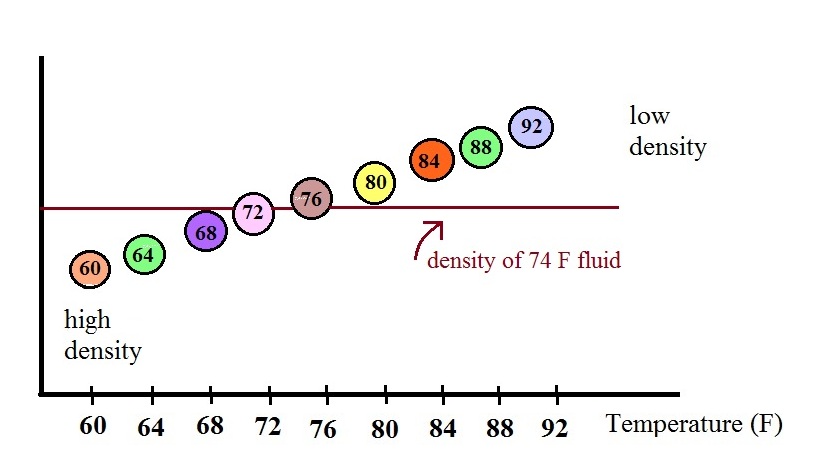
will change the fluid's density. The graph above shows
how the fluid density might change depending on
temperature. Note lower densities are found near the
top of the graph (the fluid expands as it warms).
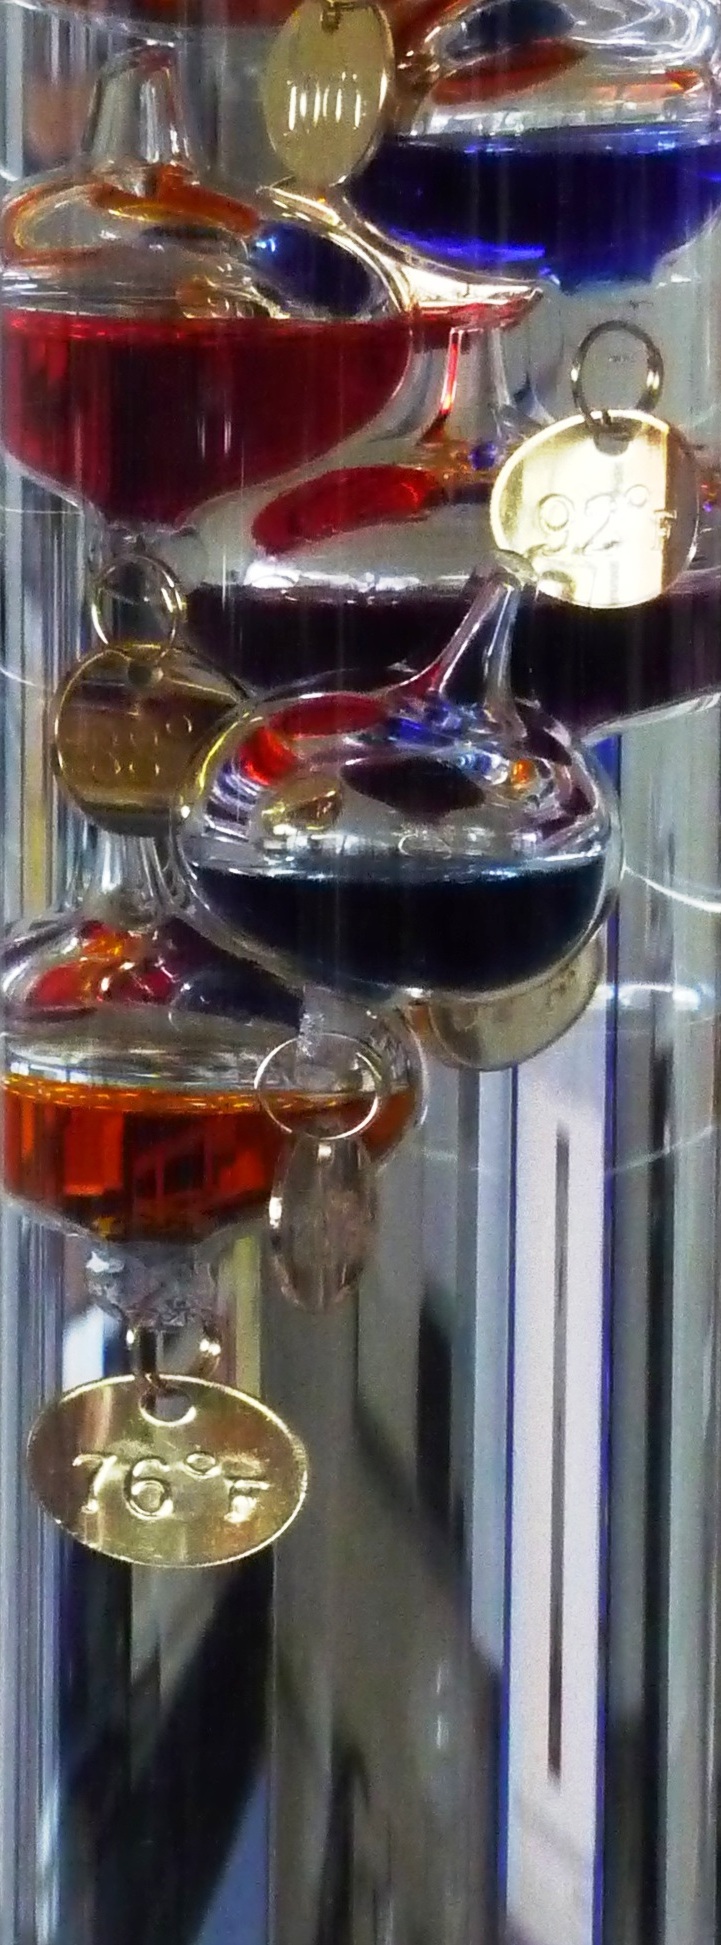
The colored
balls in the thermometer all have slightly different
densities. They also all have little temperature
tags. The 60 F ball has a density equal to the density
of the fluid at 60 F. The 64 F ball has a
slightly lower density, the density of the fluid when it has
warmed to 64 , and so on. The densities of the floats
don't change.
|
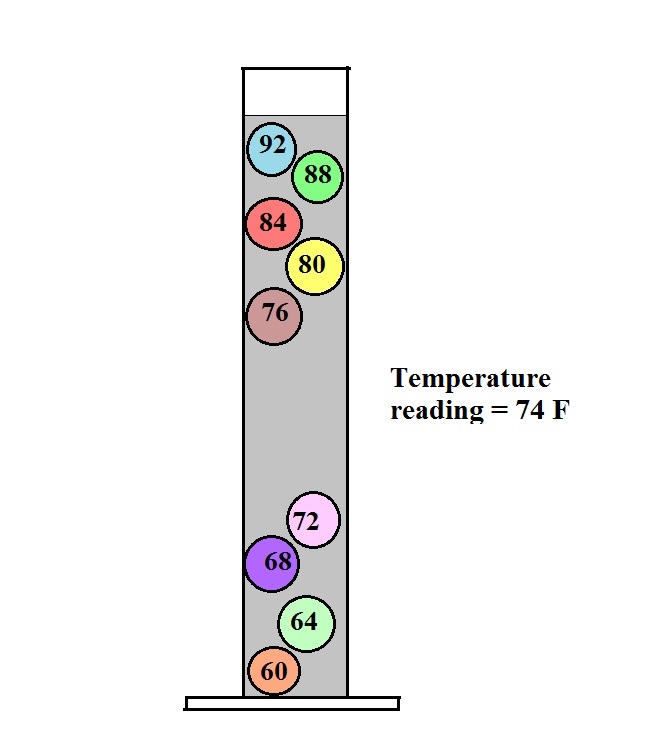 |
In use the density of the
fluid in the thermometer will change depending on the
temperature. The densities of the balls remain
constant. As an example we will that the fluid in the
thermometer has a temperature of 74 F. The 60, 64, 68,
and 72 F balls will all have densities higher than the fluid
(they lie below the 74F line in the graph above) and will
sink. The remaining balls have densities lower than
the fluid and will float.
The lower most floating ball in the illustration has a 76
F temperature tag. The uppermost of the balls that
have sunk reads 72 F. The temperature is something
between 72 F and 76 F. With this thermometer you can
only determine temperature to the nearest 4 F. Also
the thermometer takes quite a while to respond to a change
in temperature (may be an hour or two.
Here's another one
of those abrupt changes from one topic to another
completely different topic
|
Surface
weather maps
We
will begin by learning how weather data are
entered onto surface weather maps.
Much of
our weather is produced by relatively large
scale (synoptic scale) weather systems -
systems that might cover several states or a
significant fraction of the continental
US. To be able to identify and locate
these weather systems you must first collect
weather data (temperature, pressure, wind
direction and speed, dew point, cloud cover,
etc) from stations across the country and
plot the data on a map. The large
amount of data requires that the information
be plotted in a clear and compact way.
The station model notation is what
meteorologists use.
Station model notation
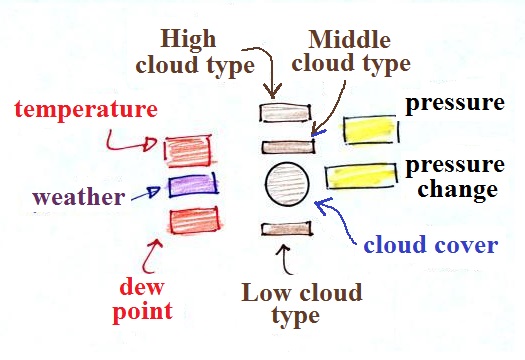
A small circle is plotted on the map at the
location where the weather measurements were made.
The circle can be filled in to indicate the amount of
cloud cover. Positions are reserved above and
below the center circle for special symbols that
represent different types of high, middle, and low
altitude clouds. The air temperature and dew point
temperature are entered to the upper left and lower left
of the circle respectively. A symbol indicating
the current weather (if any) is plotted to the left of
the circle in between the temperature and the dew point;
there are close to 100 different weather symbols that
you can choose from. The pressure is plotted to
the upper right of the circle and the pressure change
(that has occurred over the past 3 hours I believe) is
plotted to the right of the circle.
Here's an example of a surface map from
the Dept. of Hydrology and Atmospheric Science
web page. This is the 1 pm map from last
Tuesday, Sep. 3 (Hurricane Dorian was moving
away from the Bahamas and up the Florida
coast). I'll try to show a current map
in class. Maps like this are available here. The
Arizona portion of the map is shown
below. The data for Tucson are circled
and blown up in the lower right part of the
figure.

In Tucson at 1 pm MST last Tuesday the
temperature was 98 F and the dew point
temperature was 57 F. The winds were
from the NW at 5 knots and clear skies were
being reported. The pressure (corrected
to sea level altitude) was 1008.7 mb (this is
derived from the 087 value to the upper right
of the circle).
We'll work through
this material one step at a time (refer to page
37a in the ClassNotes).
Cloud cover and cloud type
Meterologists determine
what fraction of the sky is covered with clouds and note
what types of clouds are present.

The center circle is filled in to
indicate the portion of the sky covered with clouds (to the
nearest 1/8th of the sky) using the code at the top of the
figure (which I think you can mostly figure out).
5/8ths of the sky is covered with clouds in the example
shown.
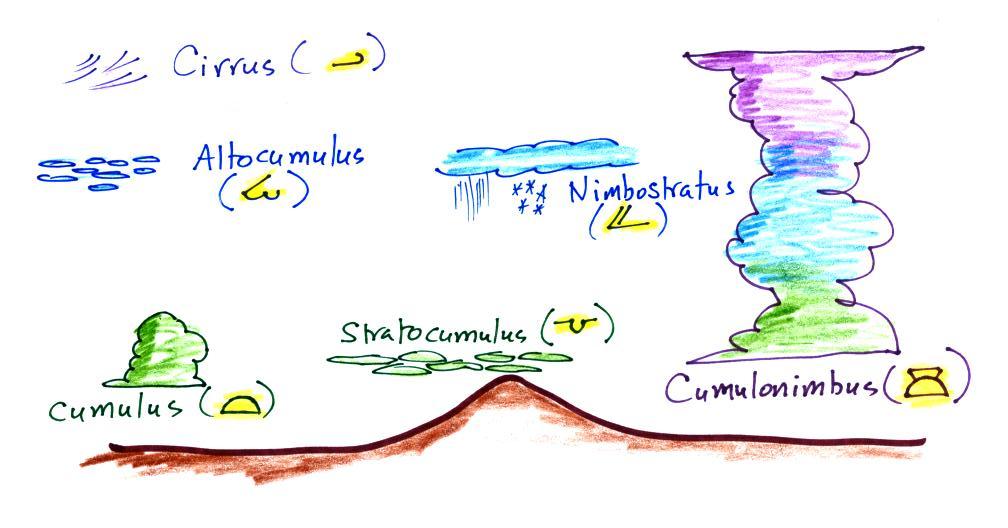
In addition to the amount of cloud coverage, the actual
types of clouds present (if any) can be important.
Cloud types can tell you something about the state of the
atmosphere (thunderstorms indicate unstable conditions, for
example). We'll learn to identify and name clouds
later in the semester and will just say that clouds are
classified according to altitude and appearance.
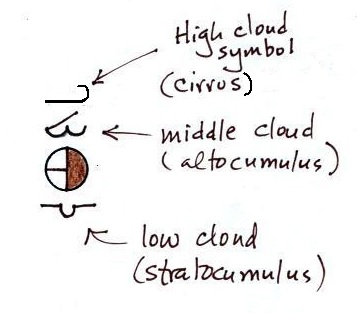
Positions are reserved above
and below the center circle for high, middle, and low
altitude cloud symbols. Six cloud types
and their symbols are sketched above. Purple
represents high altitude in this picture. Clouds
found at high altitude are composed entirely of ice
crystals. Low altitude clouds are green in the
figure. They're warmer than freezing and are
composed of just water droplets. The middle
altitude clouds in blue are surprising. They're
composed of both ice crystals and water droplets
that have been cooled below freezing but haven't frozen.
There are many more cloud symbols than shown
here(click here
for a more complete list of symbols together with
photographs of the different cloud types. You can
click on any of the cloud images to get a larger picture and
additional examples of each cloud type)
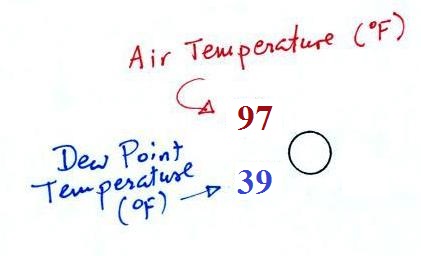
Air temperature and dew point temperature
The air temperature and dew point temperature are found
to the upper left and lower left of the center circle,
respectively. These are probably the easiest items to
read.
Dew point gives you an idea of the
amount of moisture (water vapor) in the air. The
table below reminds you that dew points range from the mid
20s to the mid 40s during much of the year in Tucson.
Dew points rise into the upper 50s and 60s during the summer
thunderstorm season and the dew point was still pretty high
this morning. The summer thunderstorm should be coming
to an end in the next week or so and we should notice the
drop in humidity when that occurs.
Dew Point
Temperatures (F)
|
|
70s
|
common in many parts of the
US in the summer
|
50s & 60s
|
summer T-storm season in
Arizona (summer monsoon)
|
20s, 30s, 40s
|
most of the year in Arizona
|
10s or below
|
very dry conditions
|
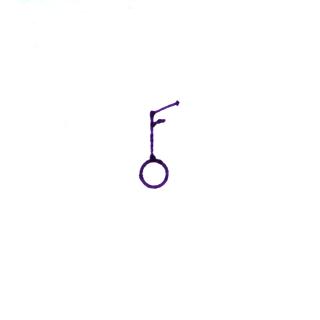
Wind direction and wind speed
We'll consider winds next. Wind
direction and wind speed are plotted(page
37b in the ClassNotes)
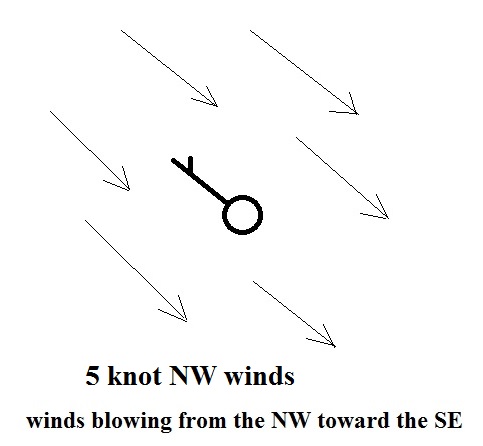
A straight line
extending out from the center circle shows the wind
direction. Meteorologists always give the
direction the wind is coming from. In the example
above the winds (the finely drawn arrows) are blowing from
the NW toward the SE at a speed of 5 knots. A
meteorologist would call these northwesterly winds.
Small "barbs" at the end of the straight
line give the wind speed in knots. Each long barb is
worth 10 knots, the short barb is 5 knots. The wind
speed in this case is 5 knots. If there's just a short
barb it's positioned in from the end of the longer line (so
that it wouldn't be mistaken for a 10 knot barb).
Knots are nautical miles per hour. One nautical
mile per hour is 1.15 statute miles per hour. We won't
worry about the distinction in this class, we will just
consider one knot to be the same as one mile per
hour. It's fine with me in the example above if
you say the winds are blowing toward the SE as long as
you include the word toward.
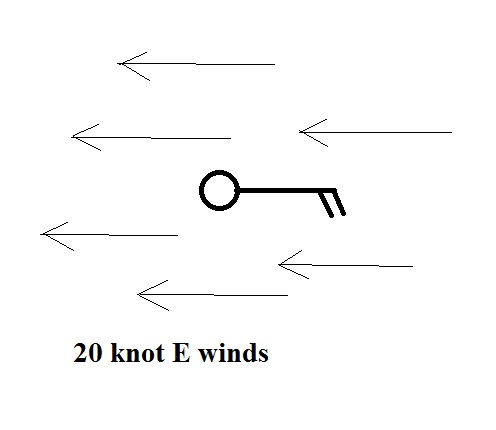
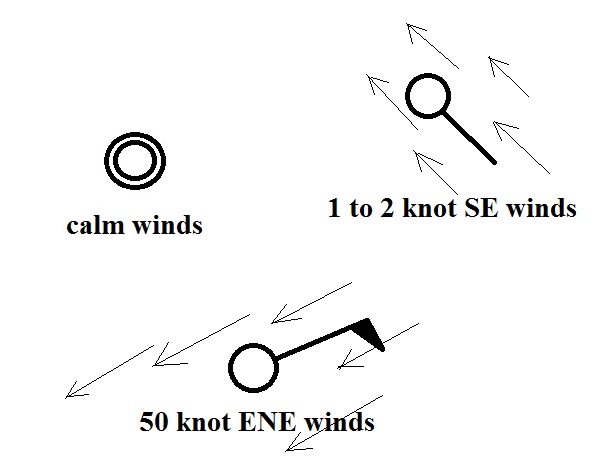
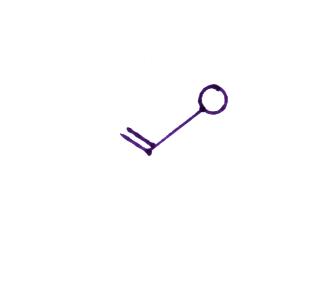
Winds blowing from the east at 20 knots.
A few more examples of wind directions
(provided the wind is blowing) and wind speeds. Note
how calm winds are indicated. Note also how 50 knot
winds are indicated.
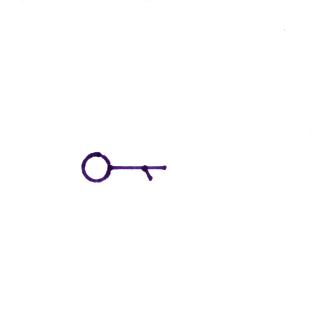
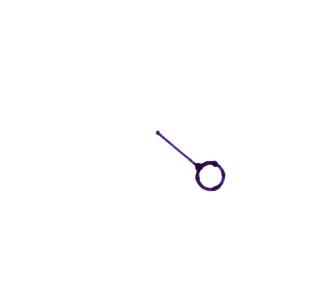
Here are four more examples to practice
with. Determine the wind direction and wind speed in
each case. Click here
for the answers.
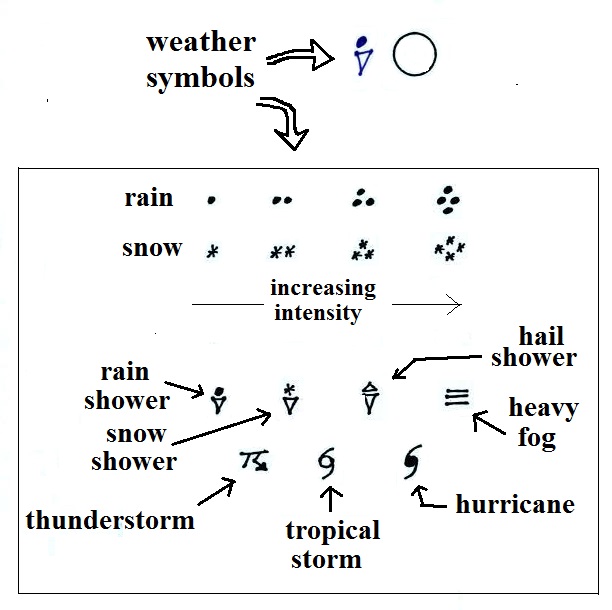
Weather (that
may be occurring when the observations were made)
And maybe the most interesting part.
A symbol representing the weather that
is currently occurring is plotted to the left of the center
circle (in between the temperature and the dew point).
Some of the common weather symbols are shown. There
are about 100
different weather symbols that you can choose
from.


