Airborne particulate matter
collected on the surface of a tree leaf (source).
These particles are pretty small with diameters of 1 to
2 µm.
According to the source, trees capture
appreciable amounts of particulate matter and remove it from
the air in urban areas.
Sources of particulate
matter
Particulate matter can be produced
naturally (wind blown dust, clouds above volcanic eruptions,
smoke from lightning-caused forest and brush fires).
Many human activities also produce particulates (automobile
exhaust for example). Gases sometimes react in the
atmosphere to make small drops or particles (this is what
happened in the photochemical smog demonstration). Just
the smallest, weakest gust of wind is enough to keep these
small particles suspended in the atmosphere.
A recent study estimates that more than 3.2 million people
die each year across the globe because of exposure to
unhealthy levels of PM25 (click here
to see a summary and some discussion of the study and here
to see the study itself). Again, PM25 refers to
particles with diameters of 2.5 micrometers (µm)
or less; particles this small can penetrate deeply into the
lungs. The study also attempted to determine the sources
of the PM25 pollution. The figure below summarizes their
findings. Information like
this is important because you need to know what is adding
particulate matter to the air if you want to try and
reduce emissions.

CBS news has ranked the 30
cities in the world with
the
most polluted air (based on World Health Organization
data for 2016) (https://www.cbsnews.com/pictures/the-most-polluted-cities-in-the-world-ranked/
). The report is interesting because there is a
photograph of each location and more detailed information
about the source of the pollution. Here is some of
what was mentioned: sandstorms, vehicle exhaust, aluminum
production, deforestation, burning waste, coal burning
power plants, oil production, leather tanning, brick
factories, chemical factories, burning tires to extract
iron, steel mills. Cities in China, India, Pakistan,
Iran, and Saudi Arabia appear multiple times in the list.

This map shows where some of the most polluted places on
earth are located (PM25 pollution) and comes from a
World Health Organization report "Exposure to ambient
air pollution from particulate matter for 2016" (http://www.who.int/airpollution/data/AAP_exposure_Apr2018_final.pdf?ua=1).
The 2008 Summer Olympics were held in Beijing and
there was some concern that the polluted air would
affect the athletes performance. Chinese
authorities restricted transportation and industrial
activities before and during the games in an attempt
to reduce pollutant concentrations. Rainy
weather during the games may have done the greatest
amount of good.
Clouds and precipitation are the best way
of cleaning pollutants from the air. We'll learn later
in the semester that cloud droplets form on small particles in
the air called condensation nuclei. The cloud droplets
then form raindrops and fall to the ground carrying the
particles with them.
The second main concern with
particulates is the effect they may have on
visibility.
We will look at some
photographs from Beijing
(if that link doesn't work try this
one) where particulate pollution can be quite
severe. Here are some pictures from Harbin,
China (October, 2013). That's about as bad as visibility
can get, visibility in some cases is just a few 10s of
feet. The problem is limited to China, here's a picture
from Paris
(March, 2014) and India
(November, 2017).
|
|
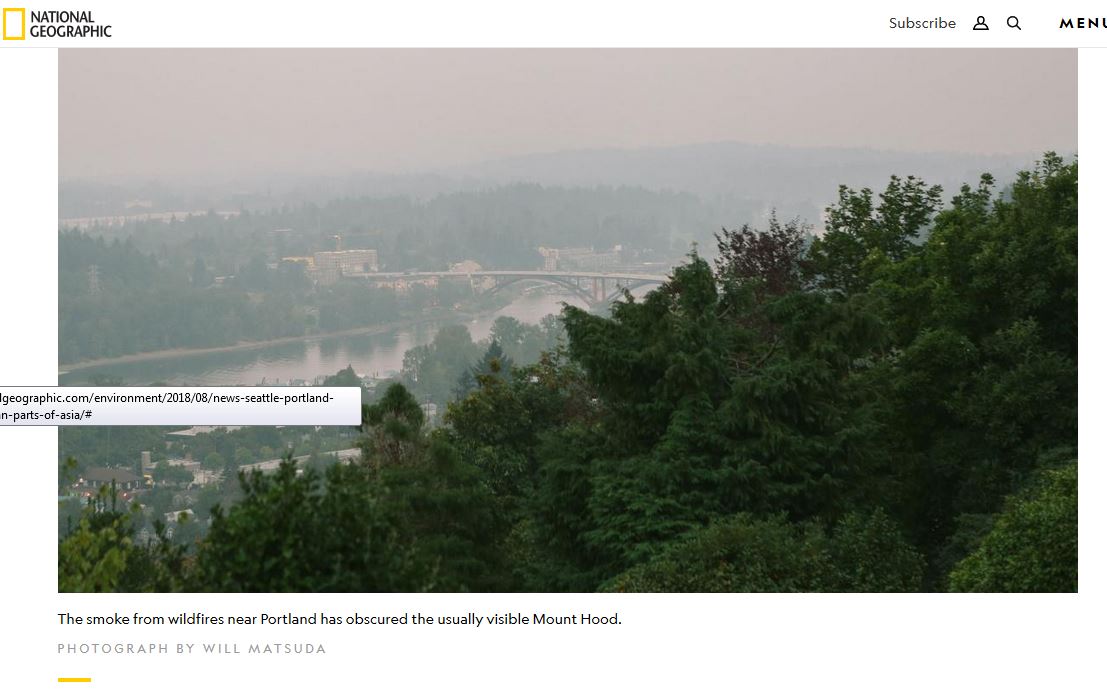
These two
photograph of the smoke in Seattle (left) and Portland
(right) are from the National Geographic article
referenced above.
|
Smoke from fires in California will often
be seen in Tucson. Smoke from Canada and the Pacific
Northwest does also sometimes move into our area.
Satellite photograph taken early in the
Fall 2017 semester (with the new GOES16 satellite) showing
smoke from wildfires burning in Washington, Oregon, Idaho and
Montana being carried across much of the continental US
(Hurricane Harvey is also shown). Smoke from
these fires made it into southern Arizona where, at times, it
had a noticeable effect on visibility.
|
|
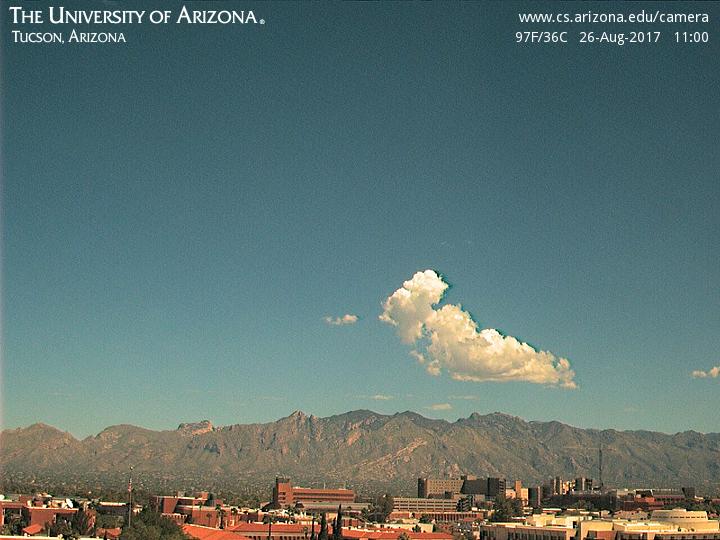
Photograph taken Saturday Aug. 26,
2017 when the air was free of smoke and visibility was
pretty good.
|
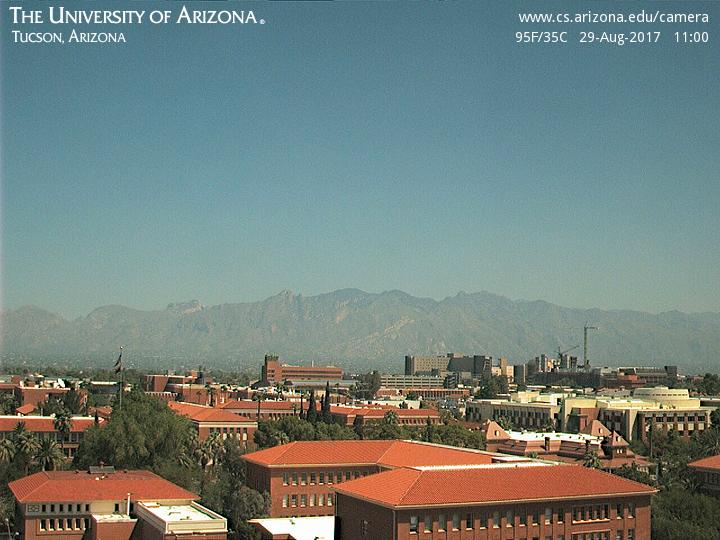
Photograph taken Tuesday on Aug. 29,
2017 when smoke from the fires in the Pacific northwest
was present. There has been a noticeable drop in
visibility.The camera was tilted down slightly in this
picture but the field of view is the same as the other
photograph. |
Abrupt change to
another completely different topic.There is a good
chance that we will not get through all of this
today.
|
Mass,
weight,
density, and pressure.
Pressure
is
a pretty important concept, that's what
we'll start on next. Differences in
atmospheric pressure create winds which
can then cause storms. To better
understand pressure we need to first
review mass and weight.
Weight is something you can feel.
I'll pass an iron bar around in class
(it's sketched below) - lift it and try to
guess it's weight. The fact that it
is a 1" by 1" is significant. More
about the bar later.

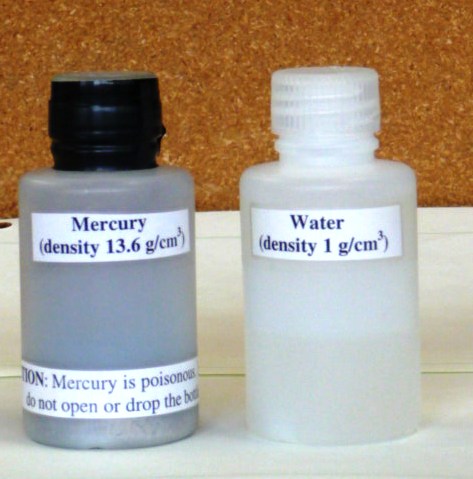
I
used to pass around a couple of small
plastic bottles (see below). One contained
some water, the other an equal volume of
mercury (here's the source
of the nice photo of liquid mercury below at
right). I wanted you to appreciate how much
heavier and denser mercury is compared to
water.
But the plastic bottles have a way of getting brittle with
time and if the mercury were to spill in the classroom the
hazardous material people would need to come in and clean
it up. That would probably take a few days, would be
very expensive, and I would get into a lot of
trouble. So this semester I'll pass around a
smaller, much safer, sample of mercury so that you can at
least see what mercury it looks like (it's a recent
purchase from a
company in London). I'll keep the plastic
bottles of mercury up at the front of the room just in
case you want to see how heavy the stuff is.
 |

|
It
isn't
so much the liquid mercury that is a hazard, but
rather the mercury vapor. Mercury vapor is used
in fluorescent bulbs (including the new energy
efficient CFL bulbs) which is why they need to be
disposed of properly (you shouldn't just throw them in
the dumpster). That is a topic that will come up
again later in the class.
Mercury and bromine are the
only two elements that are found naturally in liquid
form. All the other elements are either gases or
solids.
I am hoping that you will understand and
remember the following statement
atmospheric
pressure
at any level in the atmosphere
depends on
(is determined by)
the weight of the air overhead
We'll
first
review the concepts of mass, weight, and density
but understanding pressure is our main goal.
I've numbered the various sections to help
with organization. There's a summary at the
end of today's notes.
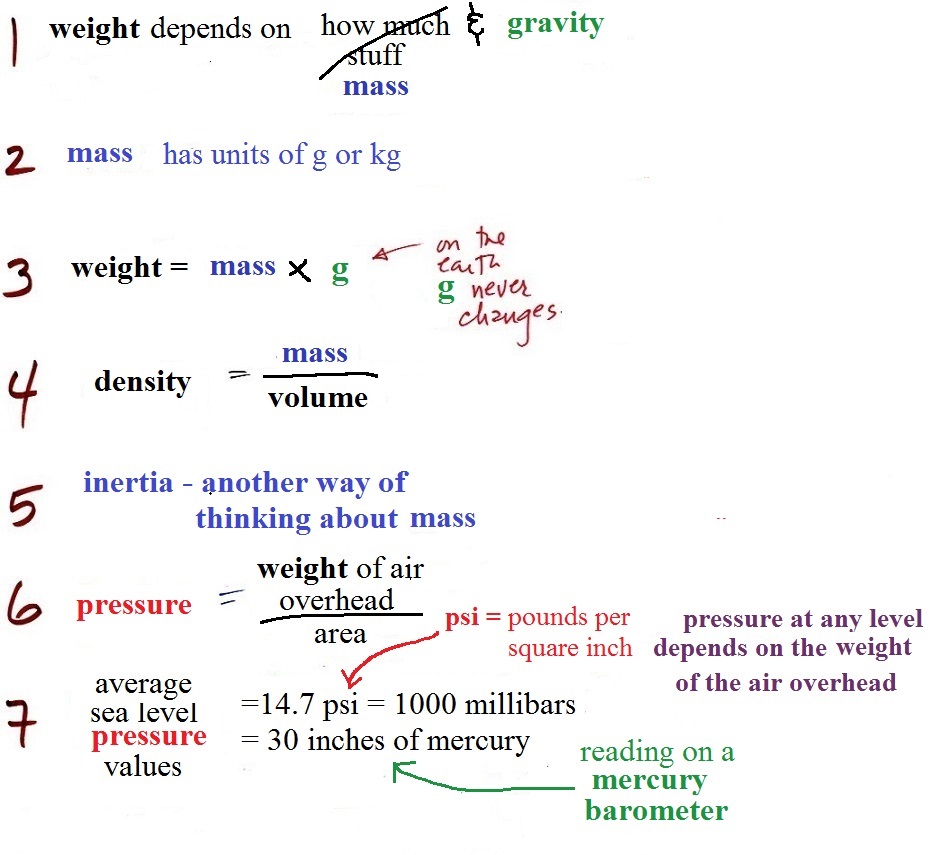
1.
weight
This is a
good place to start because this is something
we are pretty familiar with. We can feel
weight and we routinely measure weight.
A person's weight also
depends on something else.
In outer space away from
the pull of the earth's gravity people are weightless.
Weight depends on the person and on the pull of gravity.
We
measure
weight all the
time. What
units do we
use? Usually
pounds, but
sometimes ounces
or maybe
tons.
Students sometimes
mention Newtons,
those are metric
units of weight
(force).
2.mass
Rather than just saying
the amount of something it is probably better to
use the word mass
It would be possible to have
equal volumes of different materials or the same total
number of atoms or molecules of two different materials,
and still have different masses.
Grams (g) and kilograms (kg) are commonly
used units of mass (1 kg is 1000 g). They're metric
units (slugs are the units of mass in the English
(American) system of units).
3. gravitational
acceleration

On the surface of the earth, weight is
mass times a constant, g, known as
the gravitational acceleration. The
value of g is what tells us about the strength of
gravity on the earth; it is determined by the size and
mass of the earth. On another planet the value of g
would be different. If you click here
you'll find a little (actually a lot) more information
about Newton's Law of Universal Gravitation. You'll
see how the value of g is determined and why it is
called the gravitational acceleration. These aren't
details you need to worry about but they're there just in
case you're curious.
Here's a question to test your understanding.

The masses are all the same. On the
earth's surface the masses would all be multiplied by the same
value of g. The weights would all
be equal. If all 3 objects had a mass
of 1 kg, they'd all have a weight of 2.2 pounds.
That's why we can use kilograms and pounds
interchangeably.
The following figure show a
situation where two objects with the same mass would
have different weights.
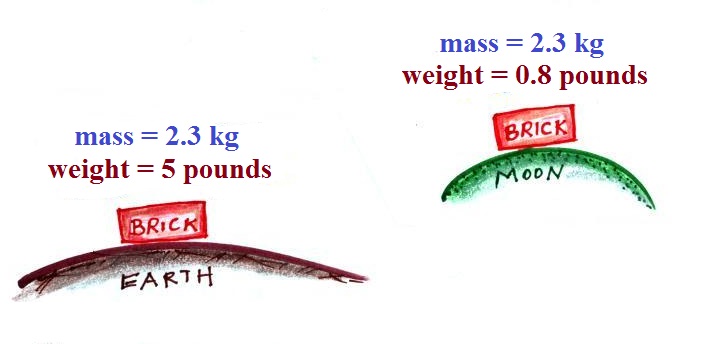
On the earth a brick has a mass of about
2.3 kg and weighs 5 pounds. If you were to travel to
the moon the mass of the brick wouldn't change (it's the
same brick, the same amount of stuff). Gravity on the
moon is weaker (about 6 times weaker) than on the earth
because the moon is smaller and it has less mass, the value
of g on the moon is different than on the
earth. The brick would only weigh 0.8 pounds on the
moon. The brick would weigh almost 12
pounds on the surface on Jupiter where gravity is
stronger than on the earth. On the moon, a brick
would have the same mass, the same volume, the same
density, but a different weight as(than) it would on the
earth.
The
three objects below were not passed around class
(one of them is pretty heavy). The three
objects all have about the same
volumes.
The
point
of all this was to get you thinking about density.
Here we had three objects of about the same size with
very different weights. Different weights means the
objects have different masses (since weight depends on
mass). The three different masses, were squeezed
into roughly the same volume producing objects of very
different densities.
4. density
The three objects were a brick
(in the back), a piece of lead (on the left) and a piece of
wood (redwood) on the right.
The wood is less dense than
water (see the table below) and will float when thrown in
water. The brick and the lead are denser than water
and would sink in water.
We'll be more concerned with air in this
class than wood, brick, or lead.
In the first example
below we have two equal volumes of air but the amount
(mass) of air squeezed into each volume is different
(the dots represent air molecules).
The amounts of air (the masses) in the second example are
the same but the volumes are different. The left
example with air squeezed into a smaller volume has the
higher density.
material
|
density g/cc
|
air
|
0.001
|
redwood
|
0.45
|
water
|
1.0
|
iron
|
7.9
|
lead
|
11.3
|
mercury
|
13.6
|
gold
|
19.3
|
platinum
|
21.4
|
iridium
|
22.4
|
osmium
|
22.6
|
g/cc = grams per cubic centimeter
cubic centimeters are units of volume - one
cubic centimeter is about the size of a sugar cube
1 cubic centimeter is also 1 milliliter (mL)
I would sure like to get my hands on a brick-size
piece of iridium or osmium just to be able to feel
how heavy it would be - it's about 2 times denser
than lead.
Here's a more subtle concept. What if
you were in outer space with the three wrapped blocks of lead,
wood, and brick? They'd be weightless.
Could you tell them apart then? They would still
have very different densities and masses but we wouldn't be
able to feel how heavy they were.
5.
inertia
I think the following illustration will
help you to understand inertia.
Two stopped cars. They are the same size except
one is made of wood and the other of lead. Which
would be hardest to get moving (a stopped car resists
being put into motion). It would take
considerable force to get the lead car going.
Once the cars are moving they resist a change in that
motion. The lead car would be much harder to
slow down and stop.
This is the way you could try
to distinguish between blocks of lead, wood, and brick in
outer space. Give them each a push. The wood
would begin moving more rapidly than the block of lead
even if both are given the same strength push.
I usually don't mention in class that this
concept
of inertia comes from Newton's 2nd law of motion
F = m a
force = mass x acceleration
We can rewrite the equation
a = F/m
This shows cause and effect more clearly. If you
exert a force (cause) on an object it will accelerate
(effect). Acceleration can be a change in speed or a
change in direction (or both). Because the mass is in
the denominator, the acceleration will be less when mass
(inertia) is large.
Not clear we'll have
time to cover the following section in class today.
Here's where we're at
From left to right the brick, the iron bar, the
piece of wood, and the lead block. They're all standing on
end. The weight of the iron bar is still unknown.
Now
we're
close to being
ready to
define (and
hopefully
understand)
pressure.
It's a pretty
important
concept.
A lot of what
happens in the
atmosphere is
caused by
pressure
differences.
Pressure
differences
cause
wind.
Large pressure
differences
(such as you
might find in
a tornado or a
hurricane) can
create strong
and
destructive
storms.
The air that surrounds the earth has mass. Gravity
pulls downward on the atmosphere giving it weight.
Galileo conducted a
simple experiment to prove that air has weight (in
the 1600s).
We
could
add a very
tall 1 inch x
1 inch column
of air to the
picture.
Other than
being a gas,
being
invisible, and
having much
lower density,
it's really no
different from
the other
objects.
6. pressure
Atmospheric pressure
at any level in the atmosphere
depends on (is
determined by)
the weight of the air
overhead
This is one way, a sort of large scale,
atmosphere size scale, way of understanding
air pressure.
Pressure depends on, is determined by, the weight of
the air overhead. To determine the pressure you need
to divide by the area the weight is resting on.
and here we'll apply
the definition to a column of air stretching from
sea level to the top of the atmosphere (the figure
below is on page
23d in the ClassNotes)
Pressure is defined as force divided by area.
Atmospheric pressure is the weight of the air column divided
by the area at the bottom of the column (as illustrated
above).
Under normal conditions a 1 inch by 1 inch column of air
stretching from sea level to the top of the atmosphere will
weigh 14.7 pounds.
Normal atmospheric pressure at sea level is 14.7 pounds per
square inch (psi, the units you use when you fill up
your
car or bike tires with air).
Now back to the iron bar. The bar
actually weighs 14.7 pounds (many people I
suspect think it's heavier than that). When you
stand the bar on end, the pressure at the bottom would be
14.7 psi.

The weight of the 52 inch
long 1" x 1" steel bar is the same as a 1" x 1"
column of air that extends from sea level to the top
of the atmosphere 100 or 200 miles (or more)
high. The pressure at the bottom of both would
be 14.7 psi.
7. pressure units
Pounds per square inch, psi, are
perfectly good pressure units, but they aren't the
ones that meteorologists use most of the time.
Typical sea level pressure is 14.7 psi or
about 1000 millibars (the units used by meteorologists and
the units that we will probably mostly use in this class)
or about 30 inches of mercury (refers to the reading on a
mercury barometer). Milli means 1/1000
th. So 1000 millibars is the same as 1 bar.
You sometimes see typical sea level pressure written as 1
atmosphere.
We covered a lot of
material in the 2nd part of today's class. Here's a
summary of the main points.
Summary


