Severe storms are more
likely to form when there is vertical wind shear (the
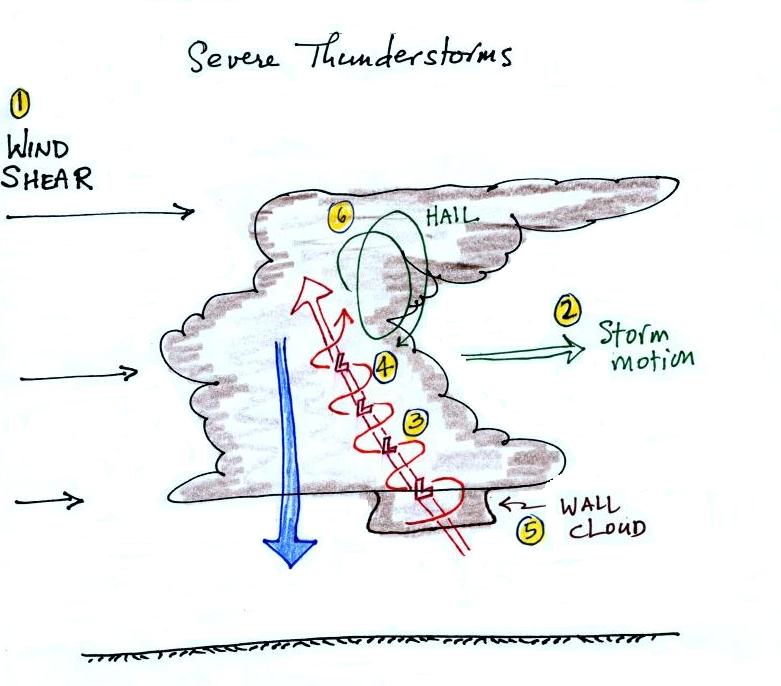
picture above is on p. 154a in the ClassNotes). Wind shear (Point 1)
is changing wind direction and/or wind speed with
distance. In the case shown above, the wind speed is
increasing with increasing altitude, this is vertical wind
shear.
A thunderstorm that forms in this kind of an environment will move at about the
speed of the mid level winds in the picture (pt. 2).
The thunderstorm will move to the right more rapidly than
the air at the ground which is where the updraft
begins. Rising air that is situated at the front
bottom edge of the thunderstorm will find itself at the
back edge of the storm by the time it reaches the top of
the cloud.
This means the storm
will have a tilted updraft, the updraft will tilt toward
the back of the storm (pt. 3). The downdraft is
situated at the back of the ground. The updraft is
continually moving to the right and staying away from the
downdraft. The updraft and downdraft coexist and do
not "get in each others way." If you remember in air
mass thunderstorms, the downdraft gets in the way of the
updraft and leads to dissipation of the storm.
Sometimes
the tilted updraft will begin to rotate. A rotating
updraft is called a mesocyclone (pt. 4). Meso refers to medium size
(thunderstorm or city size) and cyclone means winds
spinning around low pressure (tornadoes are sometimes
called cyclones). Low pressure in the core of the mesocyclone creates an inward
pointing pressure gradient force needed to keep the
updraft winds spinning in a circular path.
The cloud that extends
below the cloud base and surrounds the mesocyclone is called a wall cloud (pt.
5). The largest and strongest tornadoes will
generally come from the wall cloud. We'll see some
pretty dramatic videos of wall clouds on Friday.
Note (pt. 6) that a tilted updraft also provides a way of
keeping growing hailstones inside the cloud.
Hailstones get carried up toward the top of the cloud
where they begin to fall. But
they then fall back into the strong core of the updraft
and get carried back up toward the top of the
cloud. The longer hailstones can stay in the cloud
the larger they can become.

At right the air doesn't have to rise to as high an altitude to experience the same amount of expansion and cooling. This is because it is moving into the core of the rotating updraft where the pressure is a little lower than normal for this altitude. Cloud formation can occur a little bit closer to the ground.

Here's a picture of a portion of the bottom of a thunderstorm with a wall cloud and, what appears to be, a relatively weak tornado (narrow diameter and almost transparent). Photo from the University Corporation for Atmospheric Research
Now on to tornadoes.
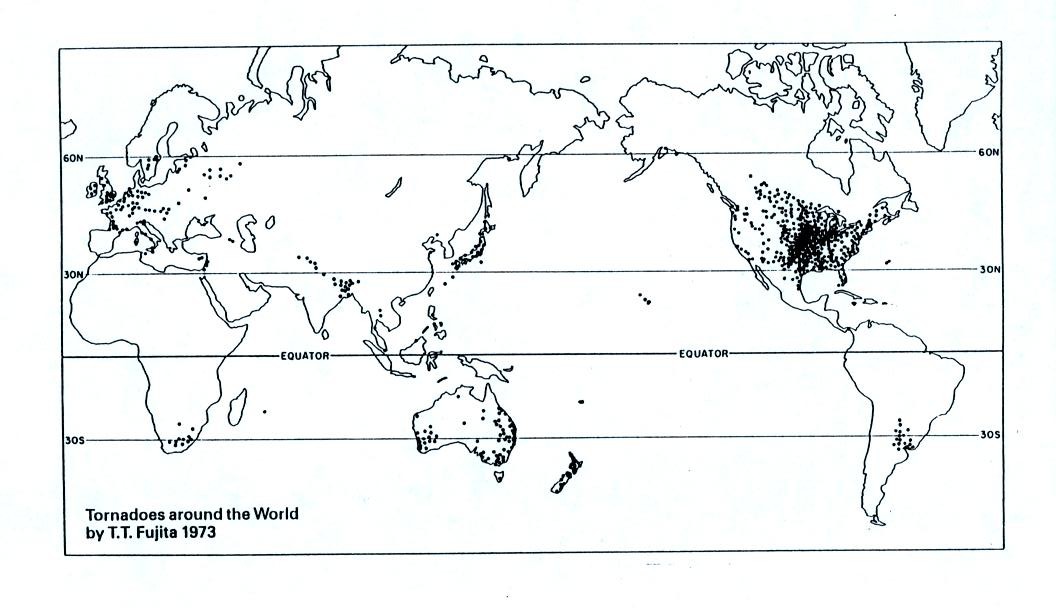
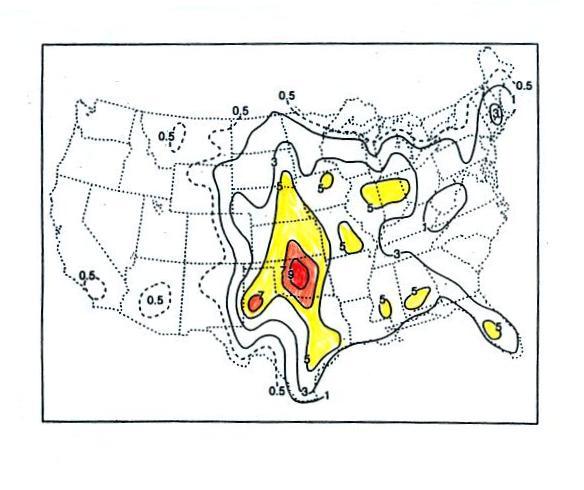
The United States has roughly 1000 tornadoes in an average year. That is more than any other country in the world .

A year's worth of tornado activity plotted on a world map. Note the name at bottom left: T.T. Fujita, "Mr. Tornado." The scale used to rate tornado strength and intensity is named after him.
Part of the reason why the central US has some many tornadoes is just a consequence of geography.


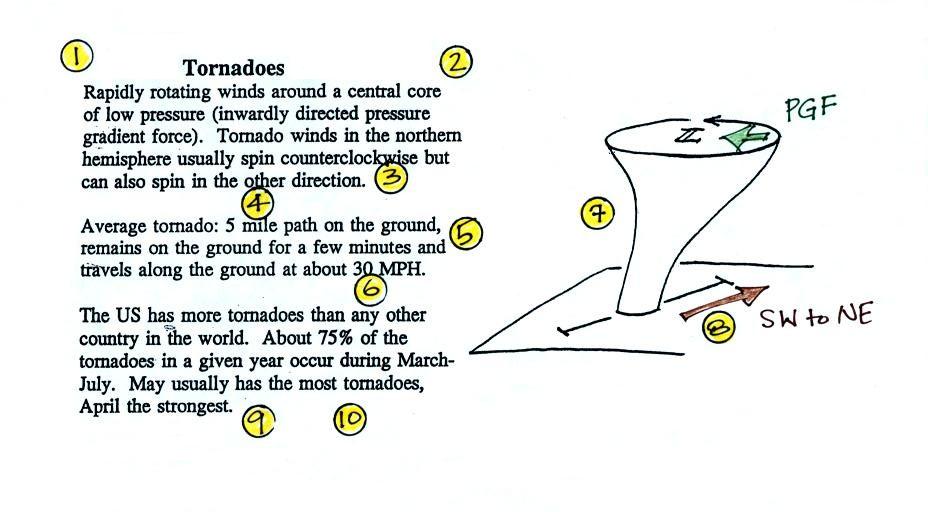
Here are some basic tornado characteristics (the figure above is also on p. 161)
1. About 2/3rds (maybe 3/4) of tornadoes are F0 or F1 tornadoes (this is referring to the Fujita Scale, which we'll learn more about on Friday) and have spinning winds of about 100 MPH or less. Microburst winds can also reach 100 MPH. Microbursts are much more common in Tucson in the summer than tornadoes and can inflict the same level of damage.
2. A very strong inwardly directed pressure gradient force is needed to keep winds spinning in a circular path. The pressure in the center core of a tornado can be 100 mb less than the pressure in the air outside the tornado. This is a very large pressure difference in such a short distance. The PGF is much stronger than the Coriolis Force (CF) and the CF can be neglected.
The same pressure drop can be found in the strongest hurricanes but it takes place over a much larger distance. The PGF isn't as strong and the CF does play a role.
3. Because the Coriolis force doesn't play a role, tornadoes can spin clockwise or counterclockwise, though counterclockwise rotation is more common. This might be because larger scale motions in the cloud (where the CF is important, might determine the direction of spin in a tornado).
4, 5, 6. Tornadoes usually last only a few minutes, leave a path on the ground that is a few miles long, and move at a few 10s of MPH. There are exceptions, we'll look at one shortly.
7, 8. Most tornadoes move from the SW toward the NE. This is because tornado-producing thunderstorms are often found just ahead of a cold front where winds often blow from the SW. Most tornadoes have diameters of 10s to a few 100s of yards but tornadoes with diameters over a mile have been observed. Tornado diameter can also be much larger near the base of the thunderstorm than it is near the ground.
9, 10. Tornadoes are most frequent in the Spring. The strongest tornadoes also occur at that time of year. You don't need to remember the specific months. Tornadoes are most common in the late afternoon when the atmosphere is most unstable.

At the present time about 75 people are killed every year in the United States by tornadoes. This is significantly less than a century ago due to improved methods of detecting tornadoes and severe thunderstorms. Modern day communications also make easier to warm people of dangerous weather situations. Lightning and flash floods (floods are the most serious severe weather hazard) kill slightly more people than tornadoes. Hurricanes kill fewer people on average than tornadoes. The increase in the number of tornadoes observed per year is probably more due to there being more people in locations that are able to observe and report a tornado rather than a true increase in tornado activity.
We didn't have time to cover this material in class today but I included it here anyway.

The April 25-28, 2011 outbreak is now apparently the largest tornado outbreak in US history (358 tornadoes, 346 people killed)
Tornado season is in the spring, so tornado activity and tornado outbreaks in November, like happened last year, is unusual. The outbreak on Sunday Nov. 17, 2013 is one of the largest November outbreaks ever.
As we learn more about tornadoes I'm hoping you'll look at video with a more critical eye than you would have otherwise. So we took a moment, at this point, to have a look at some tornadoes caught on video. I normally show 4 or 5 minutes from a tape called "Tornado Video Classics". But the VCR in the classroom was unresponsive so I've found much of the same footage online and that's what is included below.
The numbers in the left column identified the tornado on the tape. The next column shows the Fujita Scale rating (the scale runs from F0 (weakest) to F5 (strongest). The locations and date are shown next. The last column has comments and things to look for when watching the video segment.
| 54a |
F3 |
Grand Isle NE |
Mar. 13, 1990 |
tornado cloud is pretty thick and vertical |
| 61f |
F3 |
McConnell
AFB
KS |
Apr. 26, 1991 |
this is about as
close to a tornado as you're ever likely to get.
Try to judge the diameter of the tornado cloud.
What direction are the tornado winds spinning? |
| 52 |
F5 |
Hesston
KS |
Mar. 13, 1990 |
Watch closely, you
may see a tree or two uprooted by the tornado winds |
| 51 |
F3 |
North
Platte NE |
Jun. 25, 1989 |
Trees uprooted and
buildings lifted by the tornado winds. The
online video is longer than the one shown in class and
has some good closeup video. See especially the
last couple of minutes of the video |
| 65 |
F1 |
Brainard
MN |
Jul. 5, 1991 |
It's a good thing
this was only an F1 tornado |
| 57 |
F2 |
Darlington
IN |
Jun. 1, 1990 |
Tornado cloud
without much dust |
| 62b |
F2 |
Kansas
Turnpike |
Apr. 26, 1991 |
It's sometimes hard
to run away from a tornado. Watch closely you'll
see a van blown off the road and rolled by the
tornado. The driver of the van was killed! |
| 47 |
F2 |
Minneapolis
MN |
Jul. 18, 1986 |
Tornado cloud
appears and disappears. The online video
compares features seen in this tornado with one
created in a laboratory. |
The online Kansas turnpike video also has a warning that a highway underpass is actually a very dangerous place to take shelter from a tornado. Here is some additional information from the Norman OK office of the National Weather Service. Slide 6 lists some of the reasons why underpasses are so dangerous (many of the same warnings would apply to the people filming the tornado (#61f) as it moved through a parking lot)
Finally here is an example of one of the grade summaries passed out in class (the numbers below are largely class averages)
_______
Doe_J
quiz1 -44 (175 pts possible) 74.9%
quiz2 -48 (150 pts possible) 68.0%
quiz3 -47 (175 pts possible) 73.1%
1.4 EC points (3.0 pts possible)
writing scores: 33.0 (expt/book report) + 31 (1S1P pts)
writing percentage grade estimate: 91.1%
average (no quiz scores dropped): 75.8% + 1.4 = 77.2%
average (lowest quiz score dropped): 78.3% + 1.4 = 79.7%
_______
You'll first find your three quiz scores.
Then the number of extra credit (EC) pts that you have earned on Optional Assignments. This includes the Toilet Flushing Experiment (I gave 0.15 pts to everyone in the class because it was much quicker and easier than entering in individual grades)
Your writing scores are next. At this point everyone should have an experiment score. If you haven't done an experiment (or a book or scientific paper report) you should come see me as soon as you can. The 1S1P pts total does not include the Regional Winds, Foucault Pendulum or Atmospheric Stability worksheet because they haven't been graded yet.
Then there are two averages. If at the end of the semester the first average is 90.0% or above you will not have to take the Final Exam. That grade summary will indicate whether you DO or DO NOT have to take the final. If the first average isn't 90.0% or above then a second average is computed with the lowest quiz score dropped.