Wed., Apr. 2, 2008
The 3rd (and final) 1S1P Assignment is now
available.
Controls of Temperature Optional Assignment answers now online
The Quiz #3 Study Guide is now in its
final form. A couple of small sections were added to the
beginning of the study guide.
The Expt. #4 reports are due next
Monday. You need to bring in your materials this week and pick up
the supplementary information sheet.
The humidity Optional Assignment was collected in class today.
You'll get answers (if not the graded assignment) in class on Friday.
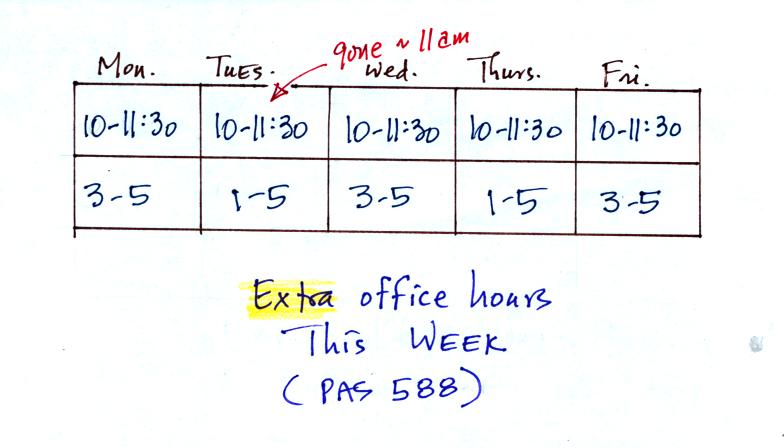
The extra office hours are still in effect for the remainder of this
week.
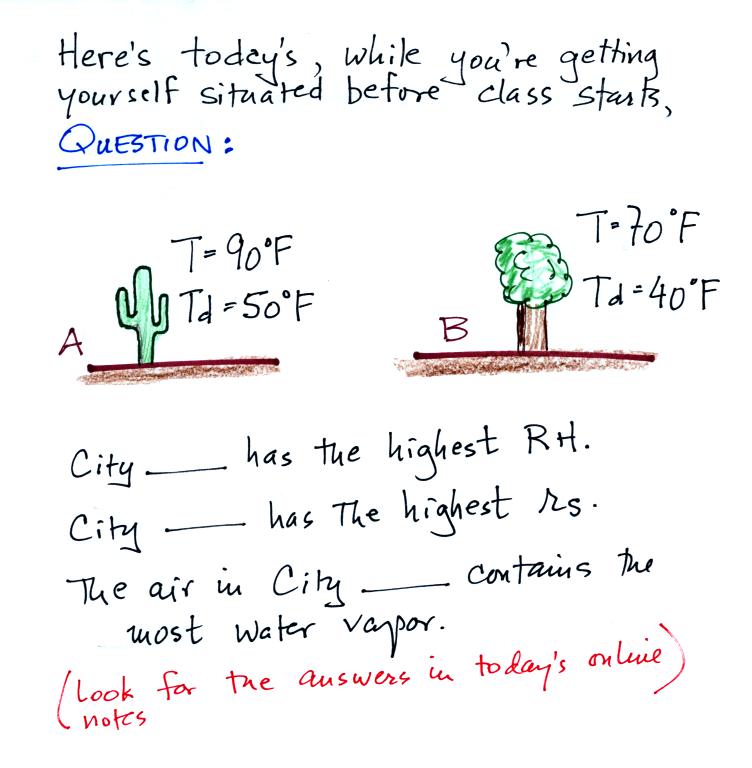
Give this problem an honest try (it's not as difficult as Monday's
question). When you think you have the answers click here.
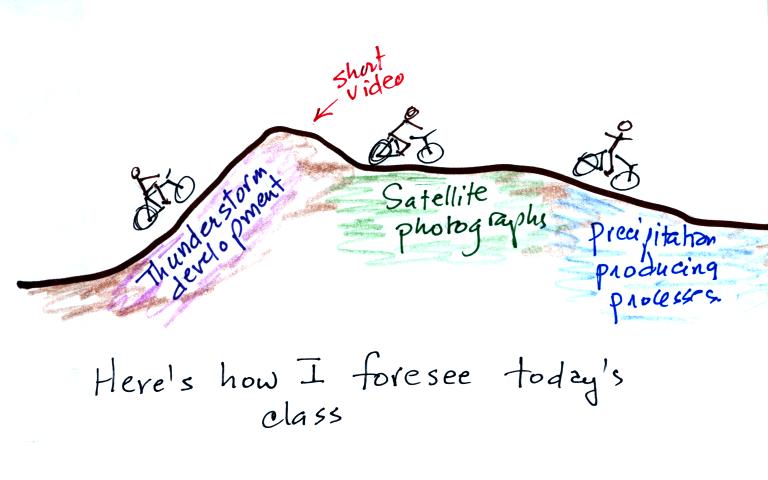
Here's what today's class looks like. We'll start with a long
steep uphill section dealing with thunderstorm development. Then
a relatively flat section on satellite photographs. Both of these
topics relate to clouds which we finished up on Monday. Then a
quick downhill ride to the finish and the start of a new section of
precipitation production (we is not as easy as you might think.)
The
following detailed discussion was intended to
prepare you and allow you to better appreciate a time lapse video movie
of a thunderstorm developing over the Catalina mountains. I don't
expect you to remember all of the details given below. The
figures below are more carefully versions of what was done in class.
Refer back and forth between the lettered points in the
figure
above and the commentary below.
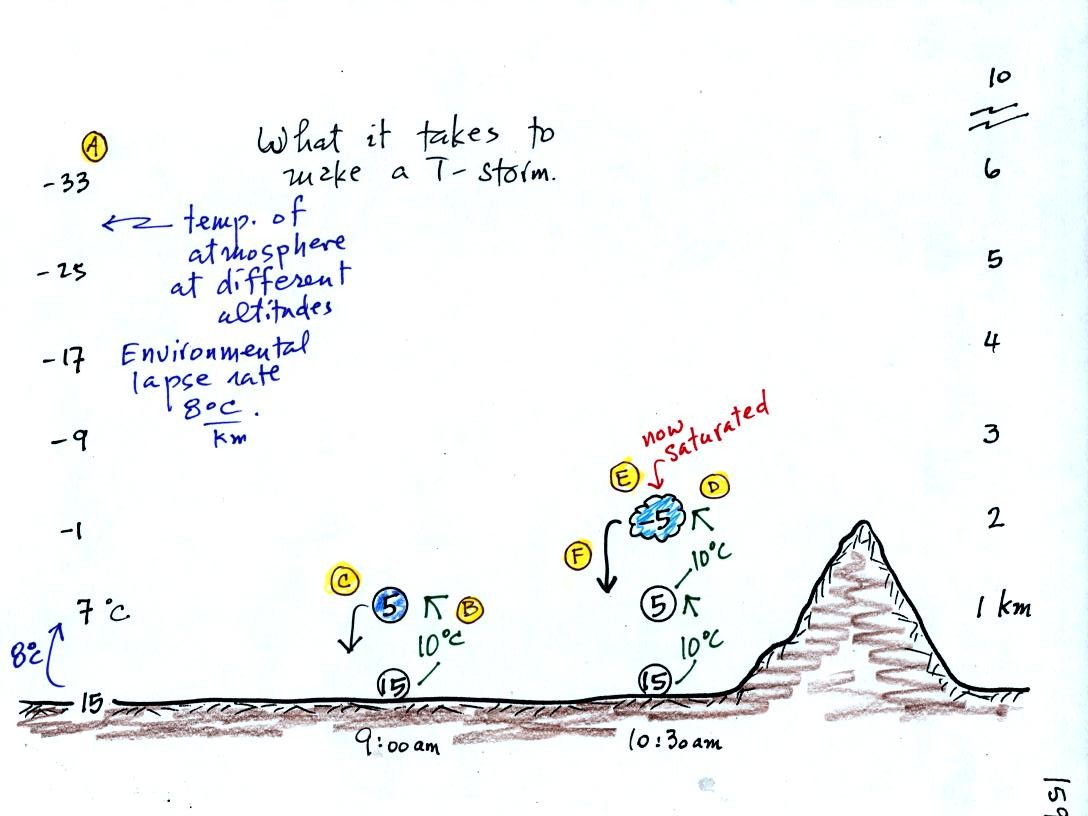
The numbers in Column A
show the temperature of the air in the atmosphere at various altitudes
above the ground (note the altitude scale on the right edge of the
figure). On this particular day the air temperature was
decreasing at a rate of 8 C per kilometer. This rate of decrease
is referred to as the environmental lapse rate. Temperature could
decrease more quickly than shown here or less rapidly.
Temperature in the atmosphere can even increase with increasing
altitude
(a temperature inversion).
At Point B, some of
the surface air is put into an imaginary container, a parcel.
Then a meterological process of some kind lifts the air to 1 km
altitude (in Arizona in the summer, sunlight heats the ground and air
in contact with the ground, the warm air becomes bouyant). The
rising air will expand and cool as it is
rising. Unsaturated (RH<100%) air cools at a rate of 10 C per
kilometer. So the 15 C surface air will have a temperature of 5 C
once it arrives at 1 km altitude.
At Point C note that
the air inside the parcel is slightly colder than the air outside (5 C
inside versus 7 C outside). The air inside the parcel will be
denser than the air outside and, if released, the parcel will sink back
to the
ground.
By 10:30 am the parcel is being lifted to 2 km as shown at Point D. It is still
cooling 10 C for every kilometer of altitude gain. At 2 km, at Point E the
air has cooled to its dew point temperature and a cloud has
formed. Notice at Point
F, the air in the parcel or in the cloud (-5 C) is still colder
and denser than the surrounding air (-1 C), so the air will sink back
to the ground and the cloud will disappear. Still no thunderstorm
at this point.
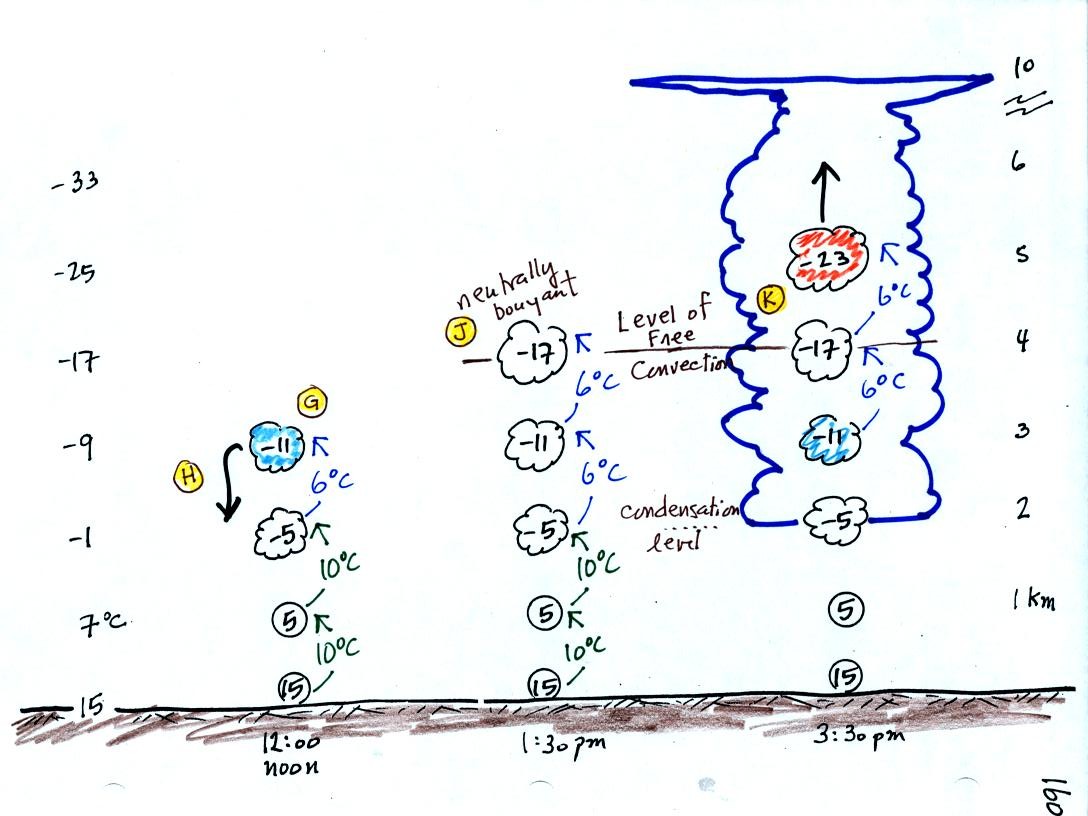
At noon, the air is lifted to 3 km. Because the
air
became saturated at 2 km, it will cool at a different rate
between 2 and
3 km altitude. It cools at a rate of 6 C/km instead of 10
C/km. The saturated air cools more slowly because release of
latent heat
during condensation offsets some of the cooling due to
expansion. The air that arrives at 3km, Point H, is again still
colder than the
surrounding air and will sink back down to the surface.
By 1:30 pm the air is getting high enough that it becomes neutrally
bouyant, it has the same temperature and density as the air around it
(-17 C inside and -17 C outside). This is called the level of
free convection, Point J in the figure.
If you can, somehow or another, lift air above the level of free
convection it will find itself warmer and less dense than the
surrounding air as shown at Point K and will float upward to the top of
the troposphere on its own. This is really the
beginning of a thunderstorm. The thunderstorm will grow upward
until it reaches very stable air at the bottom of the stratosphere.
You'll
find satellite photographs discussed on pps
99-100 in the photocopied class notes (also in the text: pps
240-243 (Chap. 9) in
the 5th eds of the text & pps 236-240 in the 4th edition of the text).
A handout with most of the following figures was distributed in
class. Extra copies should be available in class on Friday.
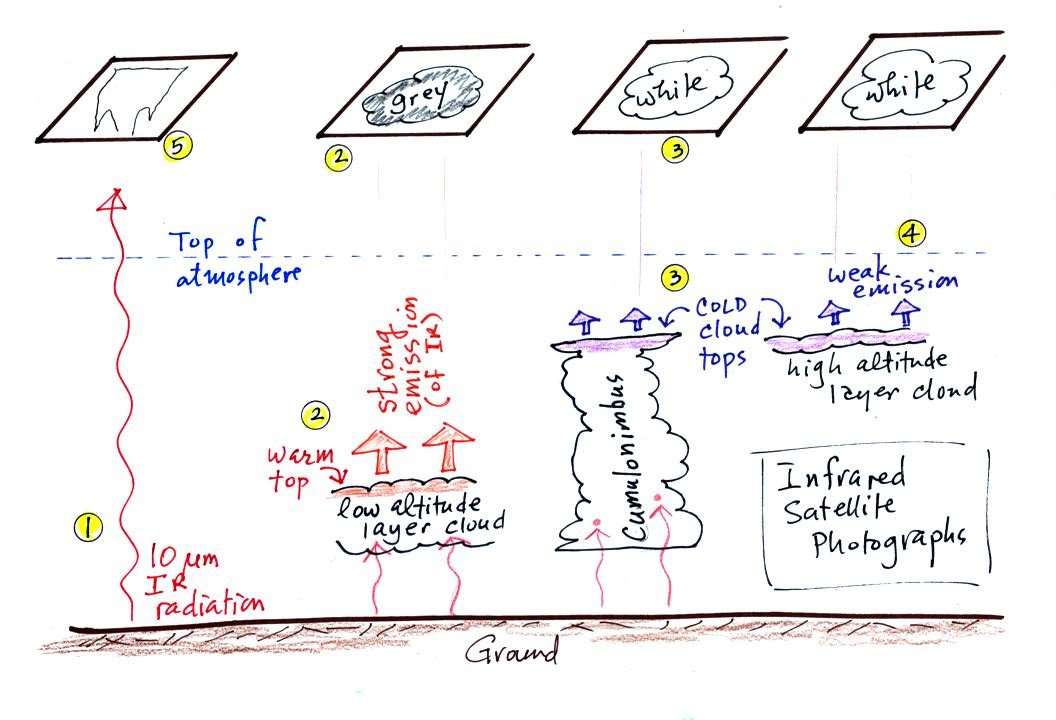
1. An infrared satellite photograph detects the 10 um IR
radiation
actually
emitted by the ground or by clouds. You don't depend on seeing
reflected
sunlight, so clouds can be photographed during the day and at
night. You may recall that 10 um radiation is in the middle of
the atmospheric window, so this radiation is able to pass through air
without being absorbed.
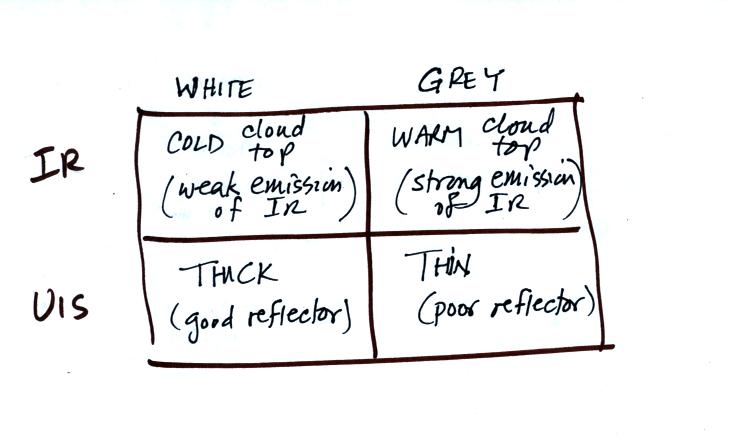
2. Clouds absorb 10 um radiation and then reemit
radiation. The top surface of a low altitude cloud will be
relatively warm. Warmer objects emit IR radiation at a greater
rate or at higher intensity (the Stefan Boltzmann law from Chap.
2).
This is shown as grey on an IR satellite photograph. A
grey unimpressive looking cloud on an IR
satellite photograph may actually be a thick nimbostratus cloud that is
producing a lot of rain or snow.
3. Cloud tops found at high altitude are cold and emit IR
radiation at a lower rate or at lower intensity. This shows up
white on an IR photograph.
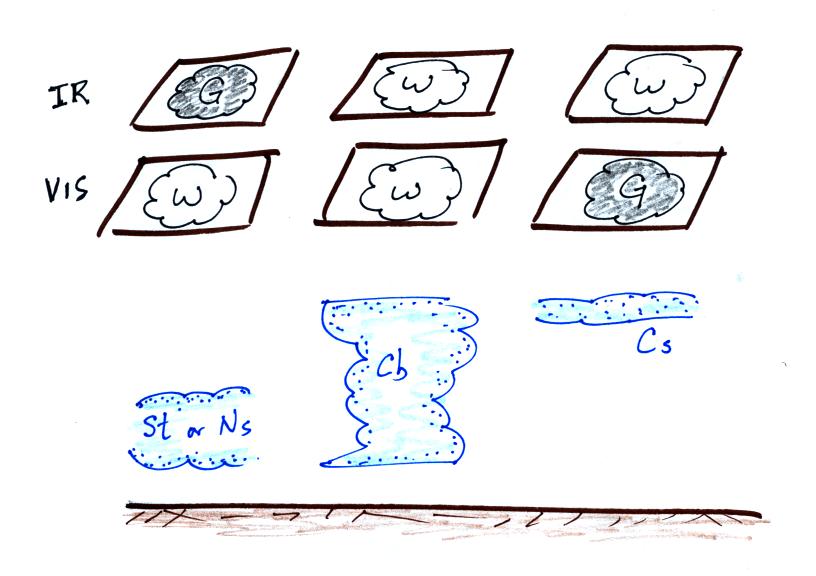
4. Two very different clouds (a thunderstorm and a
cirrostratus cloud) would both appear white on the satellite photograph
and would be difficult to distinquish. Meteorologists are
interested in locating tall thunderstorms as they can produce severe
weather.
5. The ground changes temperature during the course of the
day. On an infrared satellite animation you can watch the ground
change from black (afternoon when
the ground is warmest) to grey (early morning when the ground is cold)
during the course of a day. The ocean right alongside doesn't
change temperature much during the day and remains grey throughout the
day.
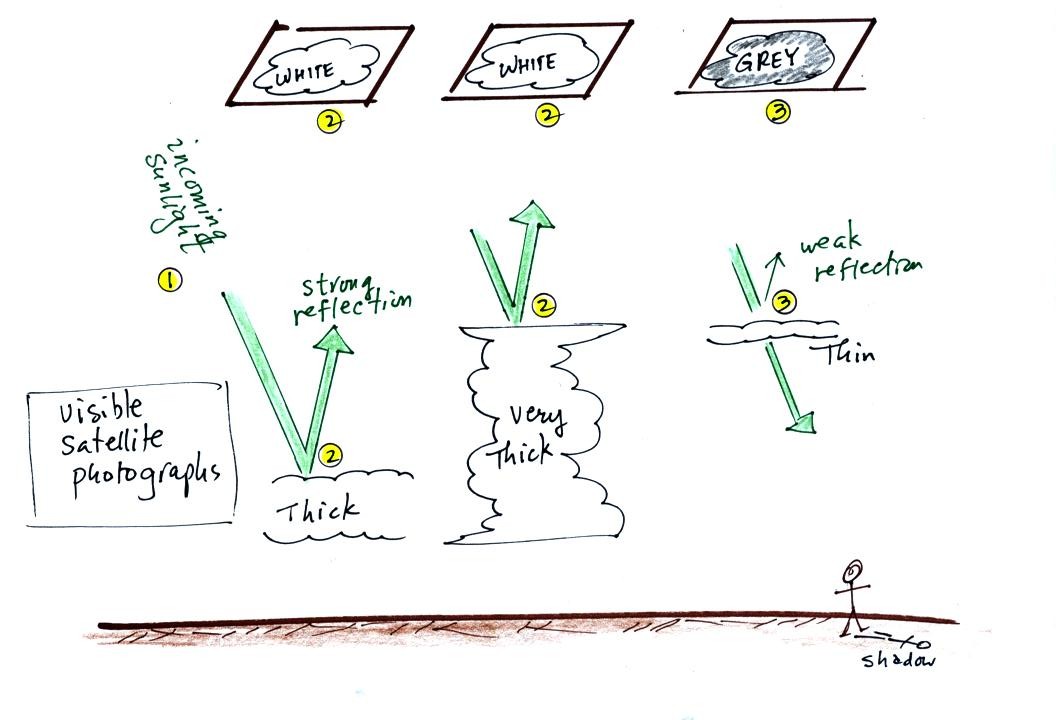
A visible satellite photograph photographs sunlight that is
reflected
by clouds. You won't see much on a visible satellite photograph
at night. Thick clouds are good reflectors and appear
white. Thinner clouds don't reflect as much light and appear
grey. The low altitude layer cloud and the thunderstorm would
both appear white on this photograph and would be difficult to
distinquish.
Here's a summary of what we have learned so far.
The figure below shows how
if you combine both visible and IR
photographs you can begin to distinquish between different types of
clouds.
There is one more type of satellite image worth mentioned, a
water
vapor image.
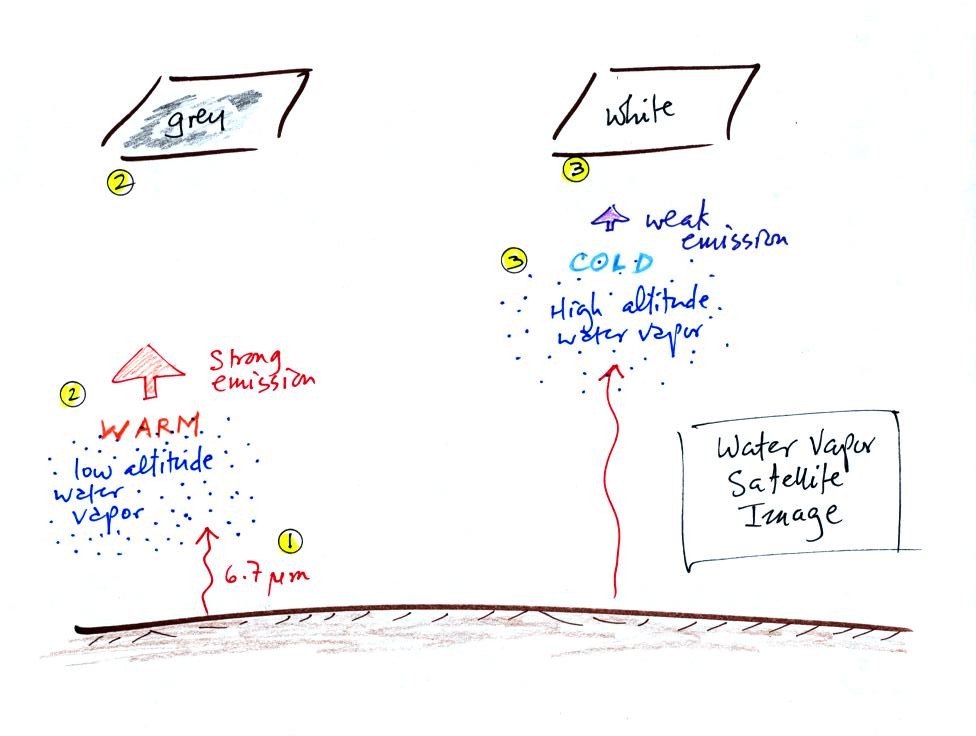
This is also a type of IR photograph. It detects a
different
wavelength of IR radiation. 6.7 um radiation is absorbed and
emitted by water vapor in the atmosphere. Warm low altitude water
vapor appears grey and unimpressive. Higher altitude water vapor
appears white on the satellite photograph. But
remember the high altitude
air is cold and there isn't much water vapor up there. The
utility of these photographs is not to show you whether a lot of
moisture is moving into an area but rather they reveal wind motions in
regions where there aren't clouds.
We barely had enough time in class on Wednesday to get
started on the next
topic: formation of
precipitation. It is not as easy to make precipitation as you
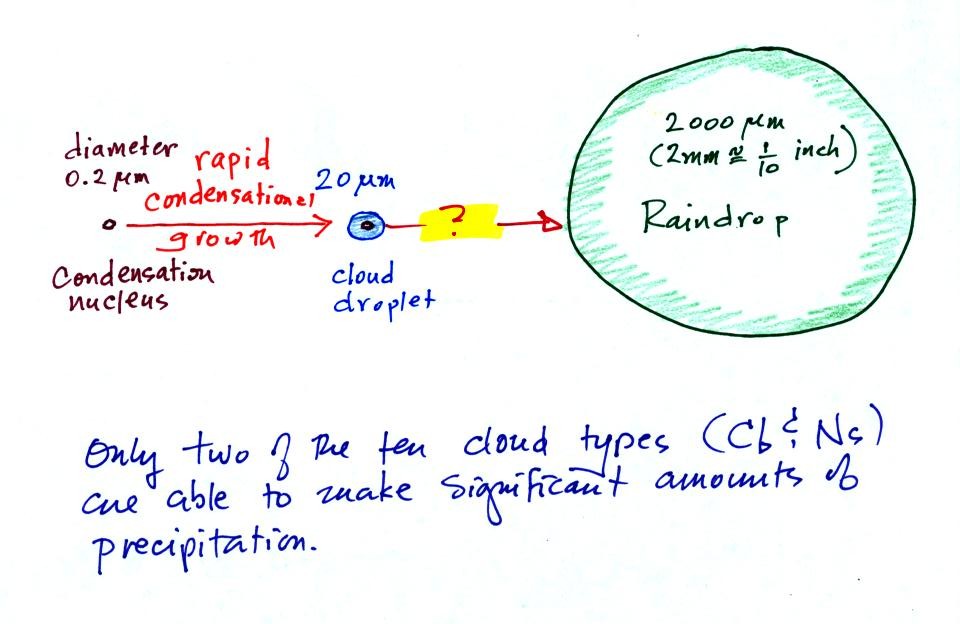
might think. Only nimbostratus and cumulonimbus clouds are able
to do it.
This figure shows typical sizes of cloud
condensation nuclei (CCN), cloud droplets, and raindrops (a human hair
is about 50 um thick for comparison). As we
saw in the cloud in a bottle demonstration it is relatively easy to
make cloud droplets. You cool moist air to the dew point and
raise the RH to 100%. Water vapor
condenses pretty much instantaneously onto a cloud condensation nucleus
to form a cloud droplet. It
would take much longer (a day or more) for condensation to turn a cloud
droplet
into a
raindrop. You know from personal experience that once a cloud
forms you don't have to wait that long for precipitation to begin to
fall.
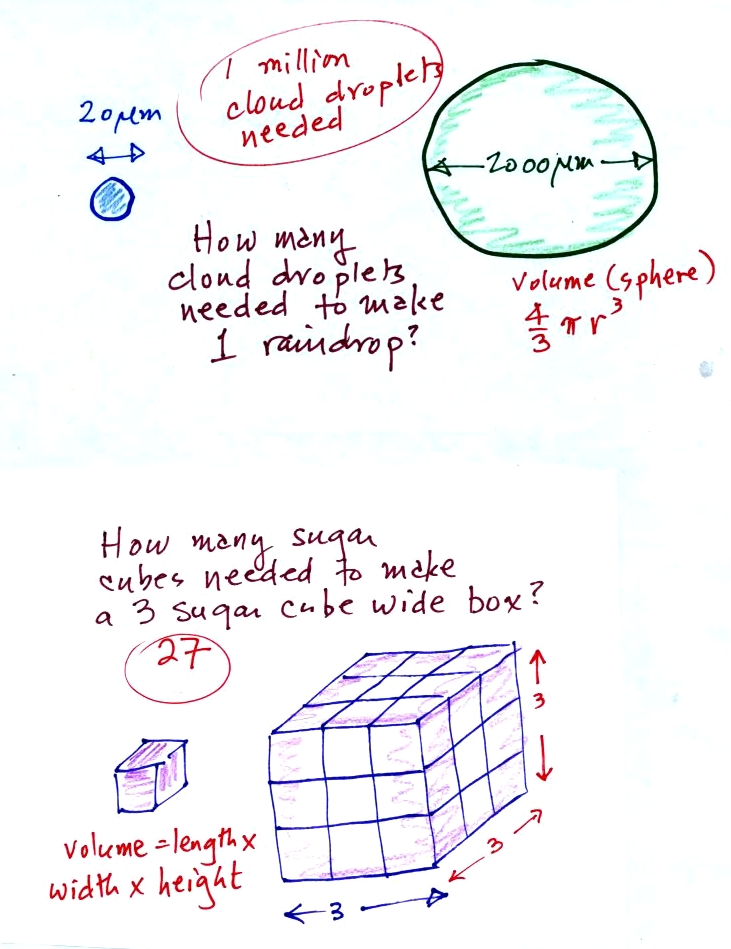
Part of the problem is that it takes quite a few 20 um diameter cloud
droplets to make one 2000 um diameter raindrop. How many
exactly? The raindrop is 100 times bigger across. Volume is
three dimensions. The raindrop is 100 times wider, 100 times
deeper, and 100 times higher than the cloud droplet. The raindrop
has a volume that is 100 x 100 x 100 times larger than the volume of
the cloud droplets.
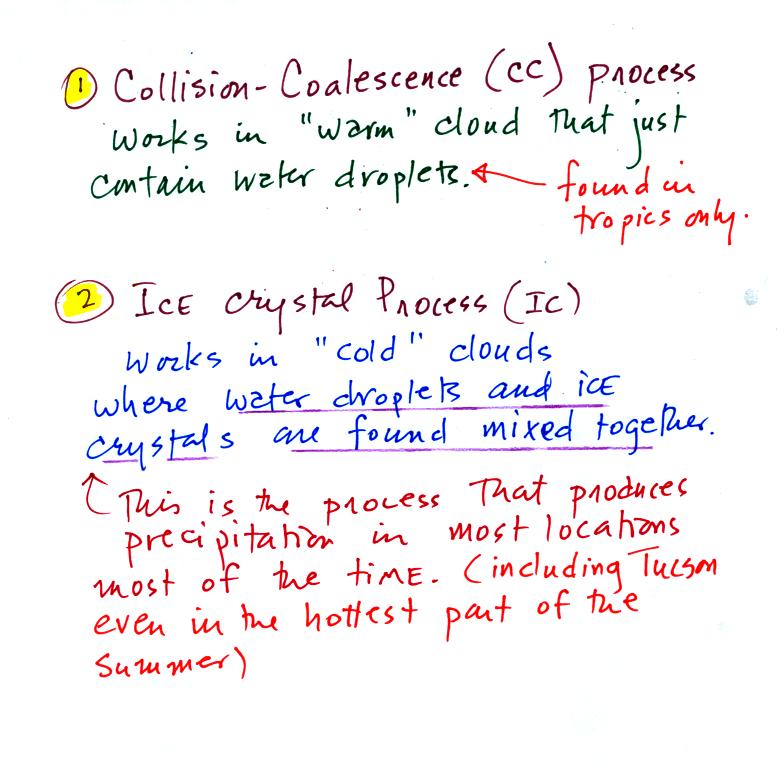
Fortunately there are two processes capable of quickly
turning small cloud droplets
into much larger precipitation particles in a cloud.