Tuesday Mar. 25, 2008
Welcome back, I hope your Spring Break was enjoyable.
Quiz #2, the Expt. #1 revised reports, one or two optional assignments,
and the 1S1P Topic 4 reports were returned in class today. A
short
"mid-term" grade summary was also handed out. Please check to be
sure
all of the grade information has been entered into the computer
correctly. If you are concerned about your overall grade I would
suggest you come by my office for a short visit. There is still
enough
work left this semester for you to raise your overall average
significantly. But you need to start to take corrective action
now,
well before the next quiz.
The Expt. #2 report revisions are due on Thursday, Mar. 27.
The Expt. #3 reports are due next Tuesday, Apr. 1. You should
collect
your data, and return your materials this week so that you can pick up
the supplementary information handout.
The Expt. #4 reports are due Tuesday, Apr. 8.
The
following is an
introduction to an important new topic: humidity (moisture in the
air). The
beginning of
Chapter 4 can be a little overwhelming and confusing. This is one
of
those rare situations where I would suggest you not read the beginning
of Chapter 4. Instead,
study these online notes and the notes you take in class. We will
work a number of humidity example problems later in class today and you
should
fairly
quickly grasp the basic concepts.
We will be mainly interested in 4 variables, what they are
and what can cause their values to change. The variables are :
mixing ratio, saturation
mixing ratio, relative humidity, and dew point. You will find
most of what follows on pps 83-85 in the photocopied class notes.
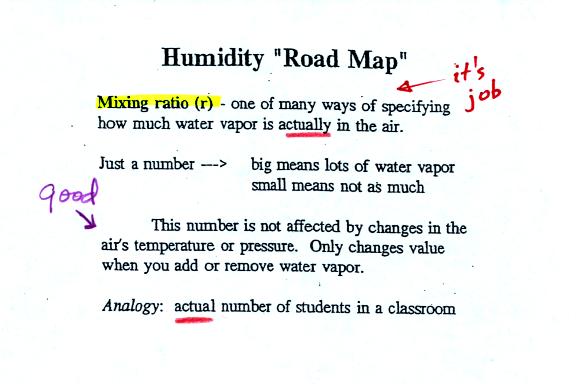
Mixing ratio tells you how much water vapor is actually in
the
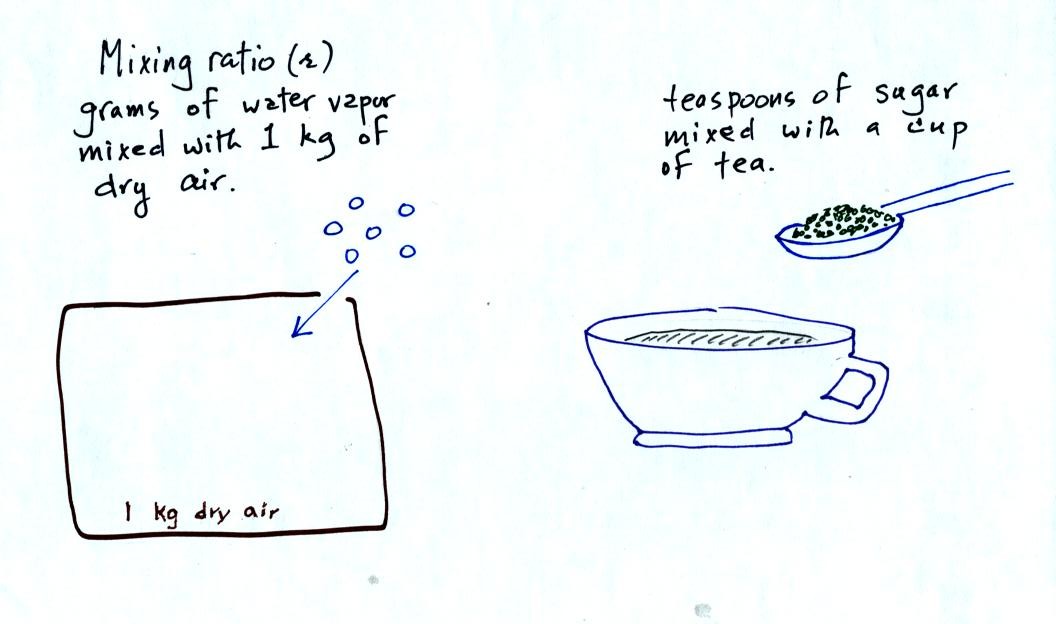
air. Mixing ratio has units of grams of water vapor per kilogram
of dry air (the amount of water vapor in grams mixed with a
kilogram
of dry air). It is basically the same idea as teaspoons of sugar
mixed in a cup of tea. Here are answers to the In class Optional
Assignment that was collected at the end of class on Monday by the
way.
The value of the mixing ratio won't change unless you add
water
vapor to or remove water vapor from the air. Warming the air
won't
change the mixing ratio. Cooling the air won't change the mixing
ratio
(unless the air is cooled below its dew point temperature and water
vapor starts to condense).
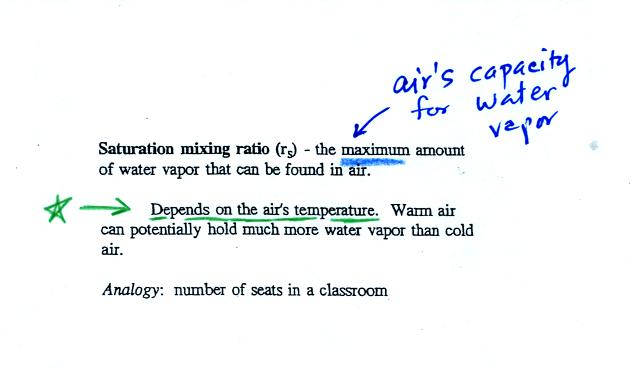
Saturation mixing ratio is just an upper limit to how much
water vapor
can be found in air, the air's capacity for water
vapor. It's a
property of air, it doesn't say anything about how much water
vapor is actually in the air (that's the mixing ratio's job).
Warm air can potentially hold more water vapor than cold air.
This variable has the same units: grams of water vapor per kilogram of
dry air. Saturation mixing ratio values for different air
temperatures are listed and graphed on p. 86 in the photocopied class
notes.

Just as is the case with water vapor in air,
there's a limit to how much sugar can be dissolved in a cup of hot
water. You can dissolve more sugar in hot water than in cold
water.
The dependence of saturation mixing ratio on air temperature is
illustrated below:
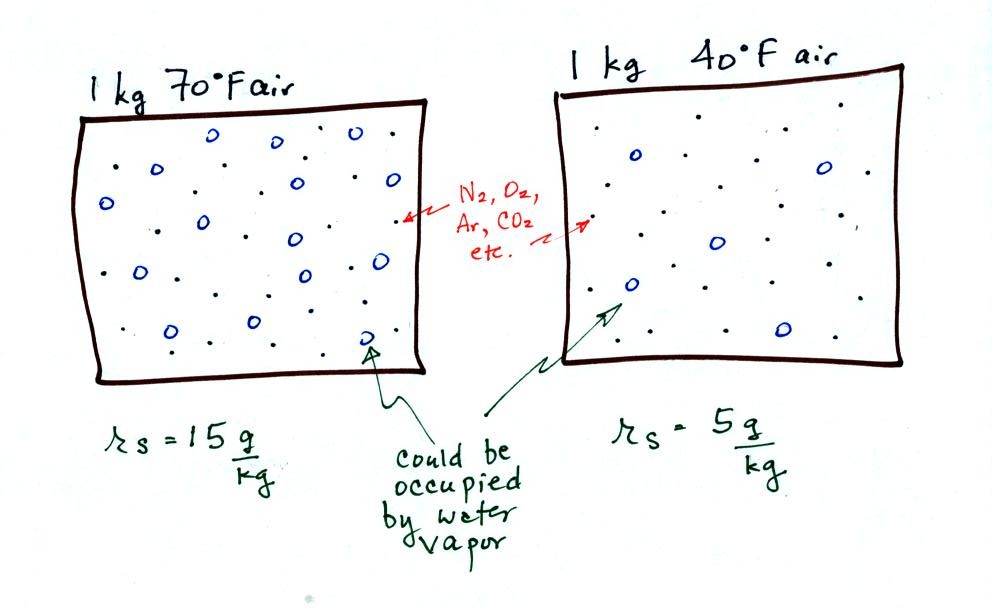
The small specks represent all of the gases in air except
for the water
vapor. Each of the open circles represents 1 gram of water vapor
that the air could hold. There are 15 open circles drawn in the 1
kg of 70 F air; each 1 kg of 70 F air could hold up to 15 grams of
water vapor. The 40 F air only has 5 open circles; this cooler
air can only hold up to 5 grams of water vapor per kilogram of dry air.
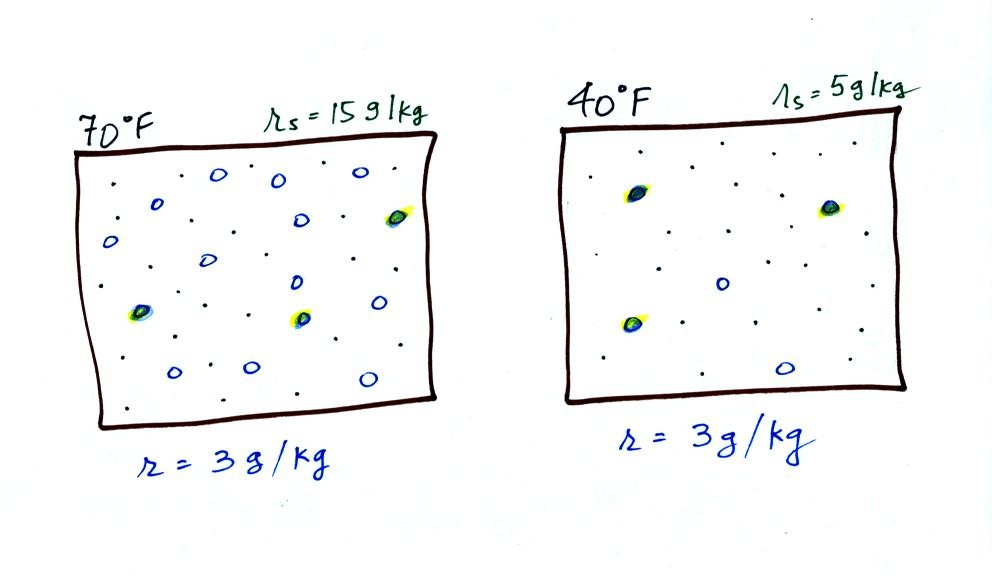
Now we have gone and actually put some water vapor
into the
volumes of
70 F and 40 F air. 3 grams of water vapor have been added to each
volume of air. The mixing ratio, r, is 3 g/kg in both cases.
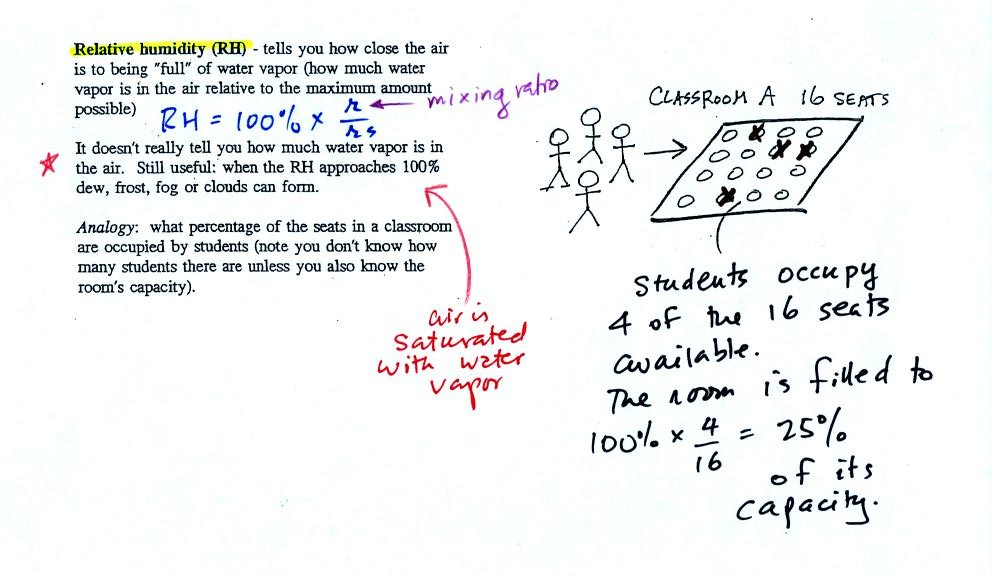
The relative
humidity is the variable most people are familiar with, it tells you
how "full" the air is with water
vapor.
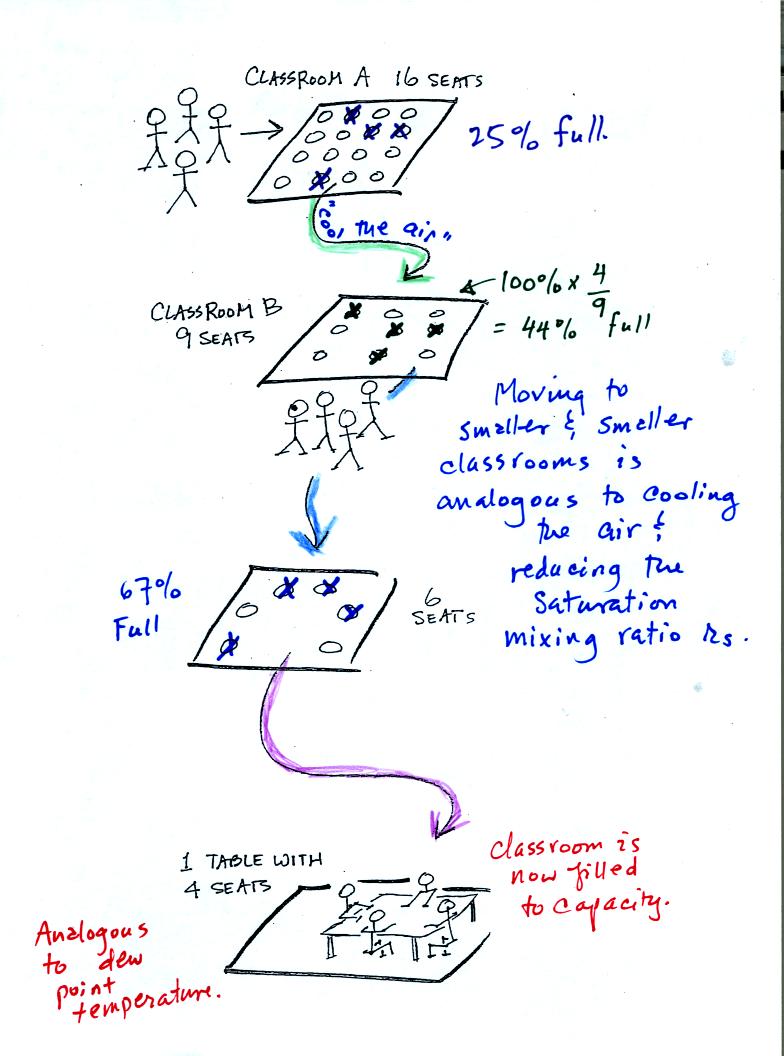
In the analogy (sketched on the right hand side of p. 83 in
the photocopied notes) 4 students wander into Classroom A which has 16
empty
seats. Classroom A is filled to 25% of its capacity.
You can think of 4, the number of students, as being analogous to the
mixing ratio. The classroom capacity is analogous
to the
saturation mixing ratio. The percentage occupancy is analogous to
the relative humidity.
Instead of students and a classroom you
could think of the 70 F and 40 F air that could potentially hold 15
grams or 5 grams, respectively of water vapor.
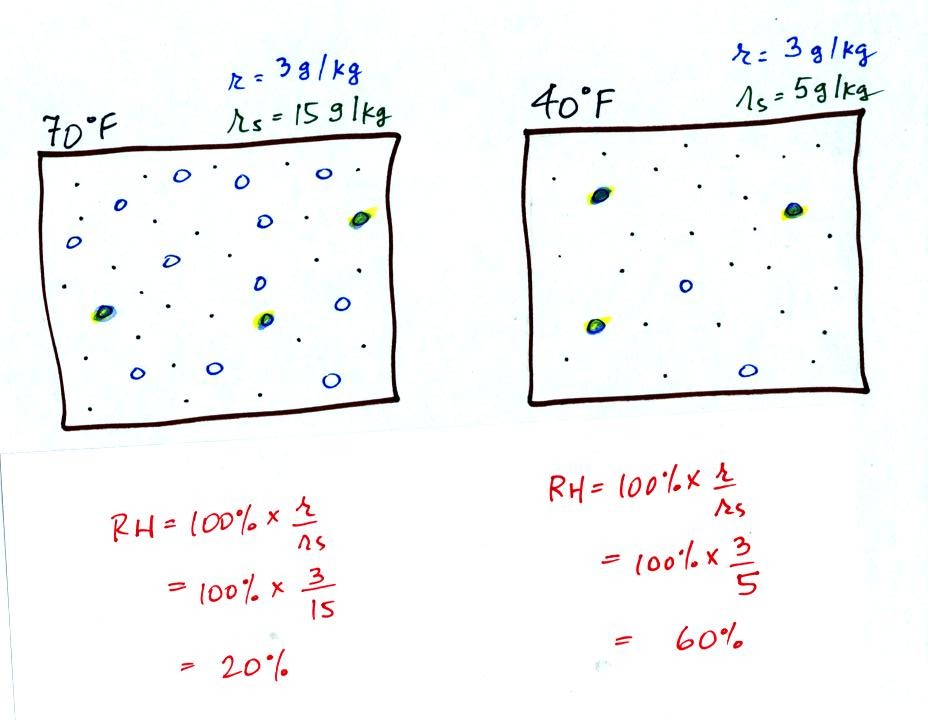
Here are the relative humidities of the 70 F and 40 F air
that each
contain 3 grams of water vapor. The 70 F air has a low RH because
this warm air's saturation mixing ratio is large. The RH in the
40 F is higher even though it has the same actual amount of water vapor
because the 40 F air can't hold as much water vapor and is closer to
being saturated.
Something important to note: RH doesn't really tell you how much water
vapor is
actually in the air. The two volumes of air above contain the
same amount of water vapor (3 grams per kilogram) but have different
relative humidities. You could just as easily have two volumes of
air with the same relative humidities but different actual amounts of
water vapor.
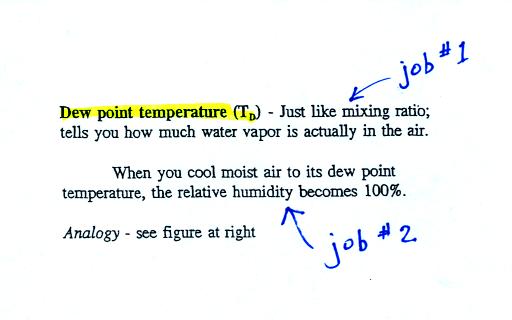
The dew point temperature has two jobs. First it is a
measure of
the actual amount of water vapor in the air. In this respect it
is just like the mixing ratio. If the dew point temperature is
low the air doesn't contain much water vapor. If it is high the
air contains more water vapor.
Second the dew point tells you how much you must cool the air in order
to cause the RH to increase to 100% (at which point a cloud, or dew or
frost, or fog would form).
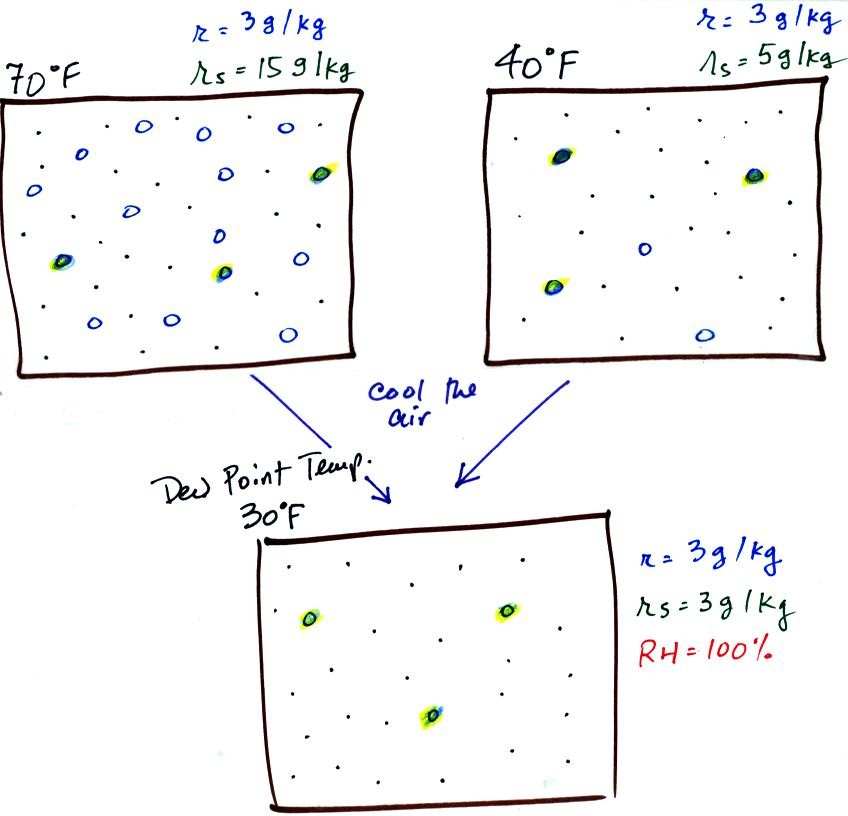
If we cool the 70 F air or the 40 F air to 30 F we would
find that the
saturation mixing ratio would decrease to 3 grams/kilogram. Since
the air actually contains 3 g/kg, the RH of the 30 F air would become
100%. The 30 F air would be saturated, it would be filled to
capacity with water vapor. 30 F is the dew point temperature for
70 F air that contains 3 grams of water vapor per kilogram of dry
air. It is also the dew point temperature for 40 F air that
contains 3 grams of water vapor per kilogram of dry air.Because
both volumes of air had the same amount of water vapor,
they both also have the same dew point temperature.
Now back to our students and classrooms analogy on the
righthand
side of p. 83. The 4 students
move into classrooms of smaller and smaller capacity. The
decreasing capacity of the classrooms is analogous to the
decrease in saturation mixing ratio that occurs when you cool
air. Eventually the students move into a classroom that they just
fill to capacity. This is analogous to cooling the air to the dew
point temperature, at which point the RH becomes 100% and the air is
filled to capacity, the air is saturated with water vapor.
And
now for something completely different (see pps 81 & 82 in the
photocopied Classnotes)
We have already learned that oceans moderate
climate. A region
next to an ocean or an island surrounded by ocean will have a smaller
annual range of temperature than a location surrounded by land.
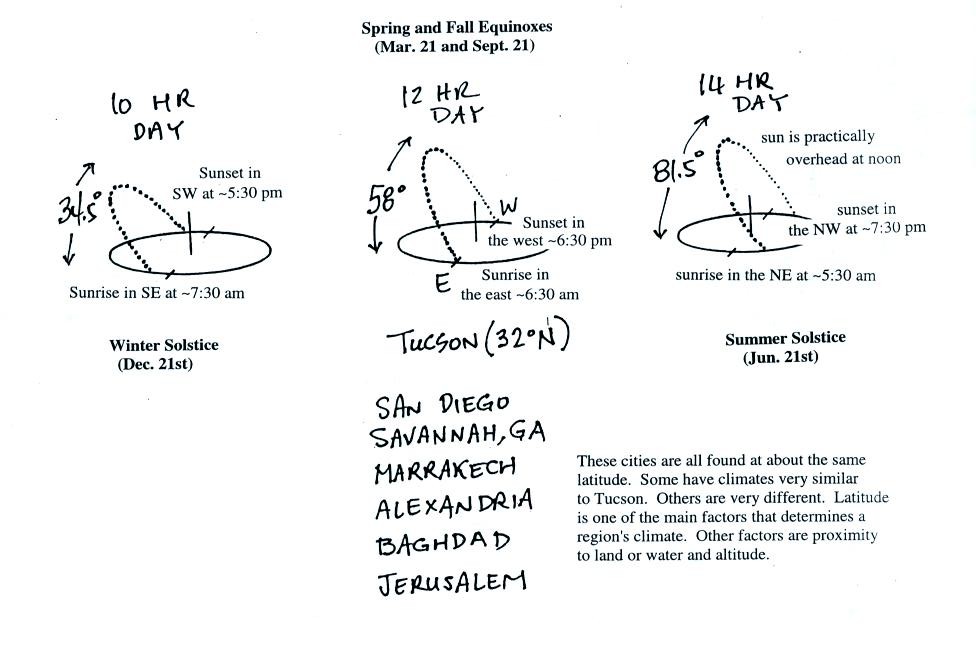
Latitude also affects the annual range of temperature. The
smallest seasonal variations are found at the equator because the days
are always 12 hours long and the sun is always high in the sky at
noon. These two factors and a couple of other factors are
discussed in
an online summary of the
Controls of Temperature. Please have a
look
at that section. You will find a link to an Optional Assignment
that
you can download, print out, and complete. This Controls of
Temperature Optional Assignment is due at the start of class on Monday
Mar. 31.
We had a brief look at some climate data from Pohnpei Island in the
Federated States of Micronesia. You'll find some information
about Pohnpei and other nearby islands on pps 81 and 82 in the
photocopied Class Notes.
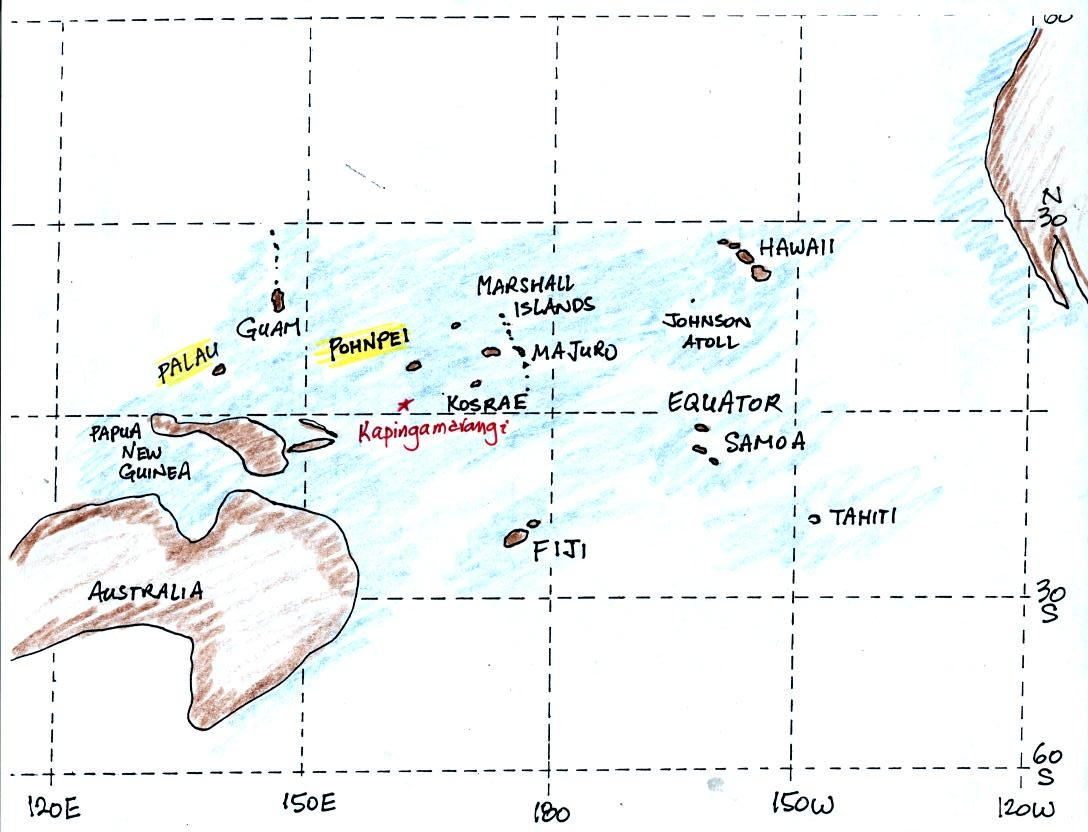
Pohnpei island is located to the east of Guam. The
current Survivor series was filmed in Palau. Kapingamarangi
Atoll in the Federated States of Micronesia is located at 1 N
latitude. Kapingamarangi Atoll is too small to have a weather
station. There is a weather station and an airport on Pohnpei
Island, however.

Pohnpei is a fairly large island and is a popular snorkeling and scuba
diving destination. Pohnpei has a weather station that is
operated by the US National Atmospheric and Oceanic Administration.

Because of its low latitude and
the fact that it is surrounded by water you would expect a small annual
range of temperature at Pohnpei. You can see in the
table above just how small the annual range is: the average monthly
temperatures in Pohnpei range from 80.8 F in February and March to 80.0
F in July. The annual range is less than 1 F. By
comparison, the annual range in Tucson is about 34 F (52 F in December
and January to 86 F
in July). The temperature on Pohnpei has never dropped below 66
F.
The following precipitation data show that Pohnpei is also one of the
rainiest locations on earth
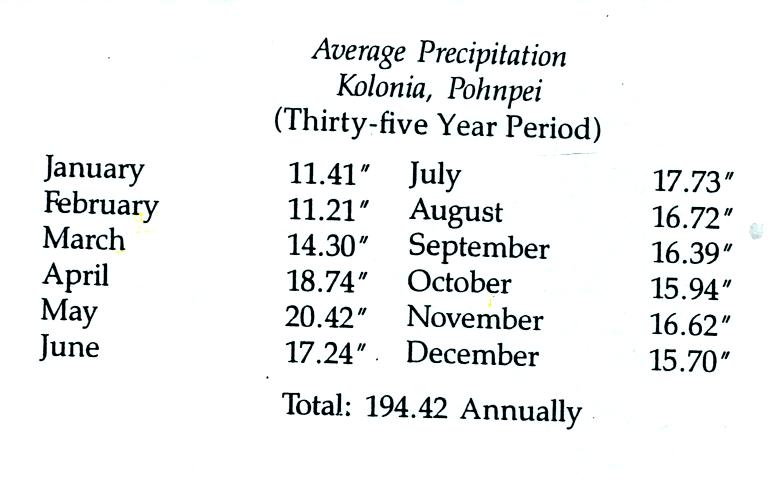
The rainiest location on earth is in Hawaii with about 460 inches
of
rain per year.
Now back
to humidity
In the time remaining in class we were able 4 humidity
example problems. By doing these problems you should become more
familiar with the humidity variables (mixing ratio, saturation mixing
ratio, relative humidity, and dew point temperature). You'll also
learn "how they behave" and what can cause each of these variables to
change value.
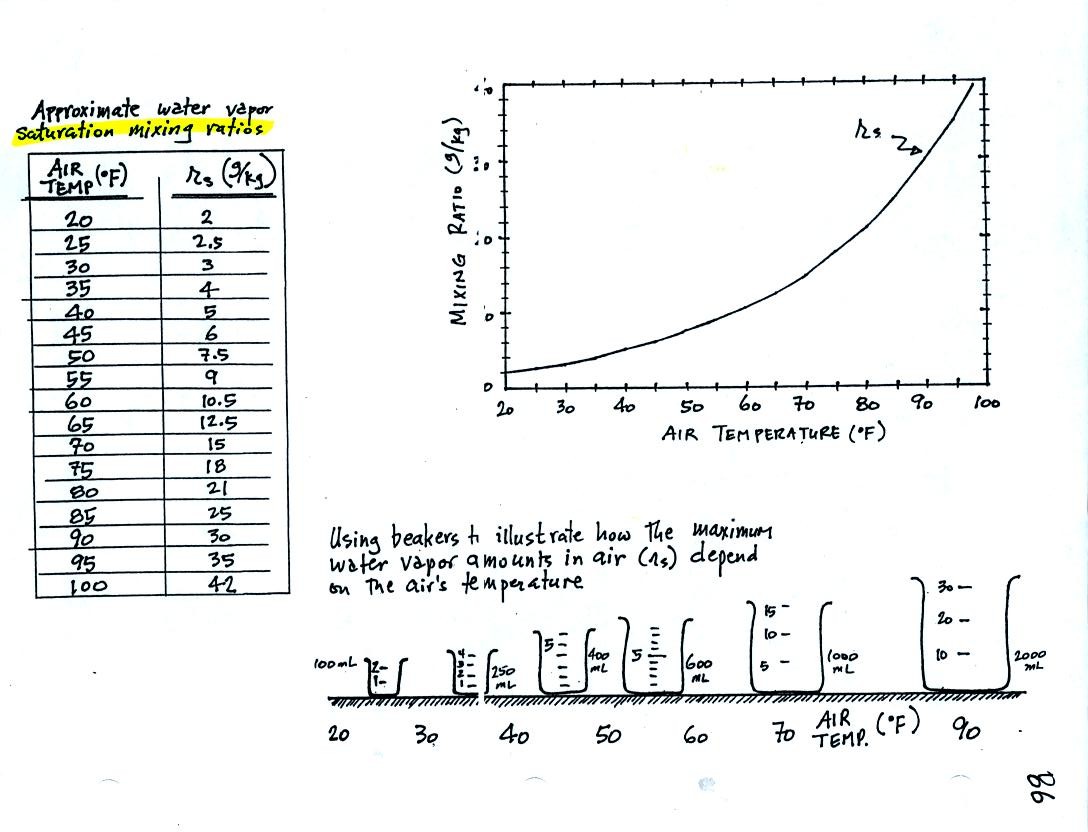
Keep this compilation of saturation mixing ratio values
(shown in a table and on a graph) handy, we will
use it a lot as we work through the humidity problem examples.
Remember that saturation mixing ratio is the maximum amount of water
vapor that can be found in air. It is a property of the air and
depends on the air's temperature.
The beakers (beakers were also brought to class)
are meant to show graphically the relative amounts of water
vapor that air at different temperatures can contain.
Now the
first of our example problems.

Here is the first sample
problem that we worked in
class.
You might have a hard time unscrambling this if you're seeing it for
the first
time. The series of steps that we followed are retraced
below:
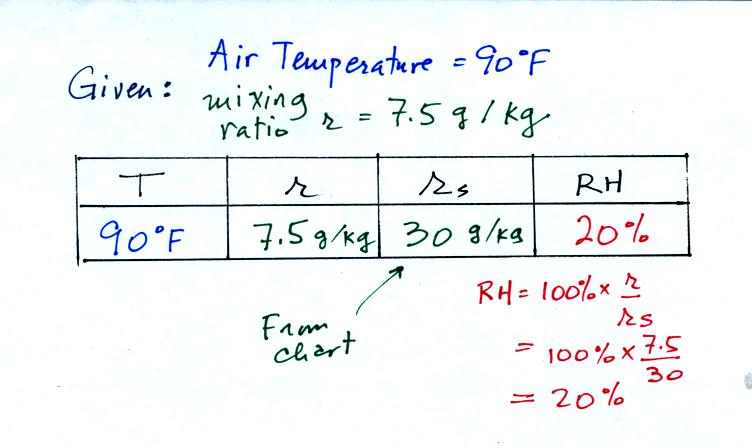
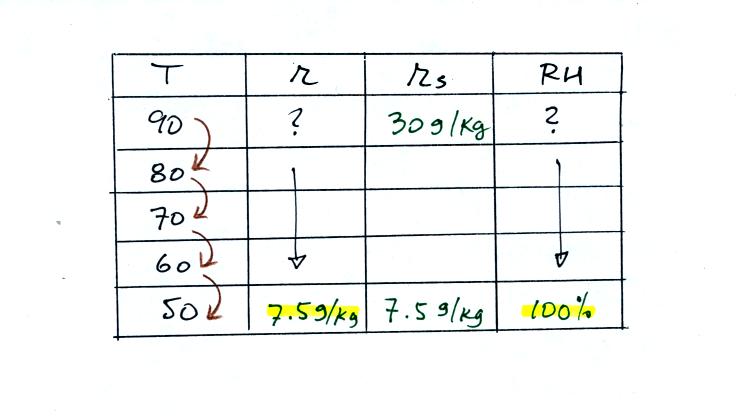
We're given an air temperature of 90 F and a mixing ratio
(r) of 7.5
g/kg. We're supposed to find the relative humidity (RH) and
the dew point temperature.
We start by entering the data we were given in the
table. Once
you know the air's temperature you can look up the saturation mixing
ratio value; it is 30 g/kg for 90 F air. 90 F air could
potentially hold 30 grams of water vapor per kilogram of dry air (it
actually contains7.5 grams per kilogram in this example).
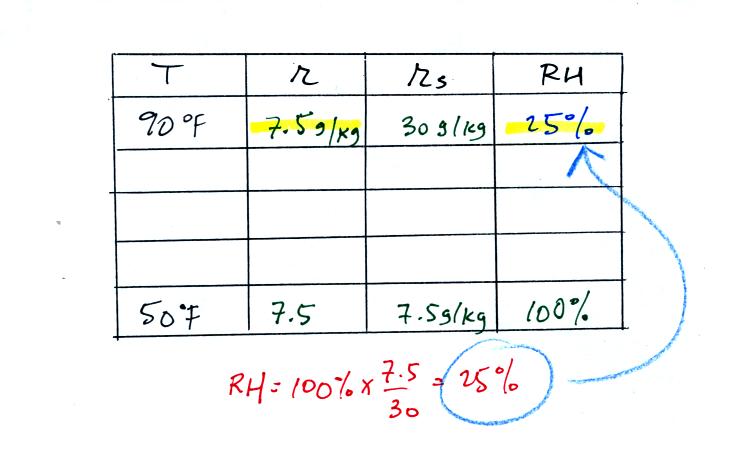
Once you know mixing ratio and saturation mixing ratio you can
calculate the relative humidity. The RH is 25%.
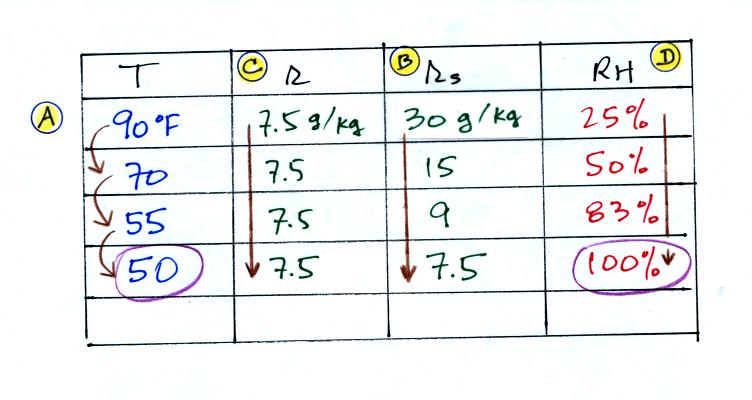
The numbers we just figured out are shown on the top line
above.
(A) We imagined cooling the air from 90F to 70F, then to 55F, and
finally to 50F.
(B) At each step we looked up the saturation mixing ratio and entered
it on the chart. Note that the saturation mixing ratio values
decrease as the air is
cooling.
(C) The mixing ratio doesn't
change as we cool the air. The only
thing that changes r is adding or removing water vapor and we aren't
doing either.
(D) Note how the relative humidity is increasing as we cool
the
air. The air still contains the same amount of water vapor it is
just that the air's capacity is decreasing.
Finally at 50 F the RH becomes 100%. The dew point temperature in
this problem is 50 F.
What would happen if we cooled the air further still, below the dew
point temperature?
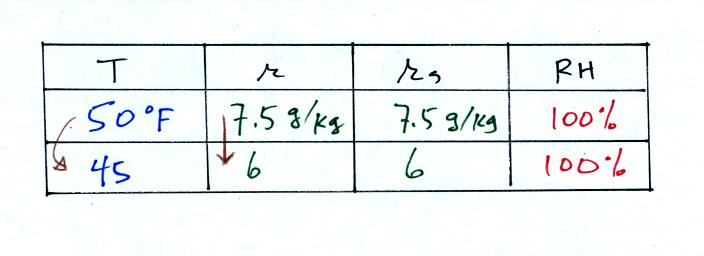
45 F air can't hold the 7.5 grams of water vapor
that 50 F air can. You can only "fit" 6 grams of water vapor into
the 45 F air. The remaining 1.5 grams would condense. If
this happened at ground level the ground would get wet with dew.
If it happens above the ground, the water vapor condenses onto small
particles in the air and forms fog or a cloud. Now because water
vapor is being taken out of the air (and being turned into water), the
mixing
ratio will decrease from 7.5 to 6. That is why the mixing ratio
is
changing.
In many ways cooling moist air is liking squeezing a
moist sponge (the figure below
wasn't shown in class)
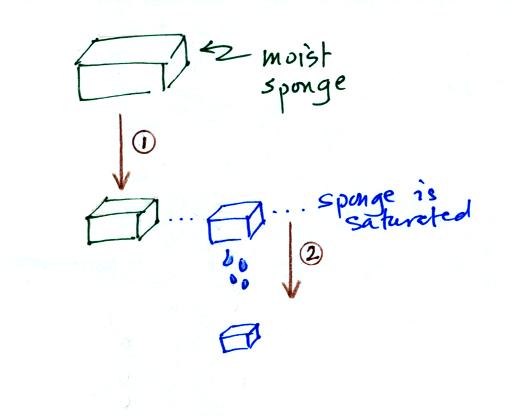
Squeezing the
sponge and reducing its volume is like cooling moist air and reducing
the saturation mixing ratio. At first when you sqeeze the sponge
nothing happens, no water drips out. Eventually you get to a
point where the sponge is saturated. This is like reaching the
dew point. If you squeeze the sponge any further (or cool air
below
the dew point) water will begin to drip out of the sponge (water vapor
will condense from the air).
Here's the
2nd problem we worked

The work that we did in class is shown above. Given an air
temperature
of 90
F and a relative humidity of 50% you are supposed to figure out the
mixing ratio (15 g/kg) and the dew point temperature (70 F). The
problem is worked out in detail below:
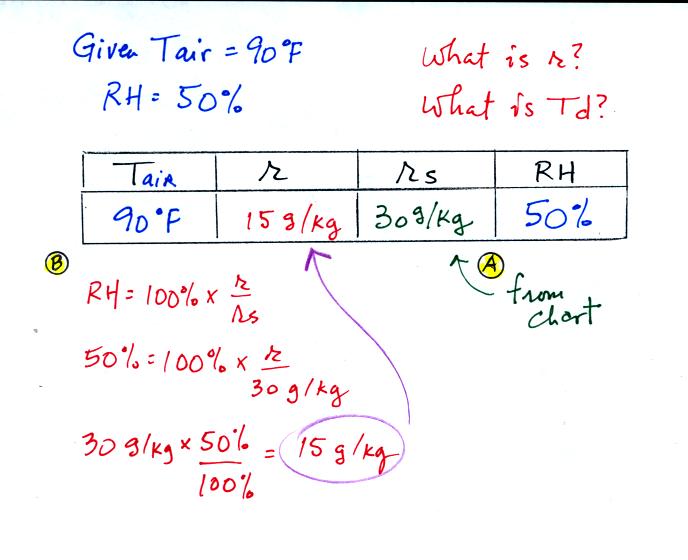
First you fill in the air temperature and the RH data that
you are
given.
(A) since you know the air's temperature you can look up the
saturation mixing ratio (30 g/kg).
(B) Then you can substitute into
the relative humidity formula and solve for the mixing ratio (15 g/kg).
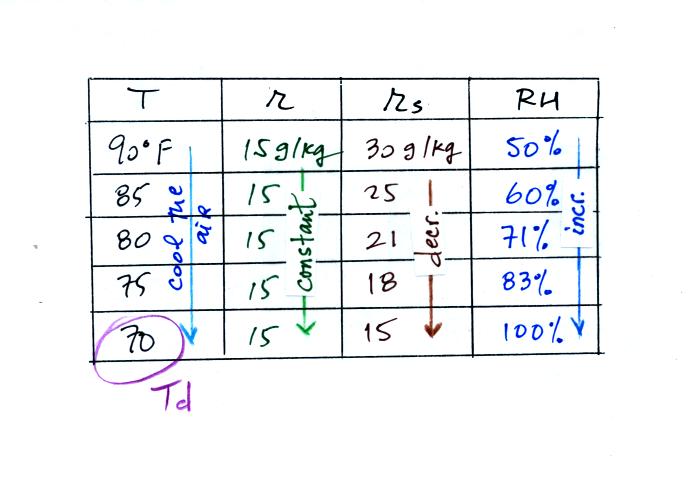
Finally you imagine cooling the air. Cooling causes
the
saturation mixing ratio to decrease, the mixing ratio stays constant,
and the relative humidity increases. In this example the RH
reached 100% when the air had cooled to 70 F. That is the dew
point temperature.
We can use
results from humidity problems #1 and #2 worked in class on Monday to
learn a useful rule.
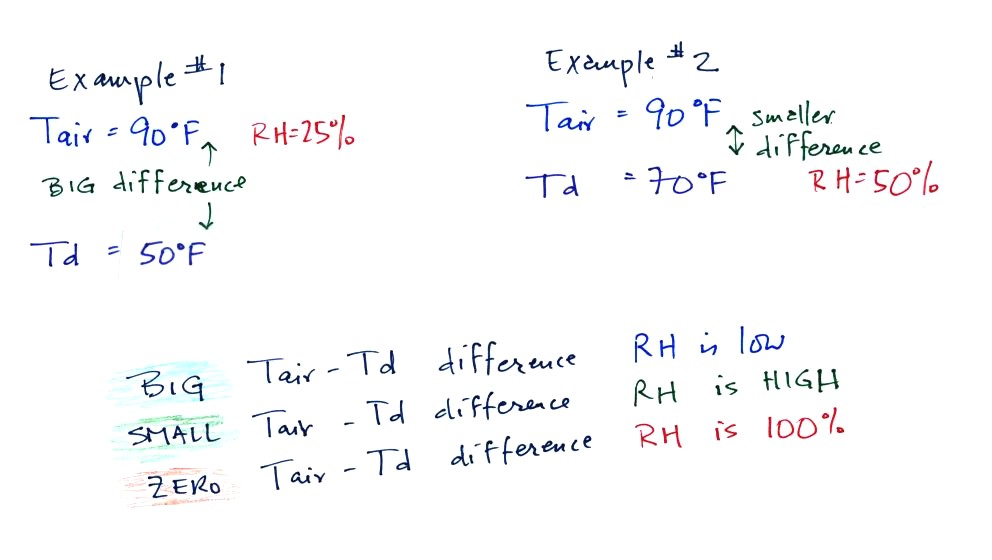
In the first
example the difference between the air and dew point
temperatures was large (40 F) and the RH was low.
In the 2nd problem the difference between the air and dew point
temperatures was
smaller and the RH was higher. The easiest way to remember this
rule is to remember the case where there is no difference between the
air and dew
point temperatures. The RH would be 100%.
Problem #3
is next.
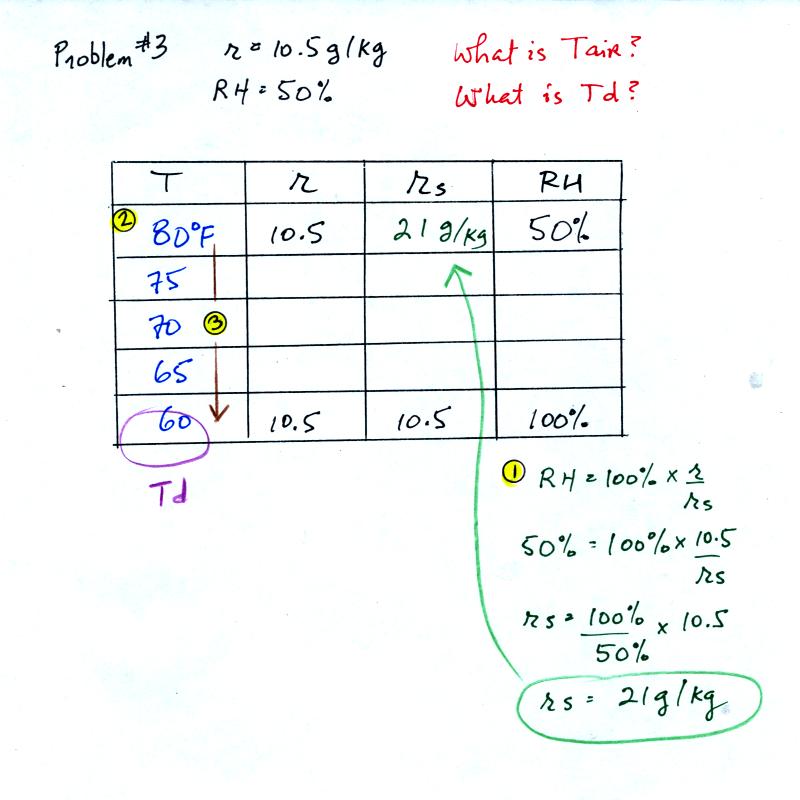
This figure was redrawn after class. You are given a
mixing ratio
of 10.5 g/kg and a relative humidity of 50%. You need to figure
out the air temperature and the dew point temperature.
(1) The air contains 10.5 g/kg of water vapor, this is 50%,
half, of what the air
could potentially hold. So the air's capacity, the saturation
mixing ratio must be 21 g/kg (you can either do this in your head or
use the RH equation following the steps shown).
(2) Once you know the saturation mixing
ratio you can look up the air temperature in a table.
(3) Then you
imagine cooling the air until the RH becomes 100%. This occurs at
60 F. The dew point is 60 F.
Problem #4
is probably the most difficult of the bunch.
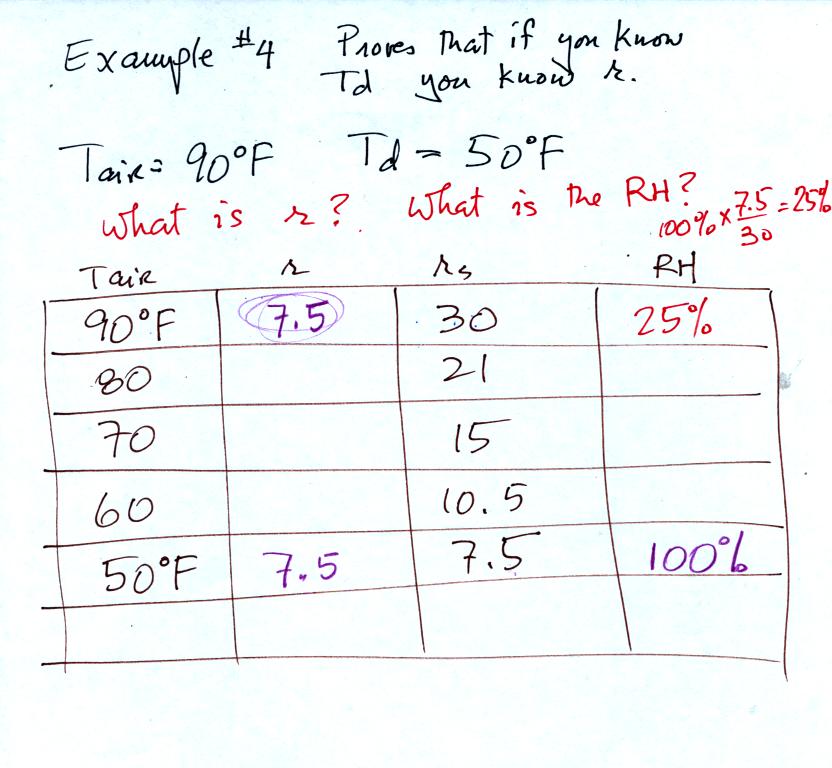
The figure above shows what we did in class. We were
given the air temperature
and the dew point temperature. We're supposed to find the mixing
ratio and the relative humidity.
Here's the step by step approach to answering the question.
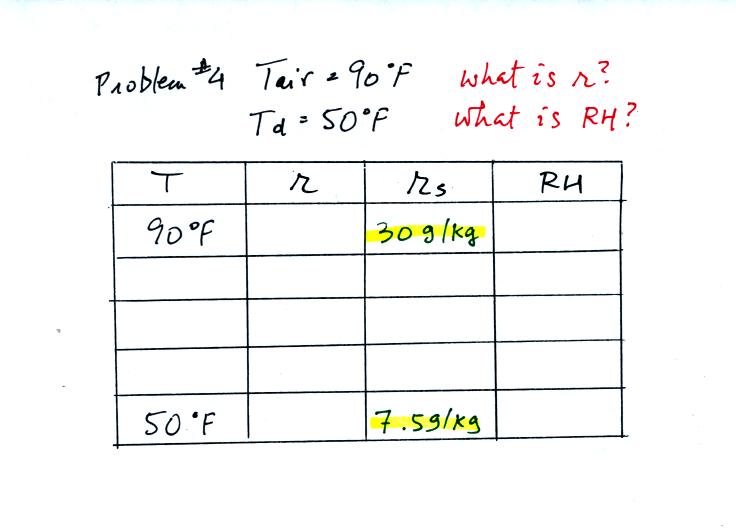
We enter the two temperatures onto a chart and look up the
saturation
mixing ratio for each.
We ignore the fact that we don't know the mixing
ratio. We do know that if we cool the 90 F air to 50 F the RH
will
become
100%. We can set the mixing ratio equal to the value of the
saturation mixing ratio at 50 F, 7.5 g/kg.
Remember back to the three earlier examples. When we
cooled air
to the the dew point, the mixing ratio didn't change. So the
mixing ratio must have been 7.5 all along. Once we know the
mixing ratio in the 90 F air it is a simple matter to calculate the
relative humidity, 25%.
Here's
a copy of a handout distributed near the end of class.
I thought it best not to discuss this in class, that would have been
too much material for one day. As a matter of fact, if you have
just read through all the information above on humidity, you might
ought to take a break and come back to this material on another
day. As a matter of fact I have moved the discussion of the
handout below to the Thursday Mar. 27 online notes.