
| Weather
variable |
Behind |
Passing |
Ahead |
| Temperature |
cool, cold, colder* |
warm |
|
| Dew Point |
usually much drier* |
may be moist (may not be moist in desert SW) |
|
| Winds |
northwest |
gusty winds |
from the southwest |
| Clouds,
Weather |
clearing |
rain clouds, thunderstorms |
might see some high clouds |
| Pressure |
rising |
reaches a minimum |
falling |

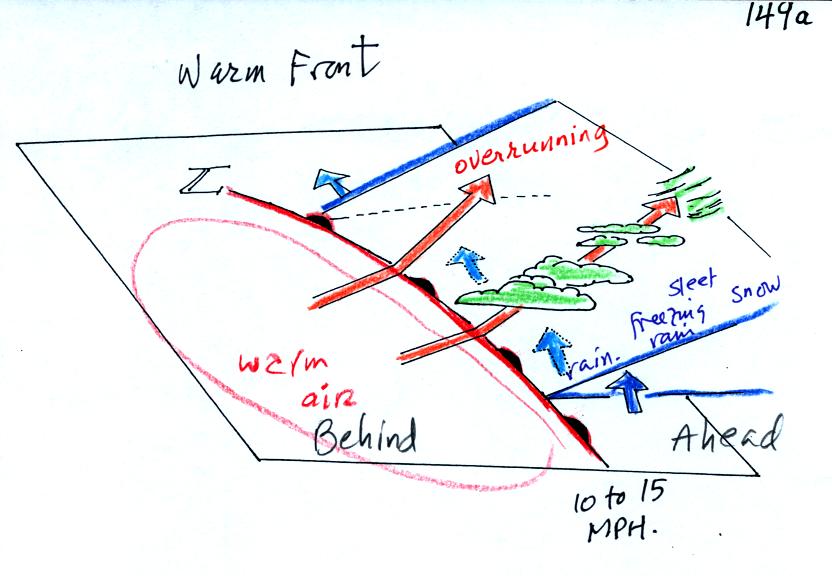
| Weather
Variable |
Behind
(after) |
Passing |
Ahead
(before) |
| Temperature |
warmer |
cool |
|
| Dew point |
moister |
drier |
|
| Winds |
from S or SW |
from E or SE |
|
| Clouds, Weather |
clearing |
wide variety of clouds well
ahead of the front. wide variety of types of precipitation also. |
|
| Pressure |
rising |
falling |