
The discharge begins at left in the figure with a branched stepped leader that is followed by a 1st return stroke. The stepped leader takes a few 10s of milliseconds to travel from the main negative charge center in the cloud to the ground. The ensuing 1st return stroke travels back up the channel to the cloud is about 100 microseconds.
 |
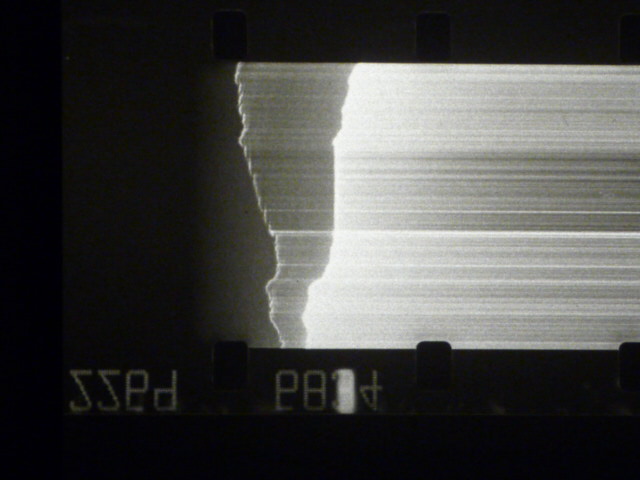 |
Here's an actual (copy of a) streaking camera photograph of a stepped leader. The sketch at left assume a straight and vertically oriented channel. Film motion to the left would smear the downward progression of the leader to the right. Images like this can be used to measure the downward propagation speed of the leader (the fact that all the leader steps fall in a line would imply a uniform propagation speed). The upward moving return stroke is also smeared to the right but to a much smaller degree because of its faster propagation speed.
Then, with a few slight differences, the process repeats itself. Additional discharges occur typically at intervals of 50 to 100 ms and are usually preceded by a dart leader that travels, without stepping or branching, down the existing main channel. A short upward connecting discharge is initiated when the dart leader gets close to the ground and then a subsequent return stroke travels back up the channel to the cloud. We'll look at the dart leader and subsequent return stroke processes in a little more detail shortly.
The 3rd return stroke in the illustration above is following by a continuing current. This is a low amplitude (100s of Amperes) current that continues to flow for 10s of milliseconds or more typically, which keeps the return stroke channel luminous. Short re-brightening of the channel sometimes occur during the continuing current, these are called M-components.
A short video was shown at this point (it was produced by Ken Cummins and Shipherd Reed for a display at the Flandrau Science Center on campus). I can't include a link in these online notes because the video contains some copyright protected material.
Next some information about dart leaders and subsequent return strokes.

Because a dart leader is following an existing channel it travels faster than a stepped leader.

Here a streaking photograph of a dart leader (again provided by Vince Idone)
Sometimes the dart leader will depart from the existing channel and form a new channel to ground. Because it is traveling through air that hasn't been ionized, the lower portion of the dart leader would turn into a stepped leader.
Occasionally there is sufficient time between strokes that the existing channel can begin to cool and become less conductive. Under these conditions the dart leader becomes a dart-stepped leader. The steps of a dart-stepped leader are shorter and occur more frequently than a stepped leader.
Subsequent return stroke characteristics are summarized in the table below
| peak current |
10 kA |
| peak current
derivative |
100 kA/μs |
| velocity |
1 x 10⁸ m/s |
Statistics on the number of strokes per flash are shown in the following two histograms (source: Lightning: Physics and Effects, V.A. Rakov, M.A. Uman, Cambridge Univ. Press, Cambridge, 2003).

Many lightning parameters or characteristics are log-normally distributed. This appears to be the case with the interval time between return strokes distribution in the next figure (also from the Lightning: Physics and Effects source mentioned above)

Up to now we really haven't considered the possibility that dart leaders and subsequent return strokes might depart from the channel created by the stepped leader and 1st return strokes. That does often turn out to be the case. This means that the separate strokes in a flash do not always strike the same point on the ground. The illustration and statistics below come from "Statistics and characteristics of cloud-to-ground lightning with multiple ground contacts," W.C. Valine and E.P. Krider (you'll find a full citation in the Articles folder)


Next we look at how a
multi-stroke cloud-to-ground discharge might appear on
slow and fast electric field antenna records.

The sequence of events shown on the sketch of a high-speed photograph record of a discharge at the top of the figure should be familiar by now.
Point 1a on the slow E field record shows the field change produced by the stepped leader (the E field at the ground points upward toward the negative charge being lowered by the leader, so it looks like the atmospheric electricity convention for E field polarity is being used on this figure). The dart leader field changes are shown at Points 1b. They are smaller in amplitude (the dart leader doesn't lower as much charge as the stepped leader) and have shorter durations.
The abrupt return stroke changes are shown at Points 2 on the slow E and the fast E records. Note one the slow E field record that the leader and return stroke field changes are of opposite polarity. The return stroke removes negative charge from the leader channel, charge that came from the main negative charge center in the thundercloud. The overall effect is the same as if a quantity of positive charge had been added to the cloud and used to neutralize the negative charge.
Points K on the fast E field record are "K changes." During the interval between return strokes, in-cloud leader processes seek out additional pockets of charge in the cloud. Occasionally, when the leader finds a concentration of charge, a rapid recoil streamer travels back along the in-cloud leader channel (in some ways like a return stroke propagates back along the leader in a cloud-to-ground strike). The K changes are probably produced by these recoil streamers.
The preliminary discharge process that initiates cloud-to-ground discharges is not well understood. Sequences of bipolar waveforms like shown at Point 3 though are thought to be associated with the preliminary breakdown process.
Point 4 shows E field pulses thought to be produced by the last few steps of the stepped leader as it approaches the ground.
The fast E field waveforms produced by 1st and subsequent strokes are distinctly different. The 1st return stroke field variations following the peak are considerably noisier than is observed with subsequent strokes. Some of the "noise" on the 1st return stroke E field record is probably produced by branches. Some of the structure on both the 1st and subsequent stroke waveforms is probably due to channel tortuosity.
Some of the modern lightning detection and location instrumentation is able to distinquish between return stroke waveforms and waveforms produced by leaders or discharges that occur during the preliminary breakdown activity.
The next figure is essentially the same except that some continuing current has been added following the second stroke.

A continuing current is a low level current (10s to
100s of Amperes) that continues to flow after a return
stroke for 10s to a few 100s of milliseconds.
The continuing current can transport signficant
quantities of charge to the ground (100 ms x 250 Amps
= 25 C ). Continuing currents can burn through
metal sheets or metal skins on aircraft bodies.
A CG lightning discharge with continuing current is
sometimes referred to as "hot lightning" because these
discharges are more likely to cause a forest fire than
a discharge without continuing current. A field
change associated with the continuing current is
visible on the slow E field record. M components
are a rebrightening of the lightning channel that
occurs during a continuing current. The K
changes seen on the fast E field trace may be
associated with the M components.
The next figure illustrates a triggered lightning discharge. The figure shows a typical slow E field record and a record of the current that would be measured at the ground instead of a fast E field waveform.

The sequence of events shown on the sketch of a high-speed photograph record of a discharge at the top of the figure should be familiar by now.
Point 1a on the slow E field record shows the field change produced by the stepped leader (the E field at the ground points upward toward the negative charge being lowered by the leader, so it looks like the atmospheric electricity convention for E field polarity is being used on this figure). The dart leader field changes are shown at Points 1b. They are smaller in amplitude (the dart leader doesn't lower as much charge as the stepped leader) and have shorter durations.
The abrupt return stroke changes are shown at Points 2 on the slow E and the fast E records. Note one the slow E field record that the leader and return stroke field changes are of opposite polarity. The return stroke removes negative charge from the leader channel, charge that came from the main negative charge center in the thundercloud. The overall effect is the same as if a quantity of positive charge had been added to the cloud and used to neutralize the negative charge.
Points K on the fast E field record are "K changes." During the interval between return strokes, in-cloud leader processes seek out additional pockets of charge in the cloud. Occasionally, when the leader finds a concentration of charge, a rapid recoil streamer travels back along the in-cloud leader channel (in some ways like a return stroke propagates back along the leader in a cloud-to-ground strike). The K changes are probably produced by these recoil streamers.
The preliminary discharge process that initiates cloud-to-ground discharges is not well understood. Sequences of bipolar waveforms like shown at Point 3 though are thought to be associated with the preliminary breakdown process.
Point 4 shows E field pulses thought to be produced by the last few steps of the stepped leader as it approaches the ground.
The fast E field waveforms produced by 1st and subsequent strokes are distinctly different. The 1st return stroke field variations following the peak are considerably noisier than is observed with subsequent strokes. Some of the "noise" on the 1st return stroke E field record is probably produced by branches. Some of the structure on both the 1st and subsequent stroke waveforms is probably due to channel tortuosity.
Some of the modern lightning detection and location instrumentation is able to distinquish between return stroke waveforms and waveforms produced by leaders or discharges that occur during the preliminary breakdown activity.
The next figure is essentially the same except that some continuing current has been added following the second stroke.
The next figure illustrates a triggered lightning discharge. The figure shows a typical slow E field record and a record of the current that would be measured at the ground instead of a fast E field waveform.
Triggered
discharges are initiated by an upward propagating,
positively charged leader which is followed by a
continuous current. This is followed by
downward moving, negatively charged dart leaders
and subsequent return strokes. The dart
leaders and subsequent strokes are thought to be
similar to those that occur in natural CG
discharges.
I showed the last portion of a video produced by Mason Quick, a PhD student working with Drs. Krider and Cummins in our department. The video has some pretty spectacular examples of rocket being triggered at the International Center for Lightning Research and Testing operated by the University of Florida near Gainesville, Florida. And here I think I can include links to the long (shown in class) and short versions of the video.
And here are several links with more information and videos of triggered lightning.
Lightning research group at the University of Florida
UF Florida site at Camp Blanding
Longer compilation from Florida (and Langmuir Lab in New Mexico?)
The first link has some photographs of fulgurites recovered at the ICLRT site in Florida.
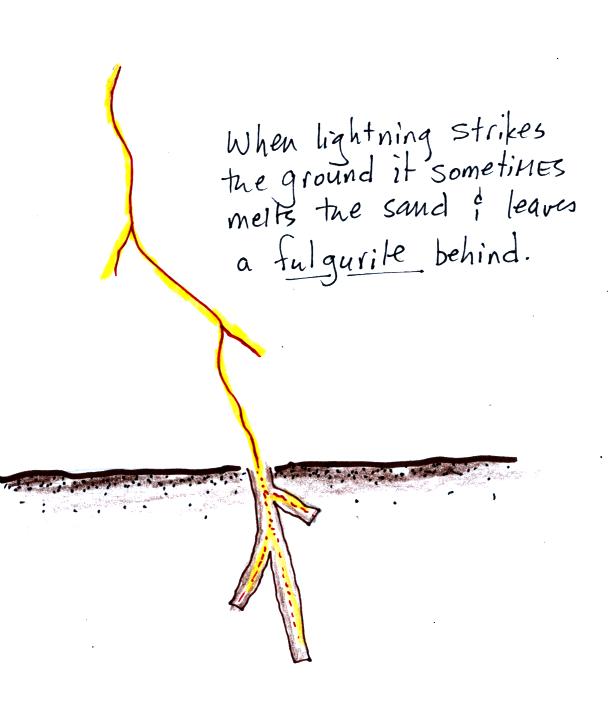
The photograph below was shown in class and was indeed made at the ICLRT site in 1996. It is apparently the world's longest (17 feet) excavated fulgurite (see V.A. Rakov, "Lightning Makes Glass")

I showed the last portion of a video produced by Mason Quick, a PhD student working with Drs. Krider and Cummins in our department. The video has some pretty spectacular examples of rocket being triggered at the International Center for Lightning Research and Testing operated by the University of Florida near Gainesville, Florida. And here I think I can include links to the long (shown in class) and short versions of the video.
And here are several links with more information and videos of triggered lightning.
Lightning research group at the University of Florida
UF Florida site at Camp Blanding
Longer compilation from Florida (and Langmuir Lab in New Mexico?)
The first link has some photographs of fulgurites recovered at the ICLRT site in Florida.
The photograph below was shown in class and was indeed made at the ICLRT site in 1996. It is apparently the world's longest (17 feet) excavated fulgurite (see V.A. Rakov, "Lightning Makes Glass")