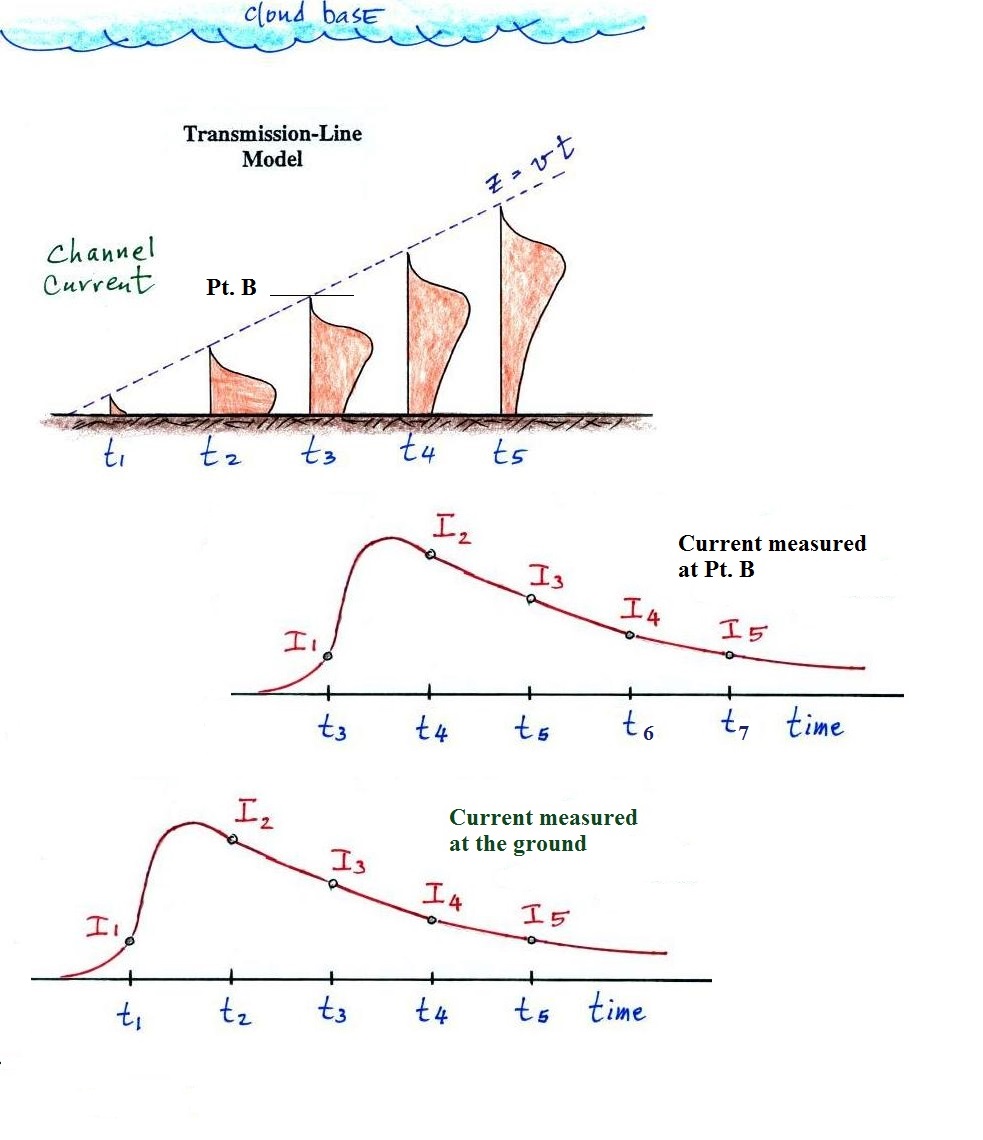
You couldn't ask for a simpler relationship between Erad and I (or dErad/dt and dI/dt).
Erad has the
same shape as the current waveform measured at the
ground. Ditto for dErad/dt and dI/dt.
These expressions are widely used to
estimate Ipeak and peak values of dI/dt from measured Erad and
dErad/dt.
Note that both peak I and peak dI/dt
occur when the tip of the upward moving return stroke
current waveform is close to the ground. The
assumption that the return stroke channel is straight and
vertical might not be too bad at this point. The
assumption that sin θ = 1 is also satisfied
The discussion of lightning return stroke current models was
interrupted at this point to take a look at HW#6 pt.
1. The assignment deals with the data shown in the
figure below:

|
|
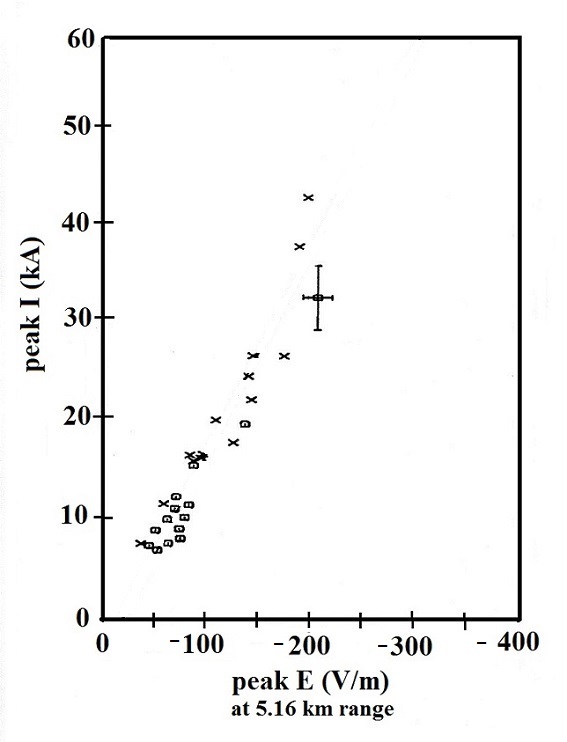
The figure at left shown 28 simultaneous measurements of
peak I and peak E. Measurements of peak dI/dt and peak
dE/dt for the same 28 discharges are shown at right.
The I and dI/dt data were measured in subsequent return
stroke discharges triggered at the Kennedy Space
Center. The E and dE/dt data were measured at a
location 5.16 km away. The data are from Willett et
al. (1989), a full citation and a link to the report can be
found at the end of today's notes. You'll also find
more information about the experiment in the Supplementary
Reading section "An
experimental test of the transmission-line model."
The fact that the points appear to be linearly distributed
would seem to confirm that TL model prediction of a direct
proportionality between Ipk and Epk (also [dI/dt]pk and
[dE/dt]pk). In the assignment you are first supposed
to fit a straight line to both sets of data. The line
should be constrained to pass through the origin, thus a
line y = ax rather than y = ax + b (some additional
information about how to do this is included on the
assignment).

We'll pretty much be limiting our attention to the
transmission-line model from this point onward.
Nonetheless there is one additional model that should be
mentioned before we finish this section.
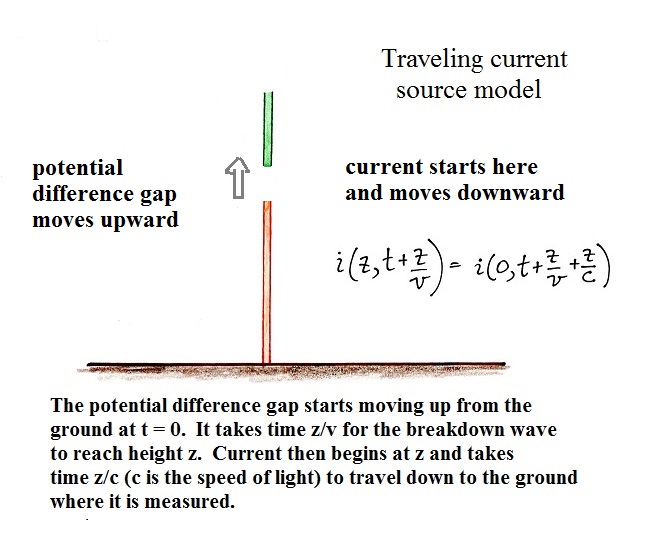
Traveling current source (TCS) model
The TL model is probably the easiest to visualize. You
inject a current signal into the lightning channel at ground
level and the signal propagates up the channel at constant
speed without any change in shape. In the TCS model
currents don't begin at the ground and travel upward,
currents begin above the ground and travel downward.
The TCS model is harder (for me at least) to
visualize. In this model (originally proposed by
Heidler (1985)) current at some level above the ground
doesn't start until the potential difference gap separating
cloud and ground potential (separating the bottom of the
leader from the top of the upward moving return stroke
channel) has reached that level. That takes time t =
z/v. Then charge surrounding the leader core flows
into the return stroke channel and then travels downward to
the ground (at the speed of light) where it is
measured.

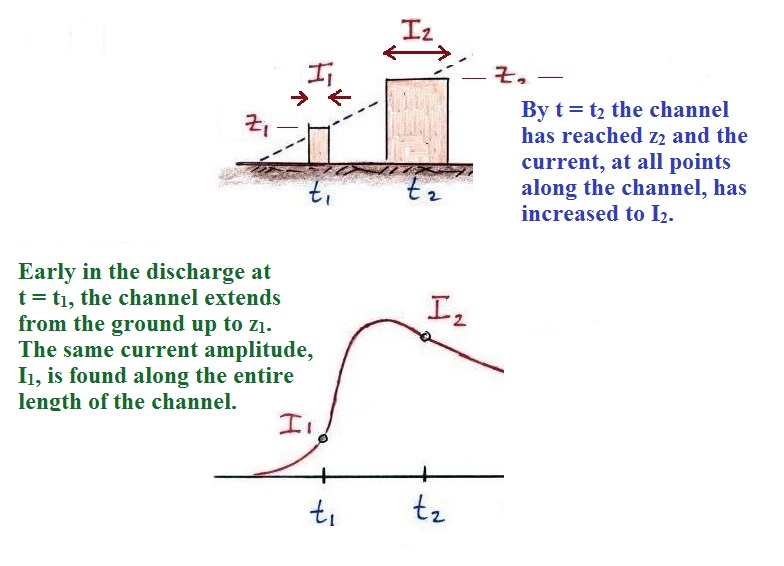
We can also show a diagram of the current waveforms that
would be seen at different levels above the ground and
also how currents vary along the channel at different
times.
Note that current waveform at a given
level above the ground begins discontinuously
(instantaneously). This presents a problem when
computing the E and B fields because dI/dt is
infinite. The Diendorfer-Uman model (DU) modifies
the TCS model and turns the current on more
gradually. I mention this here because you'll see
the DU model in a list that ranks the various models later
in these notes.
We won't discuss the TCS model further at this
point. However there is an interesting result from
this model that we will refer to in the next class or two.


