Friday Sept. 22, 2006
Quiz #1 was returned in class
today. The average was -49 (76%), the class homepage shows you
how to calculate your percentage grade. Be sure to check you quiz
carefully to be sure that it was graded correctly and that the points
missed were added up correctly.
The Experiment 2 materials were
distributed in class today. It won't take more than about 30
minutes to collect the experiment data. Why not do the experiment
this
weekend, return the materials early next week, and pick up the
supplementary information sheet (before you get busy with a new
optional assignment, new 1S1P reports, and studying for the next quiz).
There is a new reading assignment.
Today we will:
1. Finish up the material on upper level charts
2. See a short demonstration that
has been making the rounds through the other NATS
101 classes
3. Finish up with the Piccards by
watching a short video segment on Bertrand Piccard's first successful
trip around the globe nonstop in a balloon.
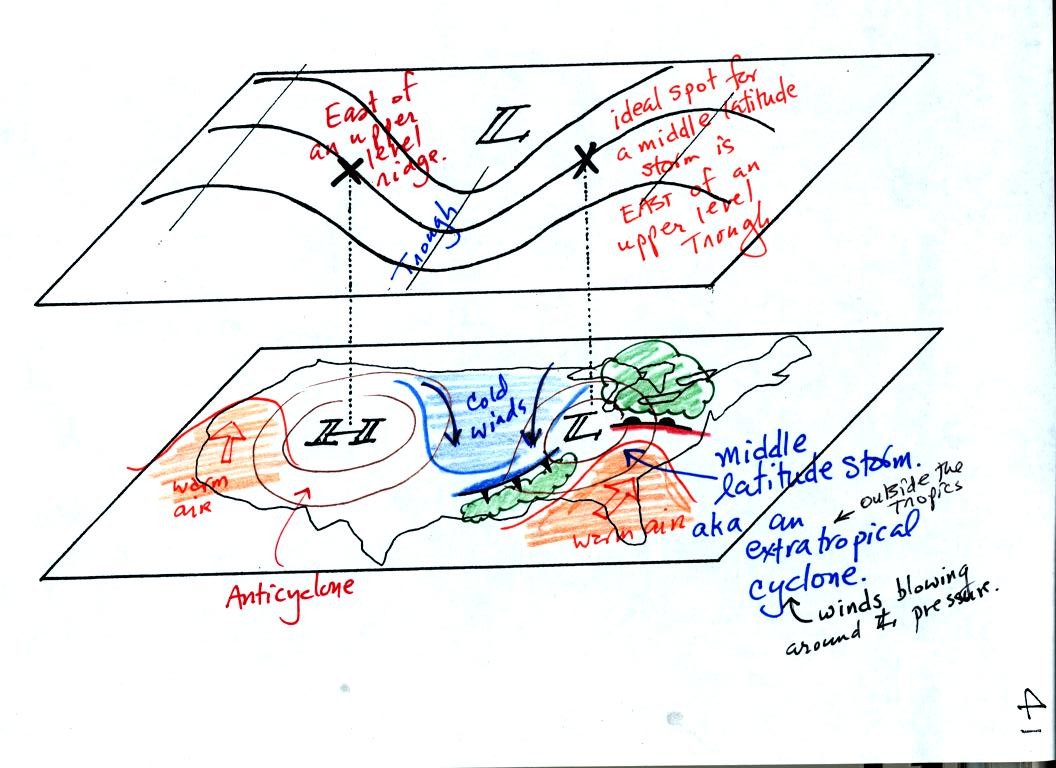
This is where we left off on Monday.
A surface LOW positioned below the X on the upper level chart (to the
east of the upper level trough) is in a perfect position to
intensify. Why? Because you'll often find upper
level divergence at that
location. Upper level divergence, if it is strong
enough, can cause the surface LOW pressure to get even
lower which will cause the storm to intensify.
We will see what upper level divergence looks like and the effect that
it can have in the next few figures. The following figures were
on a handout distributed in class and should replace the figure on p.
42 in the photocopied class notes.
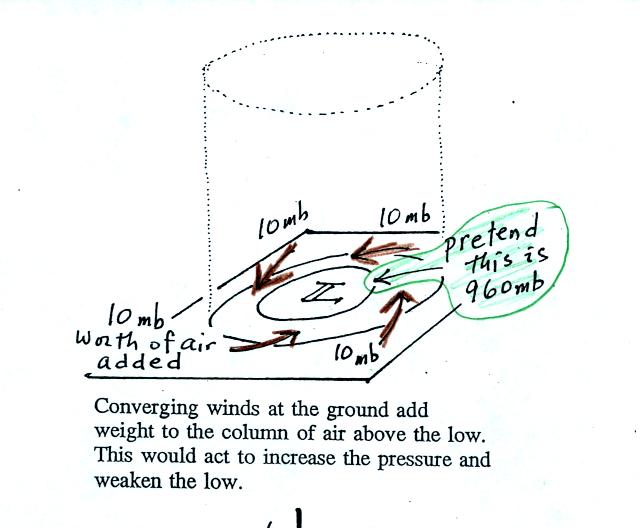
In the figure above we see a surface LOW (with
960 mb
pressure). Winds are spinning counterclockwise and spiraling in
toward (converging) the center of the low. These surface winds
are moving air into the column of air and (as explained on the figure)
should cause the pressure in the center of the LOW to increase.
Imagine that each arrow brings in enough air to increase the pressure
at the center of the LOW by 10 mb. You would expect the pressure
at the center of the LOW to increase from 960 mb to 1000 mb as shown in
the next figure.
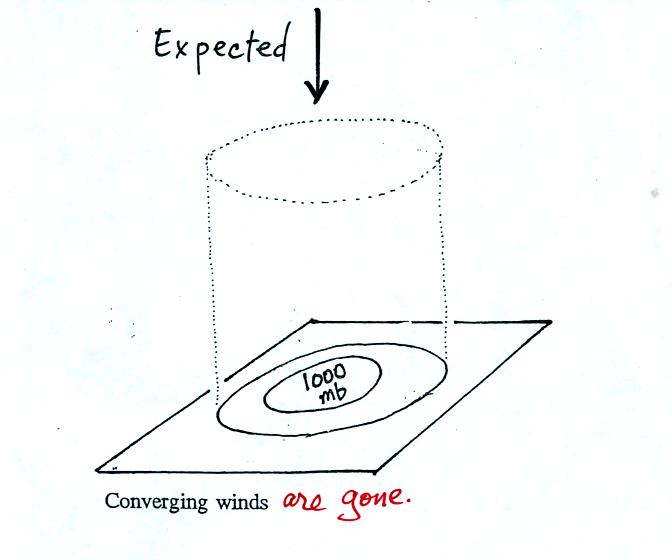
Because the pressure at the center of the LOW has increased to 1000 mb
(which we will pretend is about the same as the pressure in the
surrounding atmosphere, there is not longer a pressure difference
and the converging winds are gone.
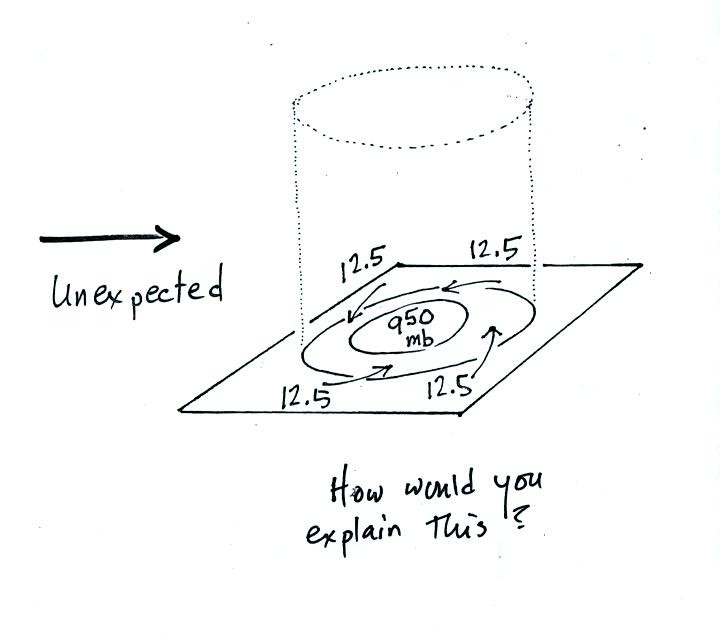
Now what
if instead of increasing from 960 mb to 1000 mb, the pressure
decreased, from 960 mb to 950 mb say? How would you explain
that?
This is just like a bank account. You have $960 in the bank and
make four $10 dollar deposits. You would expect your bank account
balance to increase from $960 to $1000. What if your account
balanced dropped to $950? How would you explain that?
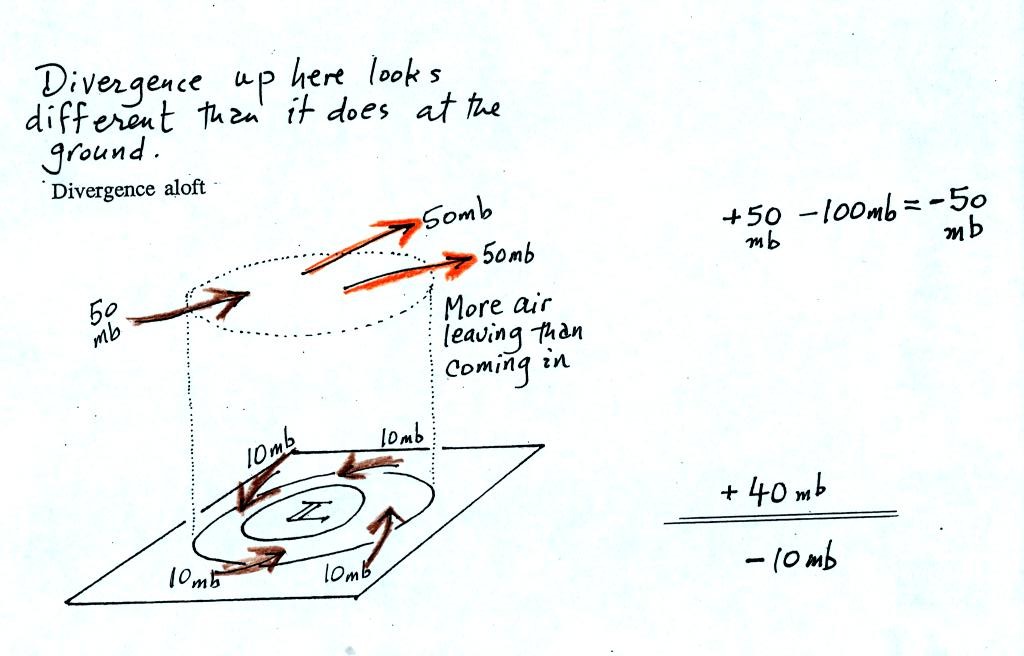
The figure above shows what is going on. We're back to the
starting point again, we have a surface low with a central pressure of
960 mb. The converging winds are each carrying in 10 mb worth of
air into the column.
What's new is the addition and removal of air at upper levels.
Imagine that 50 mb worth of air are added to the column and 50+50=100
mb worth of air are removed. That's a net removal (net
divergence) of 50 mb.
So now we have 40 mb worth of air being added at the ground (surface
convergence) and 50 mb worth being removed at upper levels (upper level
divergence). The grand total is 10 mb of removal. The
surface pressure will decrease slightly. That's why the 960 mb
LOW drops to 950 mb.
You can apply the numbers in the right hand picture to the bank account
problem. You have $960 in the bank and make 4 $10 deposits.
However you also deposit $50 dollars and make 2 $50 withdrawals (the
top of the picture). That's a total of $90 being deposited and
$100 being withdrawn. Your bank account goes down $10.
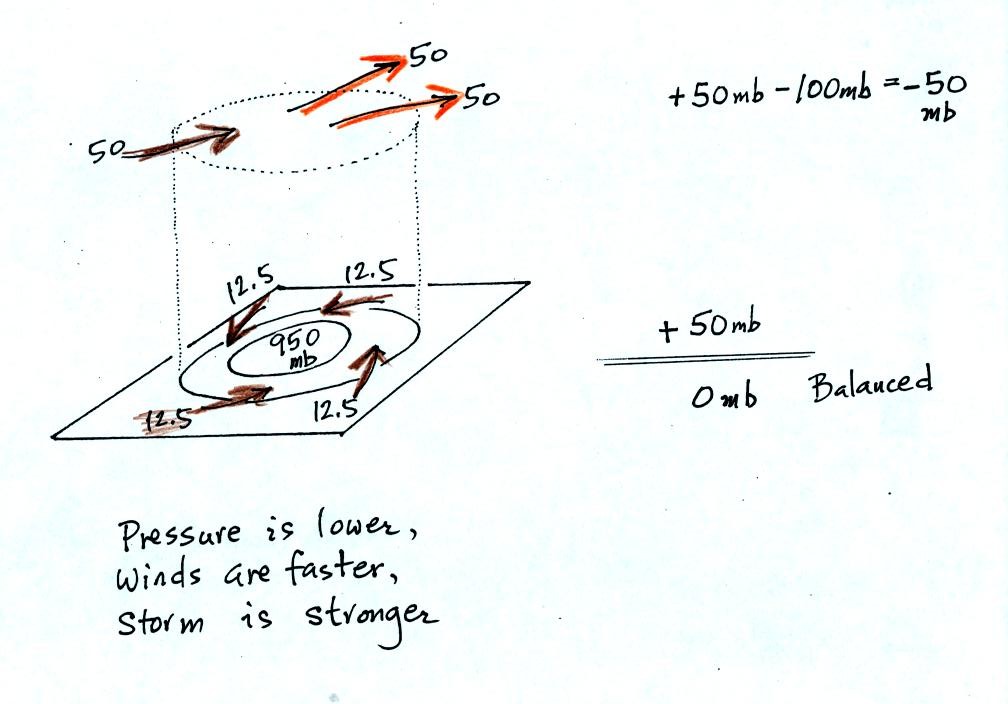
Note with the lower central pressure, the converging winds will
strengthen and carry more air into the column. In this figure we
have assumed the strengthening winds now each carry 12.5 mb worth of
air into the column. The converging surface winds are now
carrying in as much air as is being lost at upper levels. The
surface LOW pressure center won't change, everything is in balance.
In a case like this where upper
level divergence > surface convergence, the surface LOW
pressure will get even lower (the low will "deepen") and the storm will
strengthen.
The other possibility is that the upper level divergence <
surface convergence. In this case the LOW pressure will
increase (the low will "fill") and the storm will weaken.
Click here for some additional
examples. By working through some additional examples you might
increase your understanding of this material and build up your
confidence (of course there's always a chance that more examples will
just make this topic more confusing - the choice is yours)
We can
apply these concepts to hurricanes and understand why hurricanes can
intensify and get so strong.
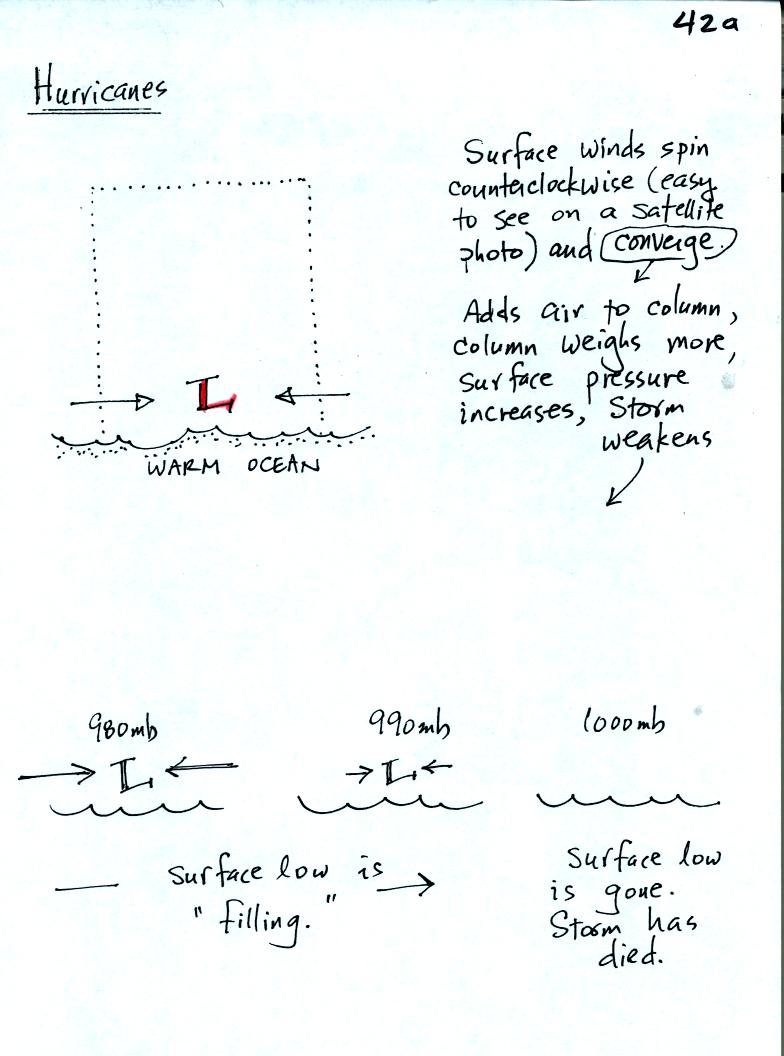
You find surface low pressure in the center of a hurricane (a
general name for a hurricane is tropical cyclone- the word cyclone
refers to the winds that spin around low pressure).
Record-setting low sea level pressure values have all been observed in
hurricanes.
In this first picture we consider the converging surface winds
only. These winds will add air to the cylinder of atmosphere that
is the hurricane. This will increase the surface pressure and the
storm will fill (surface pressure will increase) and the storm will
weaken. The storm would eventually dissipate.
Now we know that sometimes hurricanes strengthen despite the converging
winds that blow at the surface.
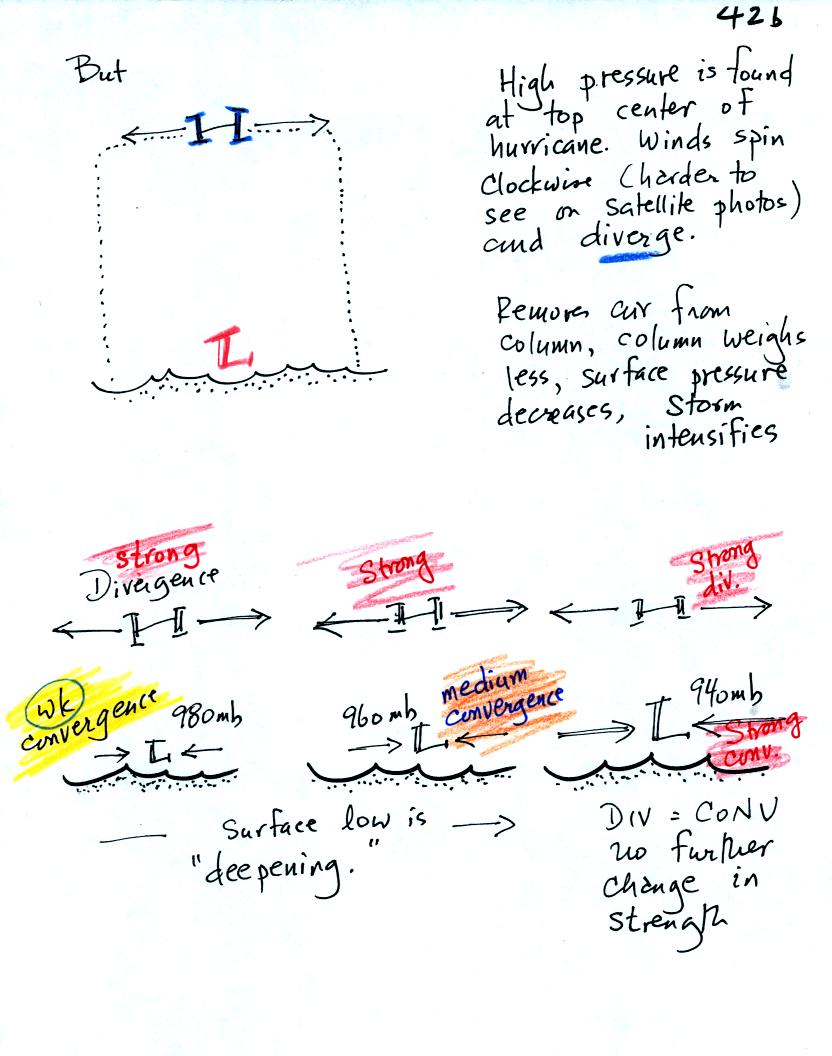
We will find, later in the semester, that high pressure is
found at the
tops of hurricanes. This means the upper level winds will
diverge. If the upper level divergence exceeds the surface
convergence, air will be removed from the colume, the surface pressure
will get lower, and the hurricane will strengthen. This is
illustrated at the bottom of the figure above. The surface LOW in
the center of the hurricane gets lower and lower. As the pressure
drops the winds increase in speed and bring more air into the column.
Eventually the convergence at the bottom and the divergence at the top
of the hurricane balance and the storm doesn't strengthen any further.
This
figure wasn't shown or discussed in class.
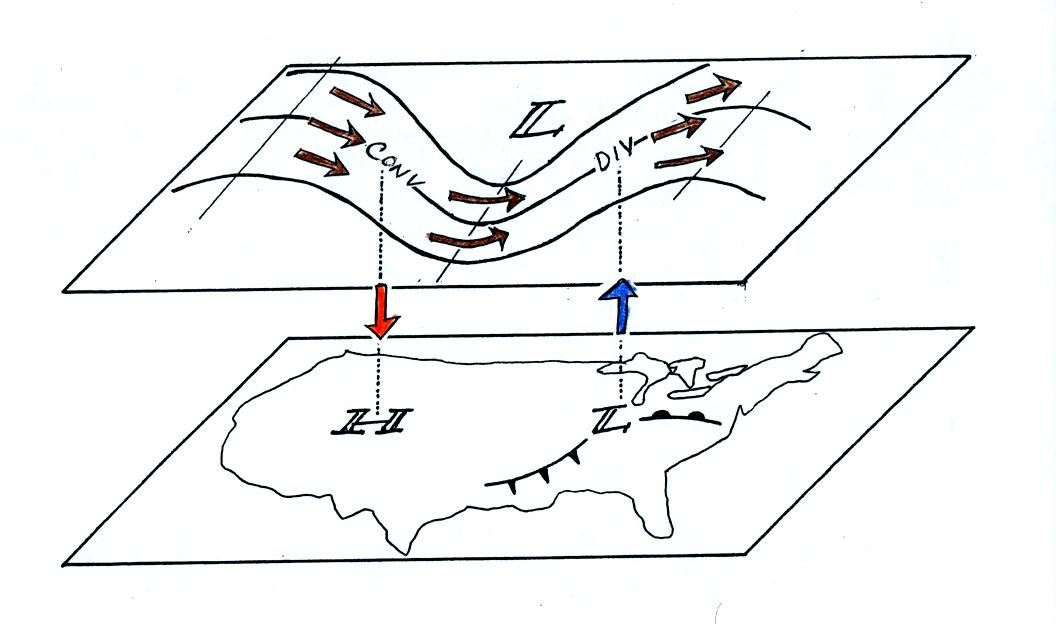
Now that you have some idea of what upper level divergence looks like
you are in a position to understand another one of the relationships
between the surface and upper level winds.
One of the things we have learned about surface LOW pressure is that
the converging surface winds create rising air motions. The
figure above gives you an idea of what can happen to this rising air
(it has to go somewhere). Note the upper level divergence in the
figure: two arrows of air coming into the point "DIV" and three arrows
of air leaving (more air going out than coming in is what makes this
divergence). The rising air can, in effect, supply the extra
arrow's worth of air.
Three arrows of air come into the point marked "CONV" on the upper
level chart and two leave (more air coming in than going out).
What happens to
the extra arrow? It sinks, it is the source of the sinking air
found above surface high pressure.
Now back
to something we have already covered. People will float or sink
in a pool of water depending on whether they are slightly less dense or
slightly more dense than water.
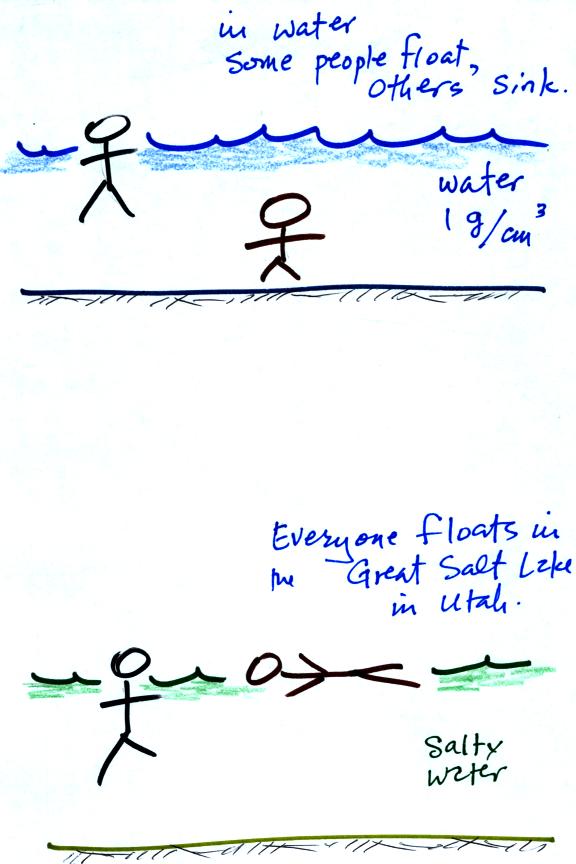
Everyone floats in the Great Salt Lake because the density of the salty
water is higher, around 1.1 g/cm3
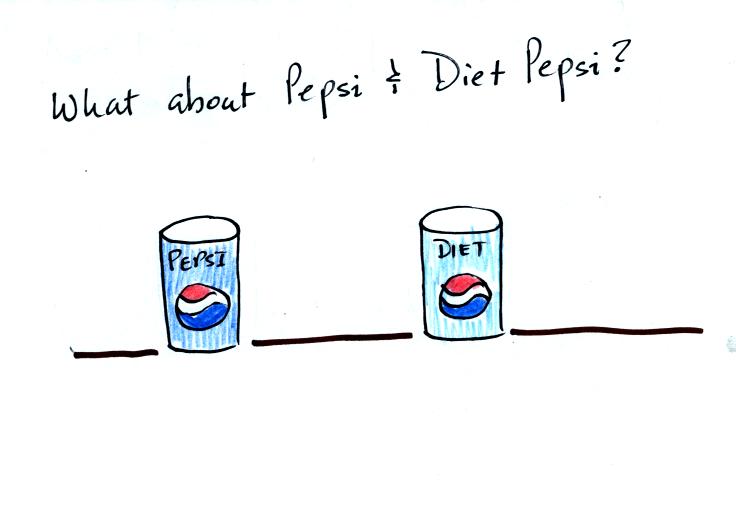
If you place a can of regular Pepsi and a can of Diet
Pepsi in water, you will find that the can of diet cola floats while
the regular cola sinks.
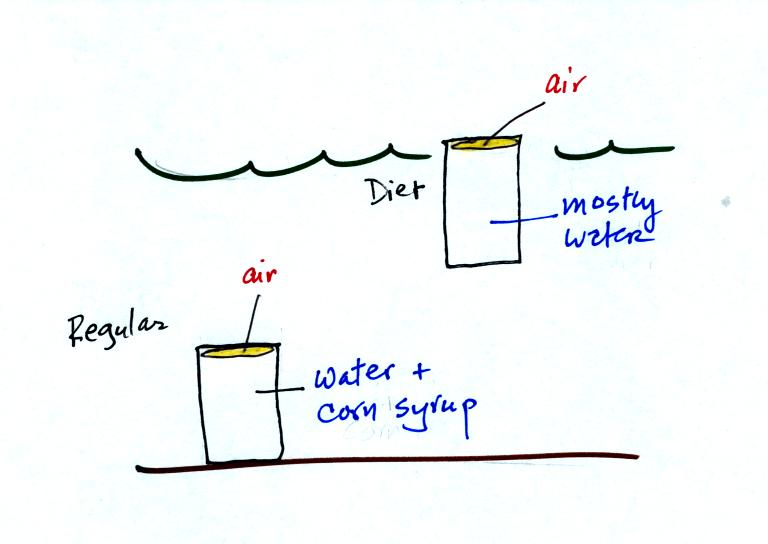
The can of diet cola is mostly water will a little bubble of air
inside the top of the can. The density of this combination of
cola, air, and aluminum (in the can) is less than the density of water.
The regular cola is similar except that instead of water there is a
mixture of water and corn syrup (sweetener). The corn syrup makes
this can more dense than water.
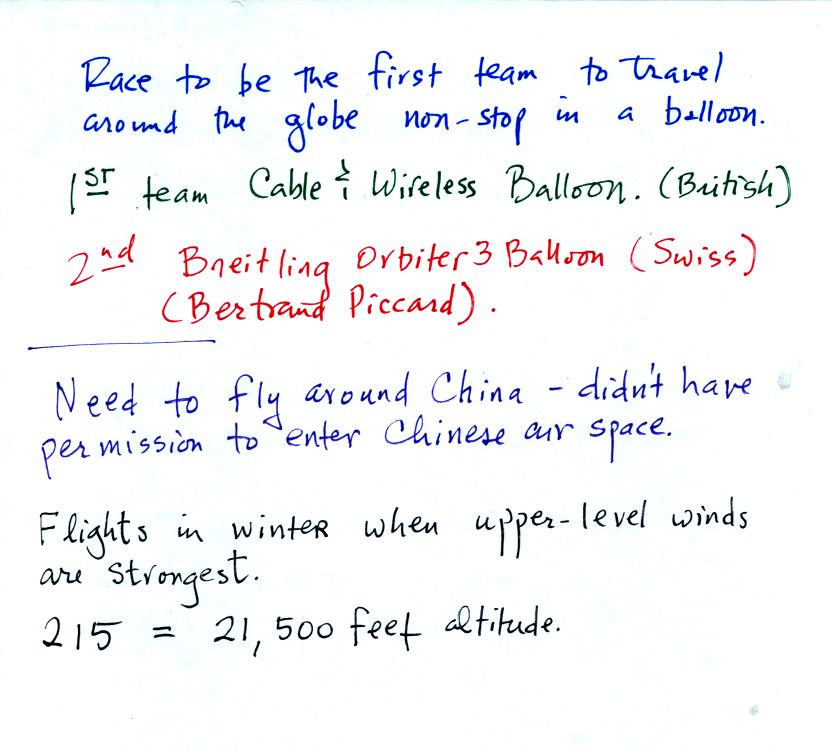
We finished class looking at a short video segment of the first
non-stop trip around the globe in a balloon. Bertrand Piccard was
a member of the 2-man team aboard the Breitling Orbiter 3. They
completed their trip in March, 1999.