Wednesday Sept. 12, 2007
The Optional Assignment is due at the start of class on Friday.
The first 1S1P assignment and the Experiment #1 reports are due next
Monday. Experiment #1 materials need to be returned this week so
that they can be cleaned and handed out next week to the students doing
Experiment #2.
The Quiz #1 Study Guide (preliminary
version) is now available. Next week's quiz will cover material
on the Practice Quiz Study Guide and the
Quiz #1 Study Guide.
Now we
will put what we have learned to use and plot a bunch of weather data
on a surface map:
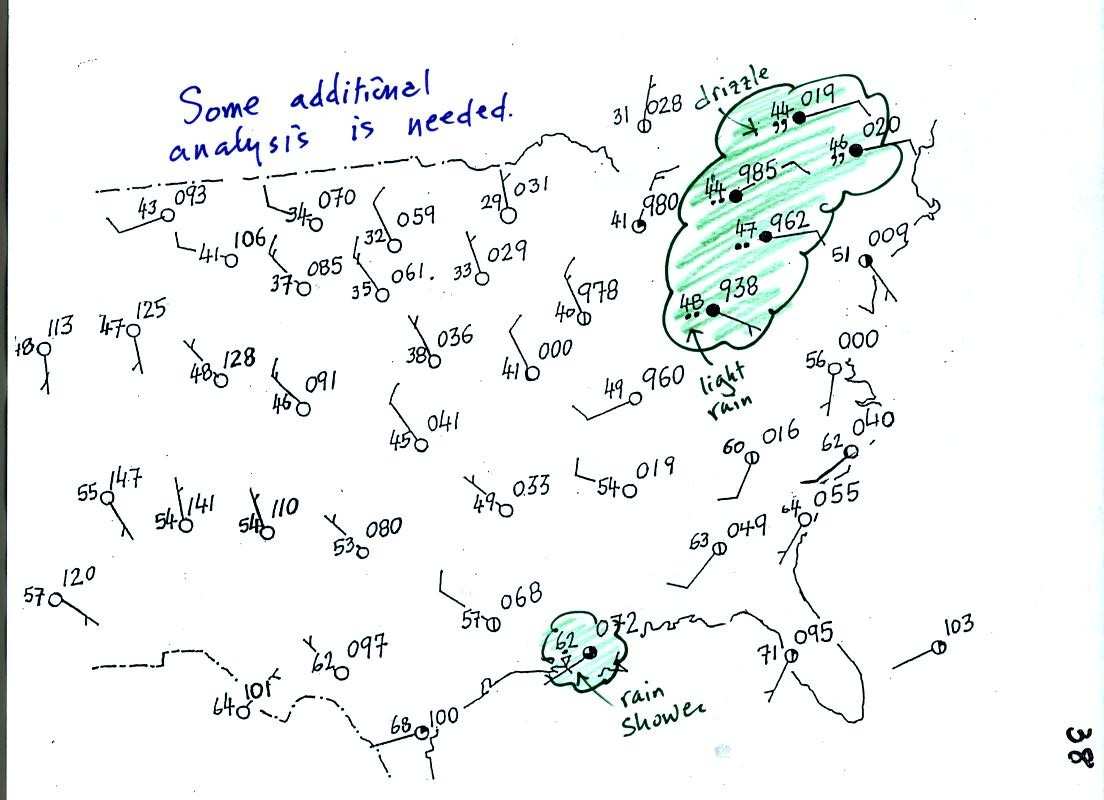
Plotting the surface weather data on a map is just the
beginning.
For example you really can't tell what is causing the cloudy weather
with rain and drizzle in the NE portion of the map above or the rain
shower at the location along the Gulf Coast. Some additional
analysis is needed. A meteorologist would usually begin by
drawing some contour lines of pressure to map out the large scale
pressure pattern. We will look first at contour lines of
temperature, they are a little easier to understand.
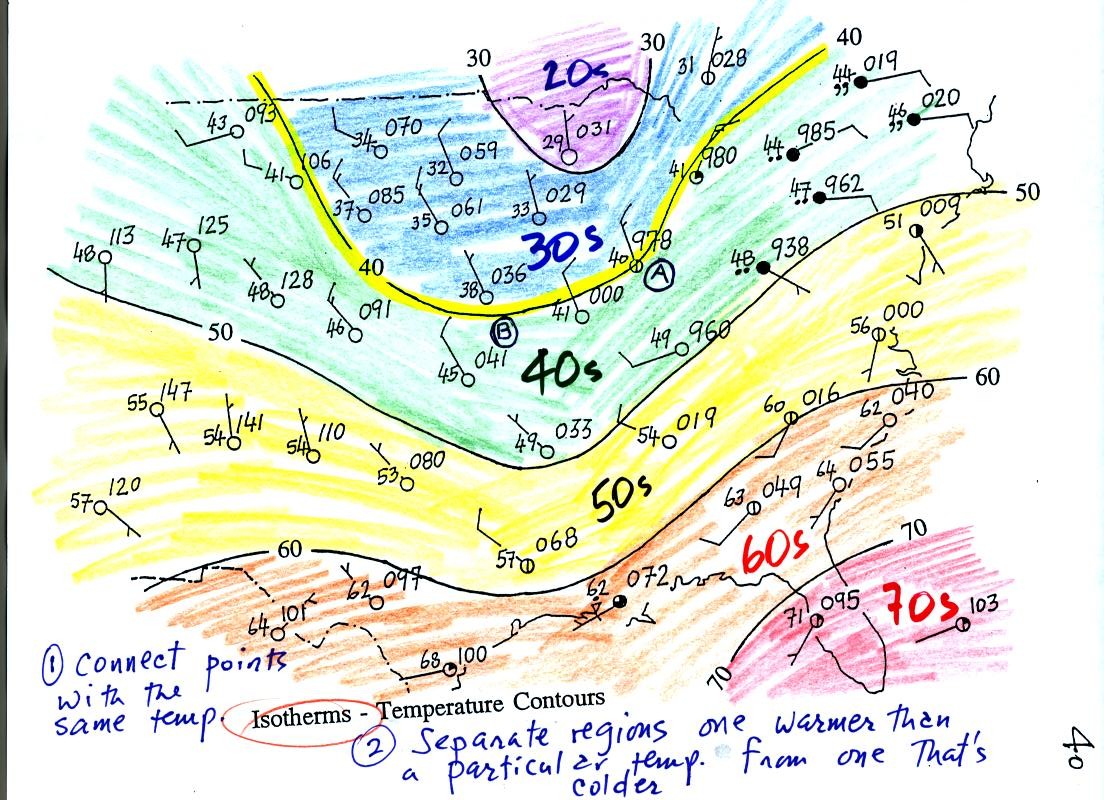
Isotherms, temperature contour lines, are drawn at 10 F
intervals.
They do two things: (1) connect points on the map that all
have the same temperature, and (2) separate regions that are warmer
than a particular temperature from regions that are colder. The
40o F isotherm highlighted in yellow above passes through
one City A reporting a temperature of exactly 40o.
Mostly it goes
between pairs of
cities: one with a temperature warmer than 40o and the other
colder
than 40o (such as near Point B). Temperatures
generally decrease with
increasing
latitude.
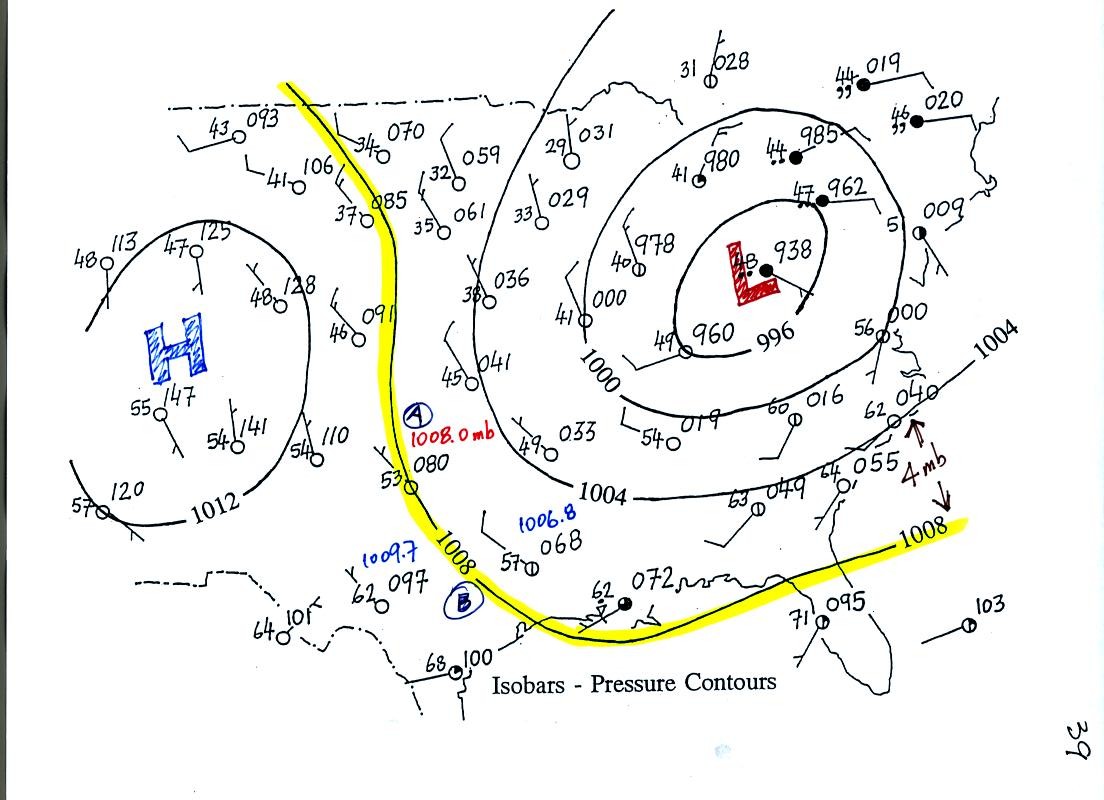
Now the same data with isobars drawn in. Again they
separate
regions with pressure higher than a particular value from regions with
pressures lower than that value.
Isobars are generally drawn at 4 mb intervals. Isobars also connect points on the map
with the same pressure. The 1008 mb isobar (highlighted in
yellow) passes through City A where the pressure is exactly
1008.0 mb. Most of the time the isobar
will pass between two
cities. The 1008 mb isobar passes between cities with pressures
of 1006.8 mb and 1009.7 mb in the vicinity of Point B. You would
expect to find 1008 mb about halfway between
those two cites, that is where the 1008 mb isobar goes.
The pattern on this map is very different from the pattern of
isotherms. On this map the main features are the circular low and
high pressure centers.
What kind of weather can you expect in the vicinity of a low
pressure
center?
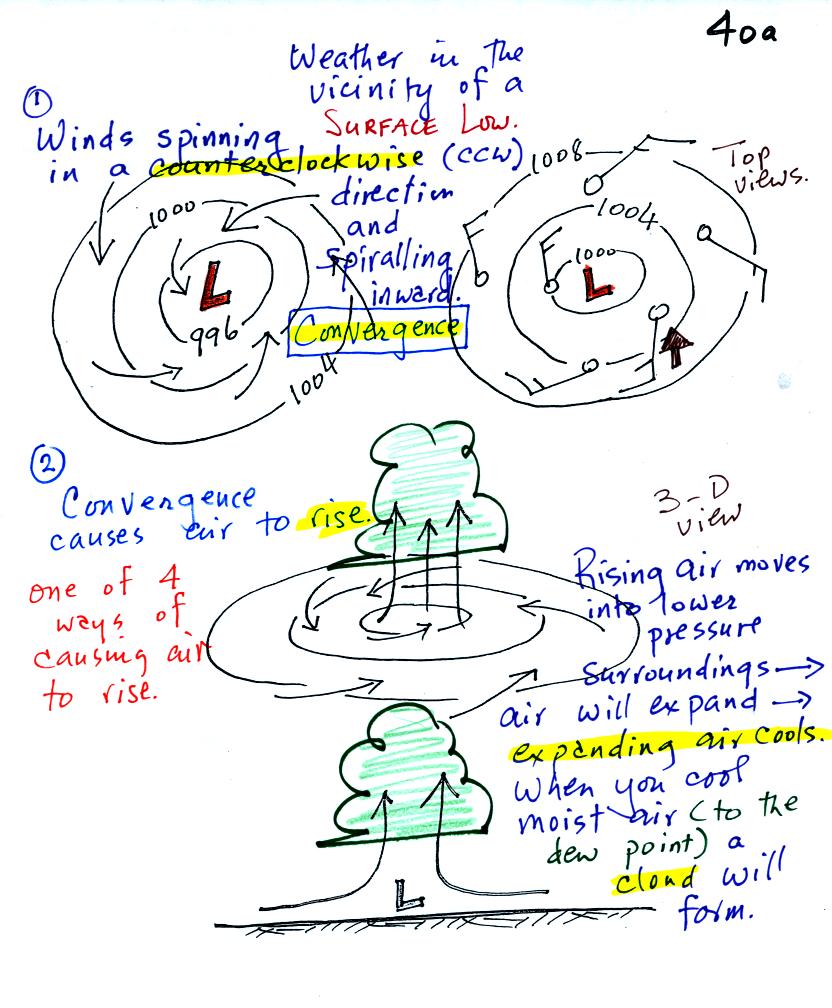
A pressure difference will first start air moving
toward low
pressure (imagine a rock sitting on a hillside that starts to roll
downhill). Then something called the Coriolis force will cause
the
wind to start to spin (we'll learn more about the Coriolis force later
in the semester). Winds spin in a counterclockwise (CCW) direction
around surface
low pressure
centers. The winds also spiral inward toward the center of the
low, this is called convergence. [winds spin clockwise around low
pressure centers in the southern hemisphere but still spiral inward]
The convergence causes the air to rise at the center of the low.
Rising air expands and cools. If the air is sufficiently moist
clouds can form and then begin to rain or snow. Thus you often
see
cloudy skies and stormy weather associated with surface low pressure.
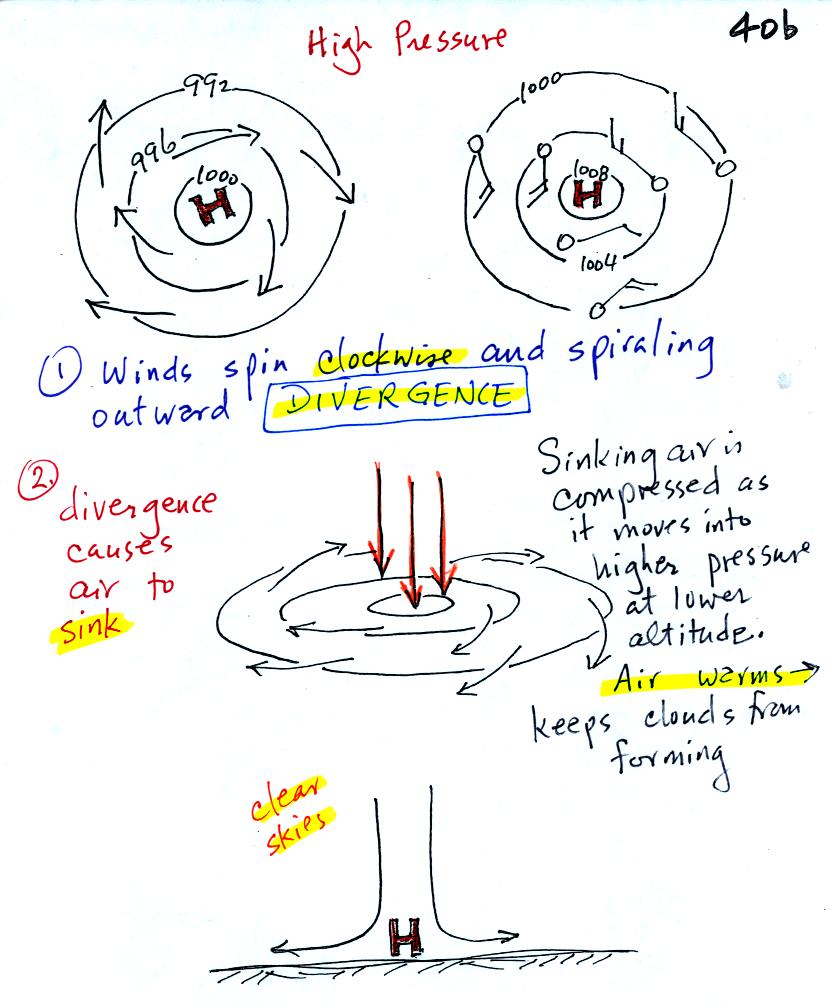
It is pretty much the opposite situation with surface high
pressure
centers. Winds spin clockwise and spiral outward. The
outward motion is called divergence. Air sinks in the center of
surface high pressure to
replace the diverging air. The sinking air is compressed and
warms. This keeps clouds from forming so clear
skies are normally found with high pressure.
The
pressure pattern will also tell you something about how fast you might
expect the wind to blow. In this case we look for regions where
the isobars are either closely spaced together or widely spaced.
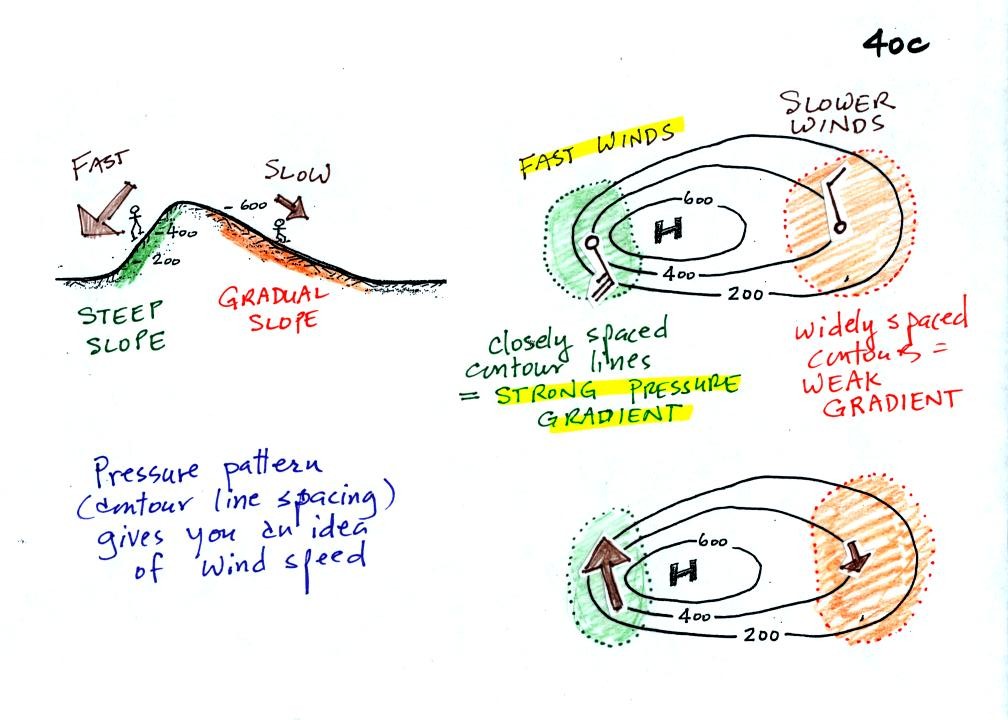
Closely spaced contours means pressure is changing rapidly with
distance. This is known as a strong pressure gradient and
produces fast winds. It is analogous to a steep slope on a
hillside. If you trip, you will tumble rapidly down a steep
hillside, more slowly down a gradual slope.
The winds around a high pressure center are shown above using both the
station model notation and arrows. The winds are spinning clockwise and
spiralling inward slightly.
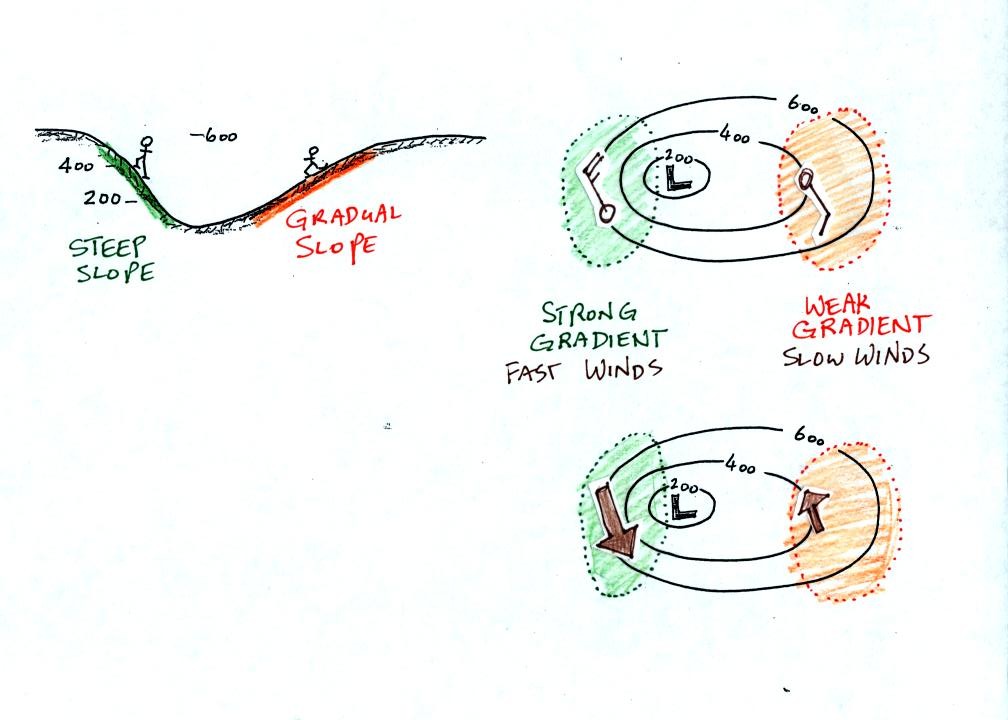
Winds spin counterclockwise and spiral inward around low pressure
centers.
Try to determine the directions of the winds at Points 1, 2, and 3 in
the figure below (found at the bottom of p. 40c in the photocopied
Class Notes). Where will the fastest and slowest winds be
found? Would you expect to find that the temperatures at Points
1, 2, and 3 were equal or different?
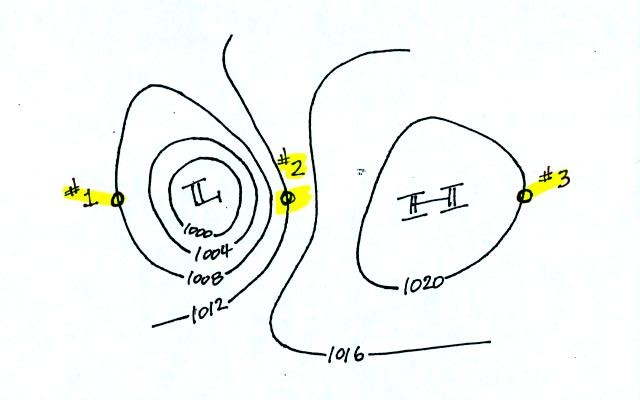
When you thought about these questions for awhile, click here to see the answers.
Finally we
took a brief look ahead at some material we will be covering on Friday
and Monday next week.
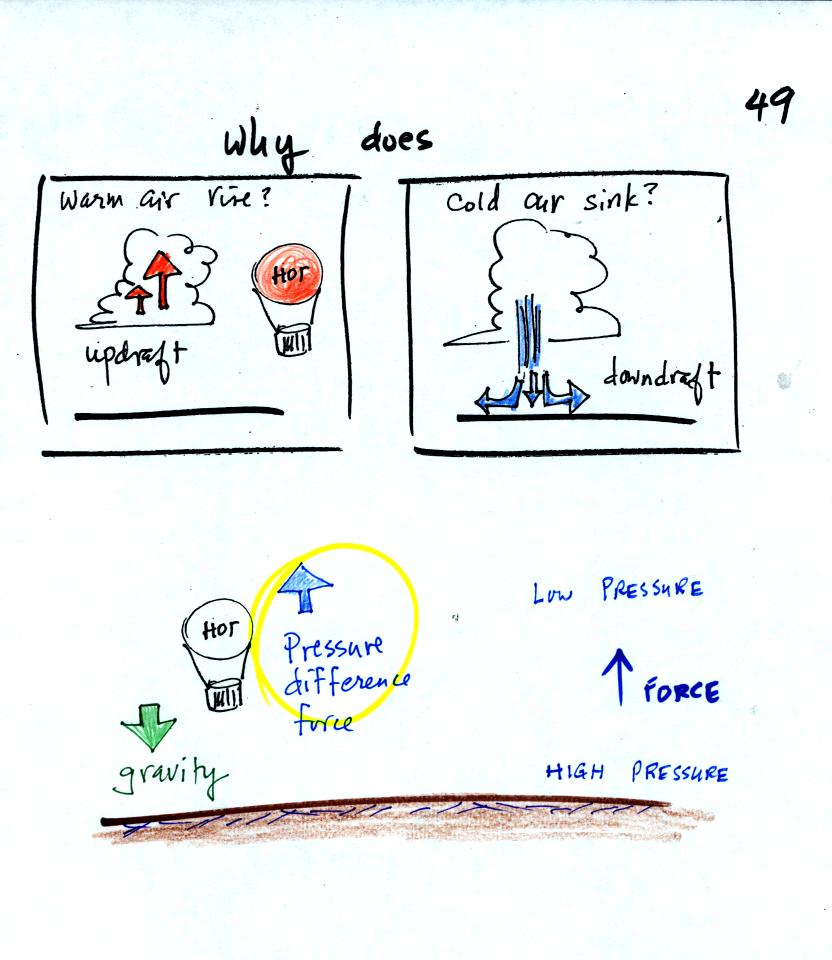
We are going to try to understand why warm air rises
and cold air sinks.
It is always a good idea to have a picture in mind, a hot air balloon
for example.
Hot air balloons do sometimes fall from the sky; most everyone in the
classroom would understand that gravity was the force responsible for
bringing down a hot air balloon.
But what causes a hot air balloon to rise? We will see that it is
a pressure difference force. Pressure decreases with increasing
altitude. This creates a force that points upward from high
toward low pressure.
Understanding rising and sinking air is a 3-step process. The
first step is learning about the ideal gas law.
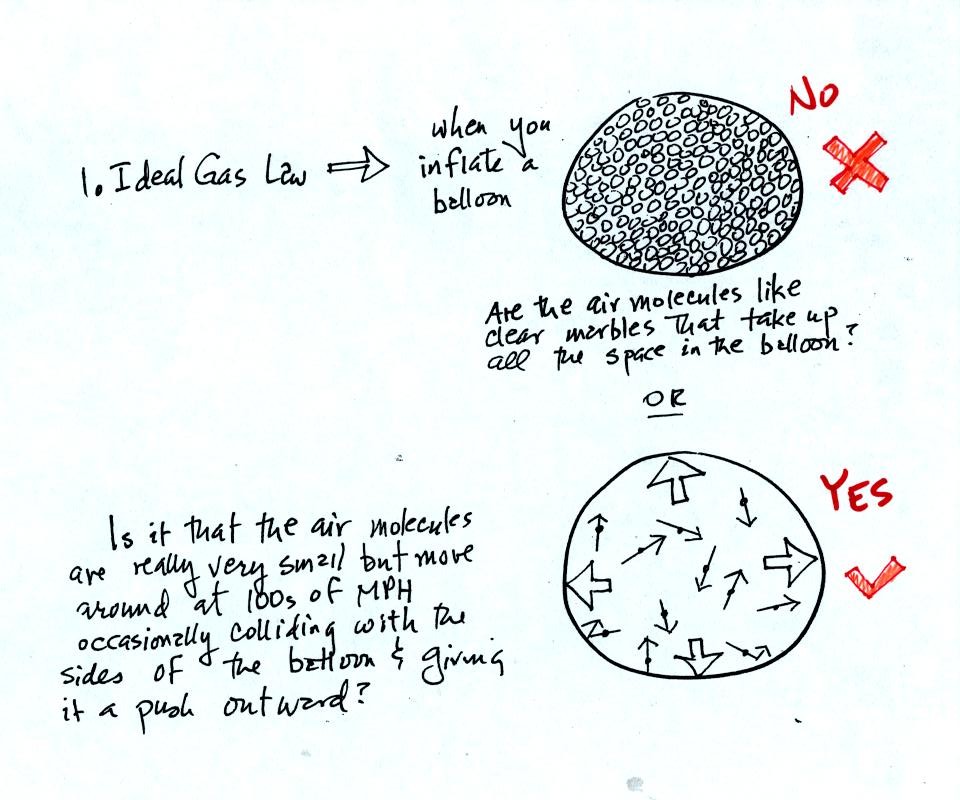
When you fill a balloon with air you don't really fill it
with
air. That is the inside of the balloon is mostly empty
space. The balloon is kept inflated by the rapid motions of the
air molecules which are zipping around inside the balloon and colliding
with the walls of the balloon. The outward push from each
collision is very weak but the collisions are so numerous and frequent
that the total effect is large.
The ideal gas law equation (that we will learn in class on Friday)
explains how pressure depends on variables such as the volume
of the balloon, the temperature of the air, and the number of air
molecules in the
balloon.