Tuesday Mar. 21, 2006 (one day after the Spring Equinox, it was
Mar. 20 this year)
The Quiz #2 papers and about 2/3rds of the 1S1P Assignment #2 reports
were returned in class. The remaining 1S1P reports should be
graded by Thursday. You can begin to total up your 1S1P points
and see how close you are to the 45 pt maximum number of points allowed.
The revised Experiment #1 reports are graded and were returned in class.
The Experiment #3 reports were due
today. If you haven't already returned your
materials and picked up the supplementary information sheet you should
do so today or Wednesday so that you can turn in your report on
Thursday.
Experiment #4 materials were distributed in
class. Reports are due on Tue. Apr. 11. Once you have
collected your data, return the materials and pick up the supplementary
information sheet for this experiment.
Check the class home page for new
reading assignments and a new optional
assignment.
Now we
move to an important new topic: humidity. The beginning of
Chapter 4 can be a little overwhelming and confusing. If you find
it too confusing don't worry about. Study the class notes and
once you feel comfortable with the material there you can go back and
read the beginning of Chapter 4.
A brief introduction to some of the humidity variables is given on p.
83 in the photocopied notes.
We will be mainly interested in 4 variables: mixing ratio, saturation
mixing ratio, relative humidity, and dew point. The following notes differ slightly
from those presented in class. They
have been reorganized a little bit for clarity and a little additional
material and explanation has been added.
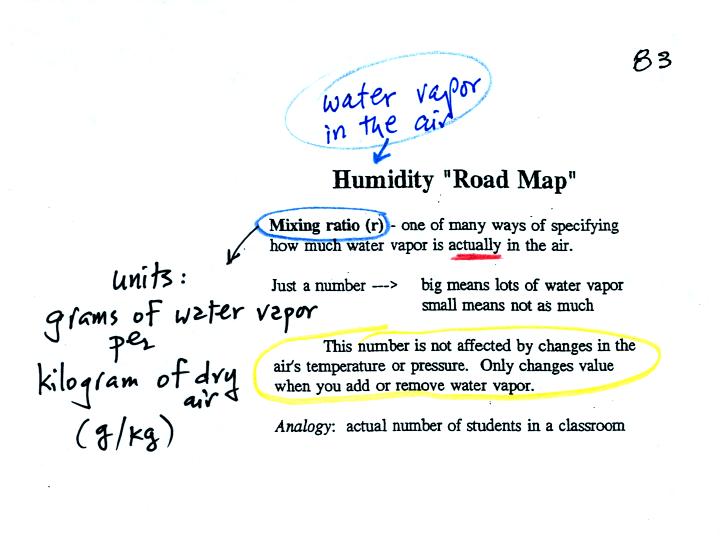
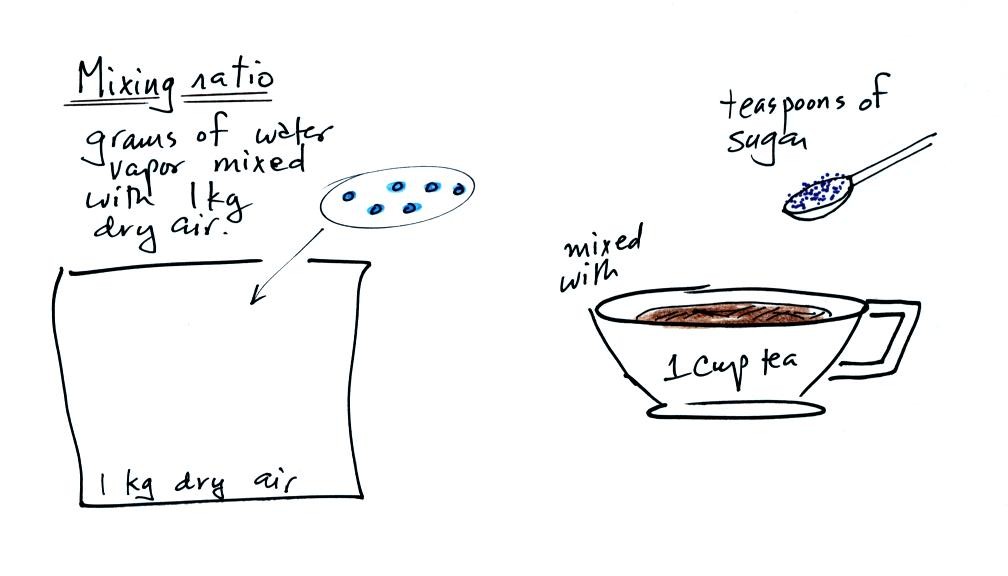
Mixing ratio tells you how much water vapor is actually in
the
air. Mixing ratio has units of grams of water vapor per kilogram
of dry air (how much water vapor in grams is mixed with a
kilogram
of dry air). It is basically the same idea as teaspoons of sugar
mixed in a cup of tea.
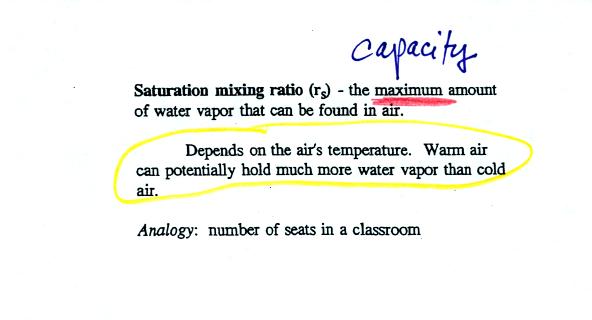
Saturation mixing ratio is just an upper limit to how much
water vapor
can be found in air. It doesn't say anything about how much water
vapor is actually in the air (that's the mixing ratio's job).
Warm air can potentially hold more water vapor than cold air.
This variable has the same units: grams of water vapor per kilogram of
dry air.
The dependence of saturation mixing ratio on air temperature is
illustrated below:
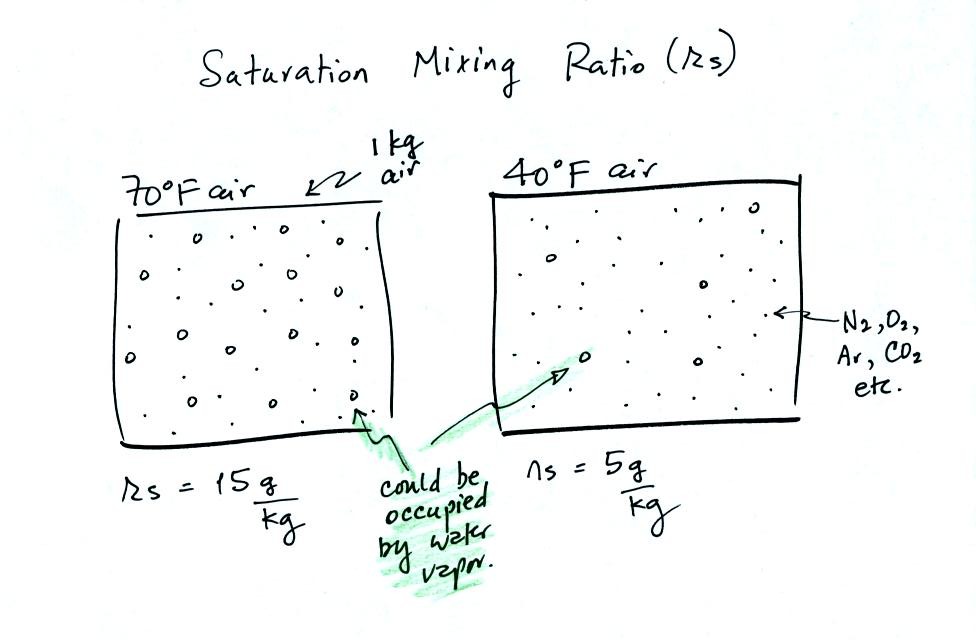
The small specks represent all of the gases in air except for the water
vapor. Each of the open circles represents 1 gram of water vapor
that the air could hold. There are 15 open circles drawn in the 1
kg of 70 F air; each 1 kg of 70 F air could hold up to 15 grams of
water vapor. The 40 F air only has 5 open circles; this cooler
air can only hold up to 5 grams of water vapor per kilogram of dry air.
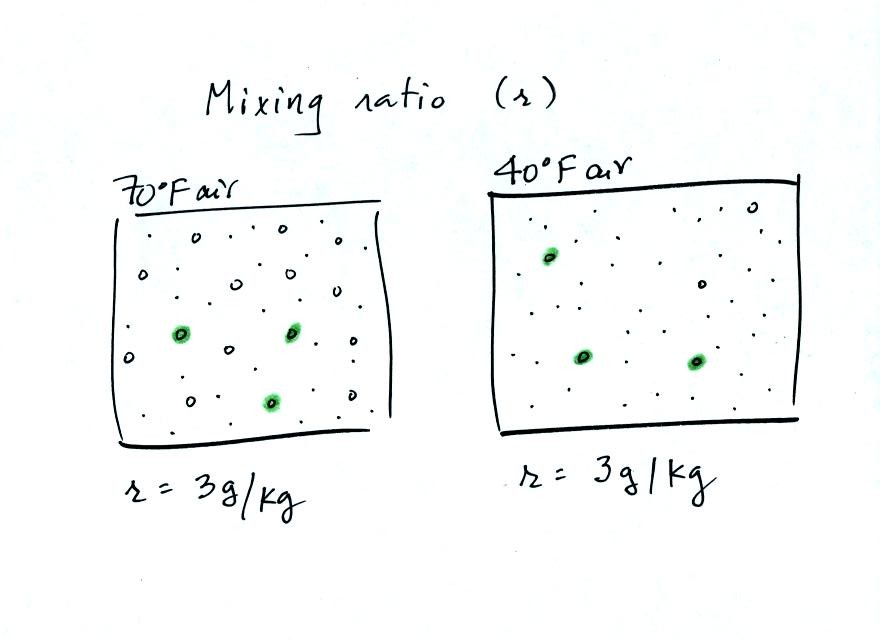
Now we have gone and actually put some water vapor into the volumes of
70 F and 40 F air. 3 grams of water vapor have been added to each
volume of air. The mixing ratio, r, is 3 g/kg.
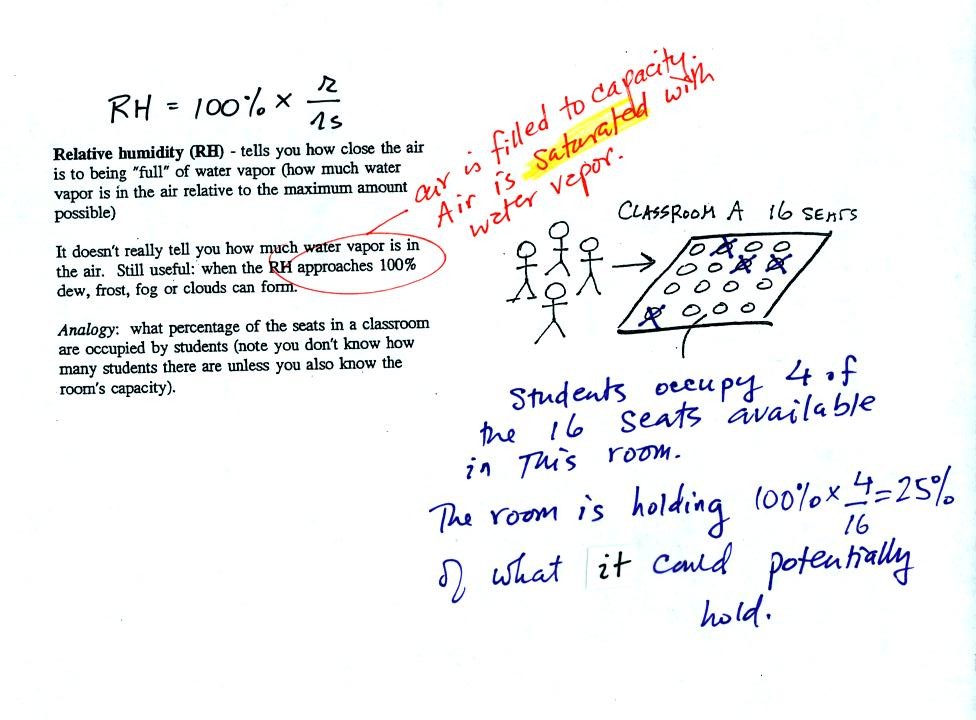
The relative humidity tells you how "full" the air is with water
vapor.
In the analogy 4 students wander into Classroom A which has 16 empty
seats. Classroom A is filled to 25% of its capacity.
You can think of 4, the number of students, as being
similar to the mixing ratio. The classroom capacity is analogous
to the
saturation mixing ratio. Instead of students and a classroom you
could think of a kilogram of warm air that could potentially hold 16
grams of water vapor.
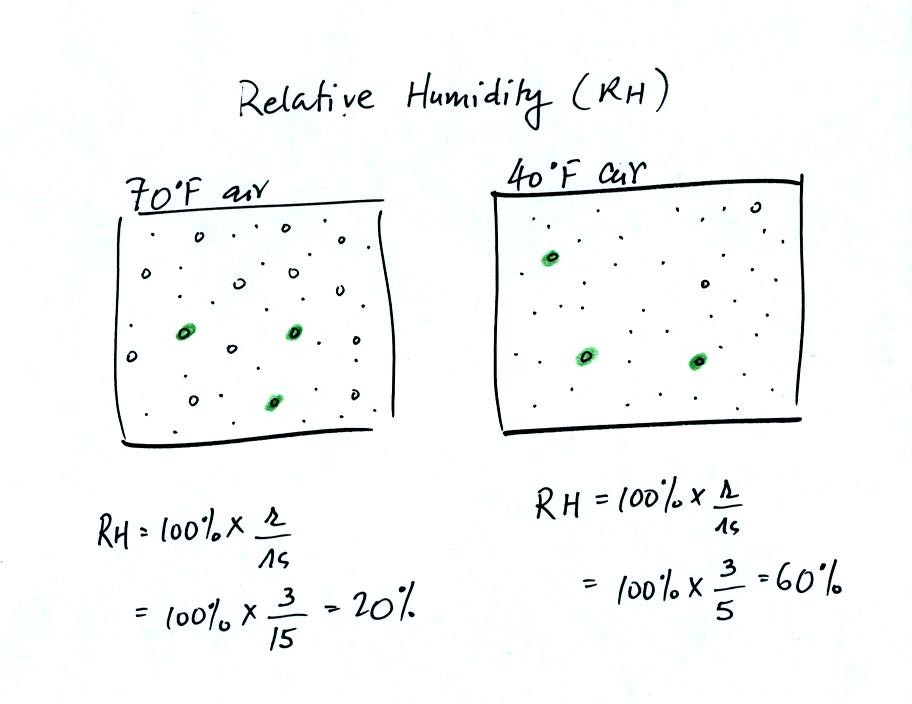
Here are the relative humidities of the 70 F and 40 F air that each
contain 3 grams of water vapor. The 70 F air has a low RH because
this warm air's saturation mixing ratio is large. The RH in the
40 F is higher even though it has the same actual amount of water vapor
because the 40 F air can't hold as much water vapor and is closer to
being saturated.
You can see how RH doesn't really tell you how much water vapor is
actually in the air. The two volumes of air above contain the
same amount of water vapor (3 grams per kilogram) but have different
relative humidities.
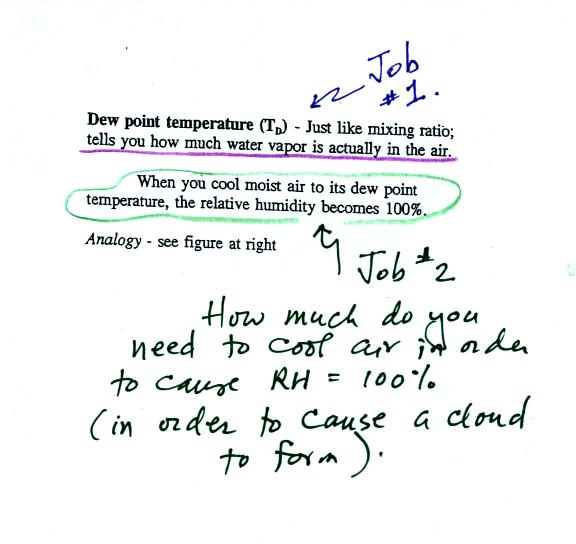
The dew point temperature has two jobs. First it is a measure of
the actual amount of water vapor in the air. In this respect it
is just like the mixing ratio. If the dew point temperature is
low the air doesn't contain much water vapor. If it is high the
air contains more water vapor.
Second the dew point tells you how much you must cool the air in order
to cause the RH to increase to 100% (at which point a cloud, or dew or
frost, or fog would form).
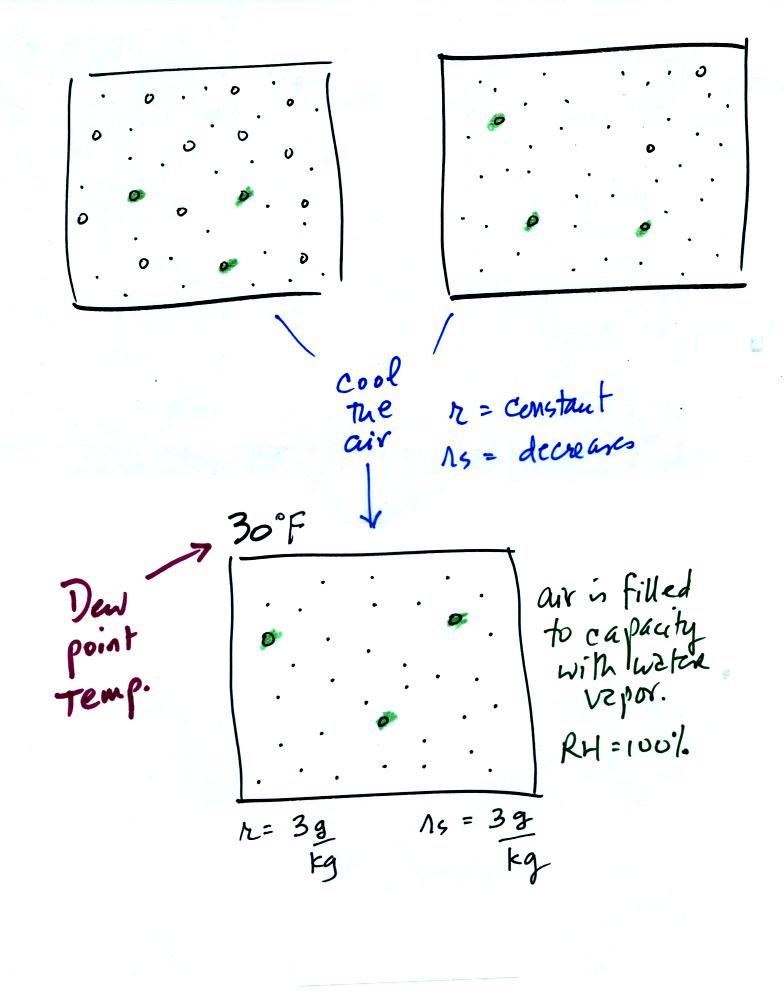
If we cool the 70 F air or the 40 F air to 30 F we would find that the
saturation mixing ratio would decrease to 3 grams/kilogram. Since
the air actually contains 3 g/kg, the RH of the 30 F air would become
100%. The 30 F air would be saturated, it would be filled to
capacity with water vapor. 30 F is the dew point temperature for
70 F air that contains 3 grams of water vapor per kilogram of dry
air. It is also the dew point temperature for 40 F air that
contains 3 grams of water vapor per kilogram of dry air.
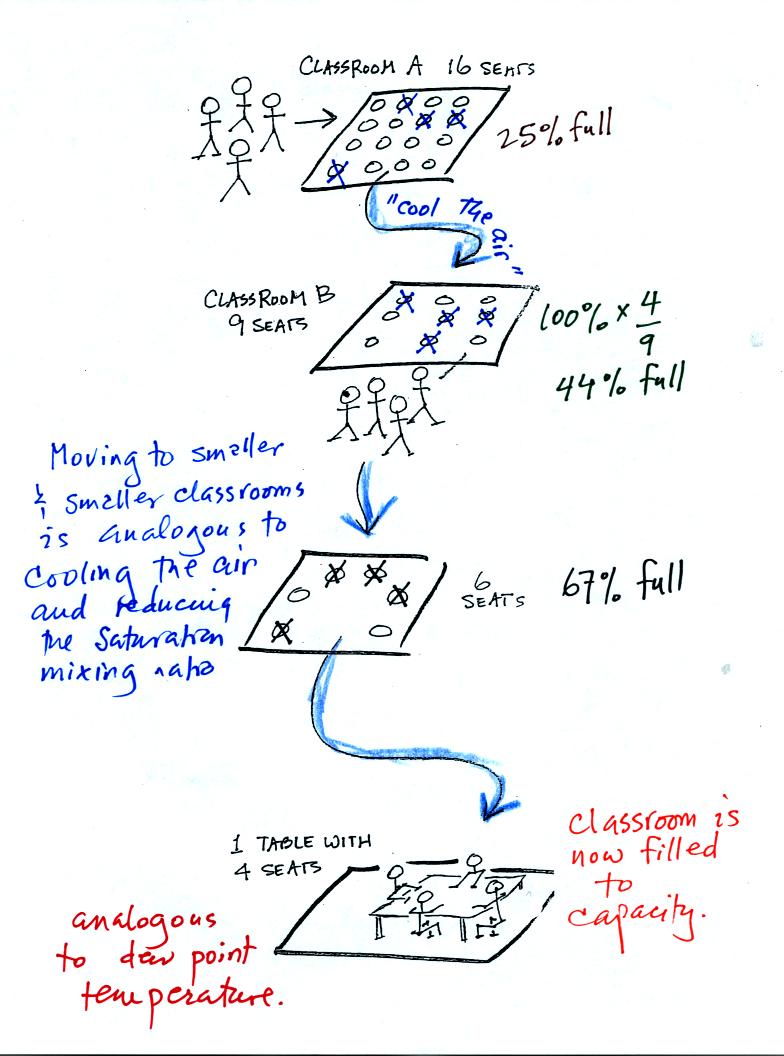
Now back to our students and classrooms analogy. The 4 students
move into classrooms of smaller and smaller capacity. The
decreasing capacity of the classrooms is analogous to the
decrease in saturation mixing ratio that occurs when you cool
air. Eventually the students move into a classroom that they just
fill to capacity. This is analogous to cooling the air to the dew
point temperature, at which point the RH becomes 100% and the air is
filled to capacity, the air is saturated with water vapor.
Next we
will try to understand better why it is possible to saturate air with
water vapor. Why is there an upper limit to the amount of water
vapor that air can contain. Why does this upper limit depend on
air temperature.
First we need to understand that the rate at which water evaporates
depends on the water's temperature.
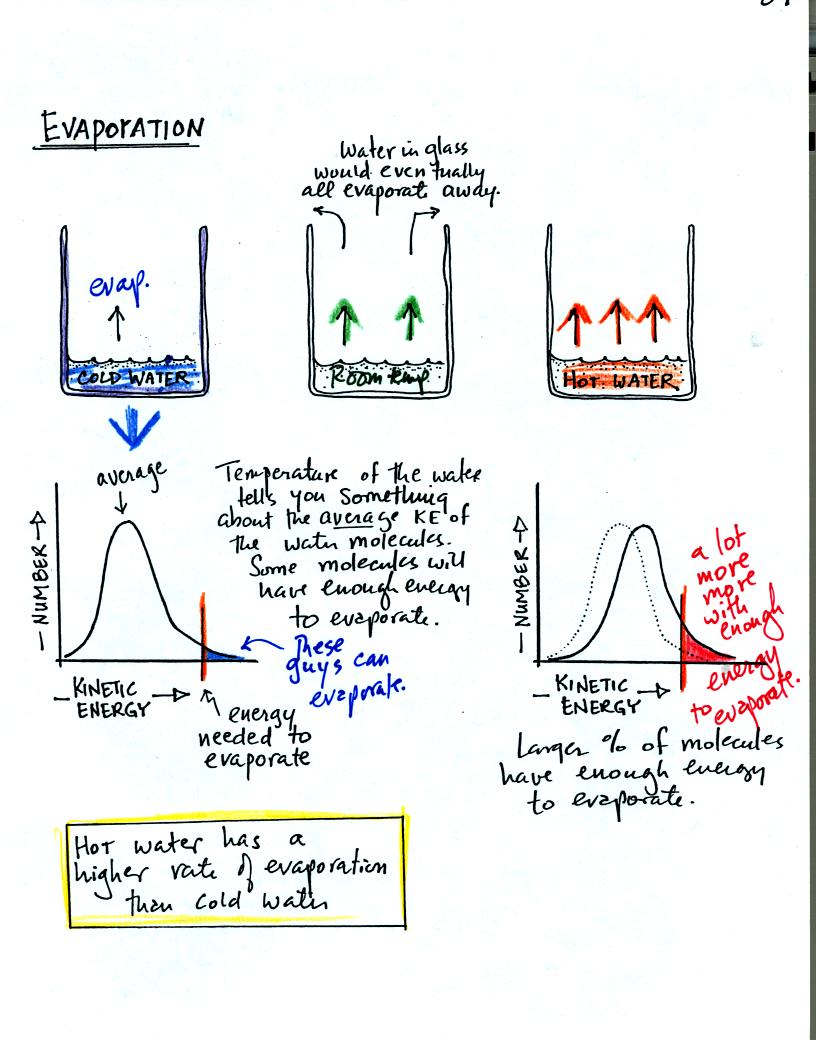
To be able to evaporate a water molecule must make its way
up to the
surface of the water and the water molecule must have sufficient energy
to overcome any attractive forces trying to keep it in a liquid
state. In cold water only a limited number of the water molecules
have the necessary energy - cold water has a low rate of
evaporation. In hot water, a larger fracton of the water
molecules will have enough energy, hot water evaporates more rapidly.
Now we will look at the top part of p. 85 in the photocopied
notes. We have put a cover on the glass of room temperature
water.
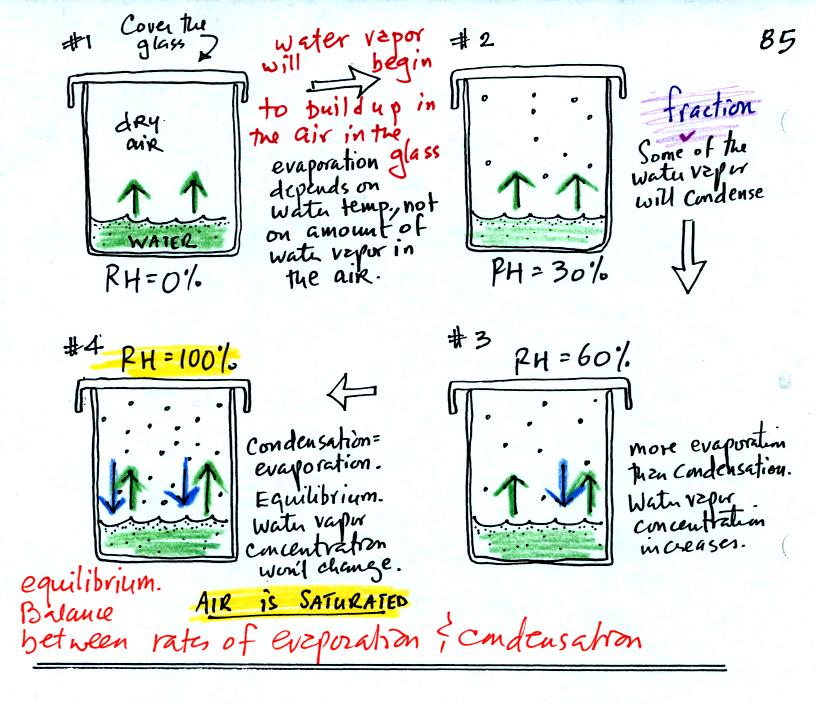
In #1 we see that the water is evaporating (2 arrows worth of
evaporation). Water vapor will begin to build up in the air in
the glass. This is shown in #2. Some of the water vapor
molecules will condense (even though they may have just
evaporated). In Fig. #3 the amount of water vapor has built up to
a point where there is one arrow worth of condensation. In #3
there is still more evaporation than condensation so the water vapor
concentration will increase a little bit more. Eventually in #4
the water vapor concentration has increased to a point that there are
two arrows of condensation. This balances the 2 arrows of
evaporation. The air is saturated, the air is filled to
capacity. The amount of water vapor in the air will remain
constant.
What would happen if we took off the cover and added some more water
vapor to the glass in Fig. #4?
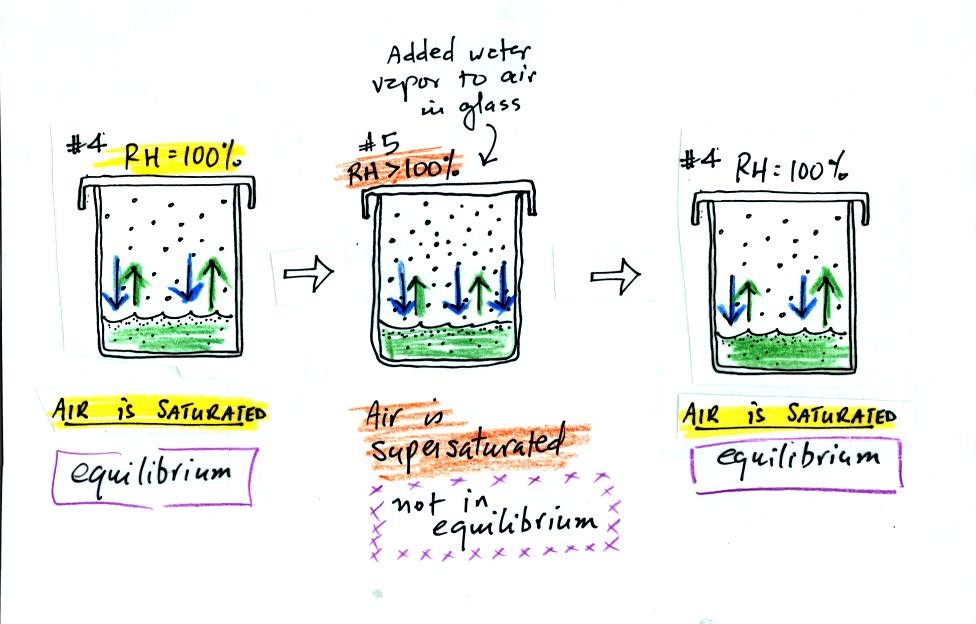
The air in Fig. #5 shows what would happen. The air
would be supersaturated with water vapor and the RH would be greater
than 100%. This is possible but it is not an equilibrium
situation. The increased amount of water vapor would increase the
rate of condensation. There would be more condensation than
evaporation. The water vapor concentration would begin to
decrease. Eventually the glass would end back at the equilibrium
situation in Fig. #4.
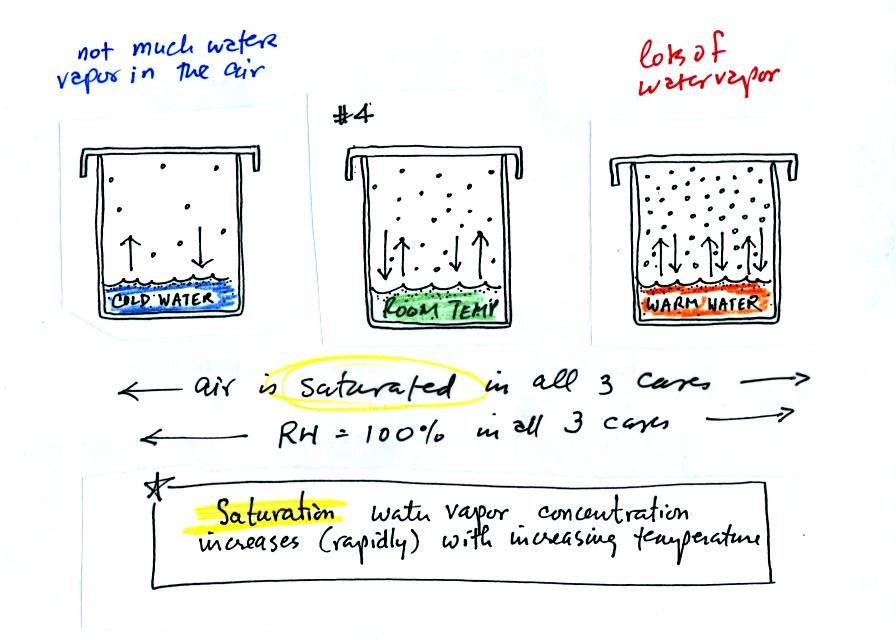
Now we look at the bottom of p. 85. The air in all three cases is
saturated (equal rates of evaporation and condensation in each
case). The relative humidity is 100% in all three cases.
The amount of water vapor in the air however is different. The
warm air contains a lot more water vapor than the cold air.
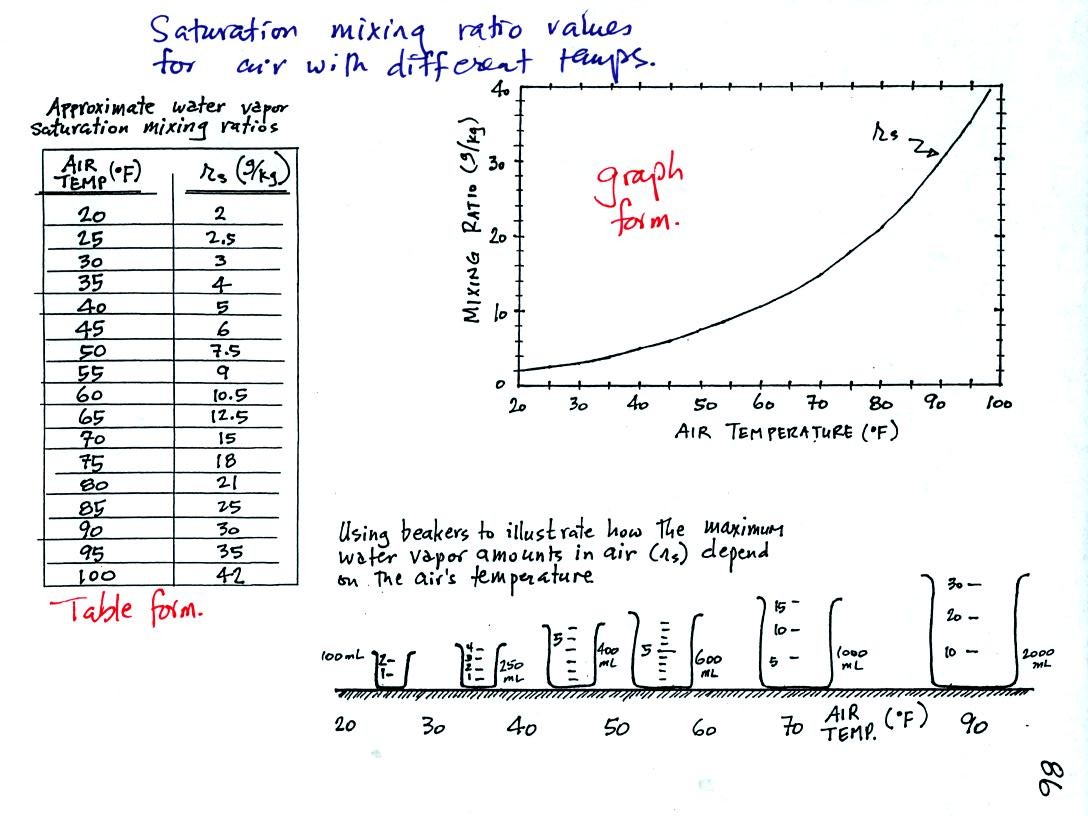 Saturation
mixing ratio values for air with different temperatures. Data are
given in table and graph form. The beakers illustrate the
relative amounts of water vapor that air can contain.
Saturation
mixing ratio values for air with different temperatures. Data are
given in table and graph form. The beakers illustrate the
relative amounts of water vapor that air can contain.
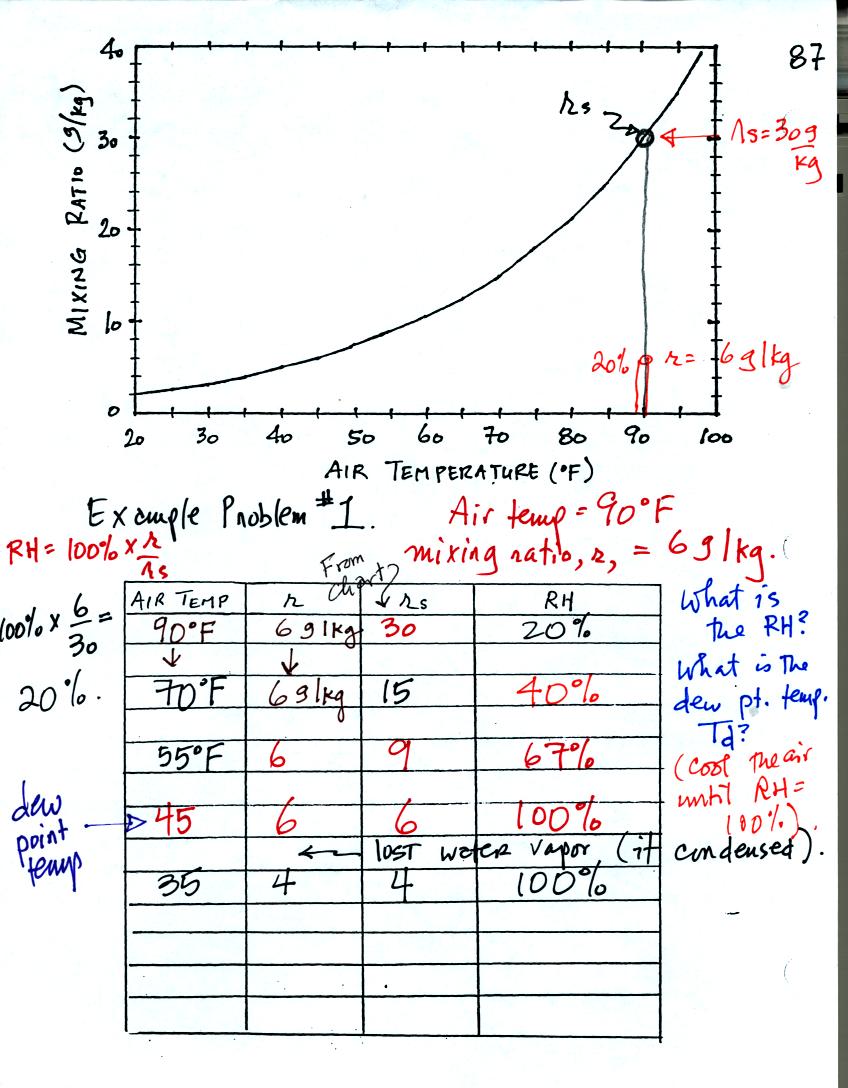
Here is a sample problem that we worked in class.
You'll have a
heck of a time unscrambling this so the steps we followed are retraced
below:
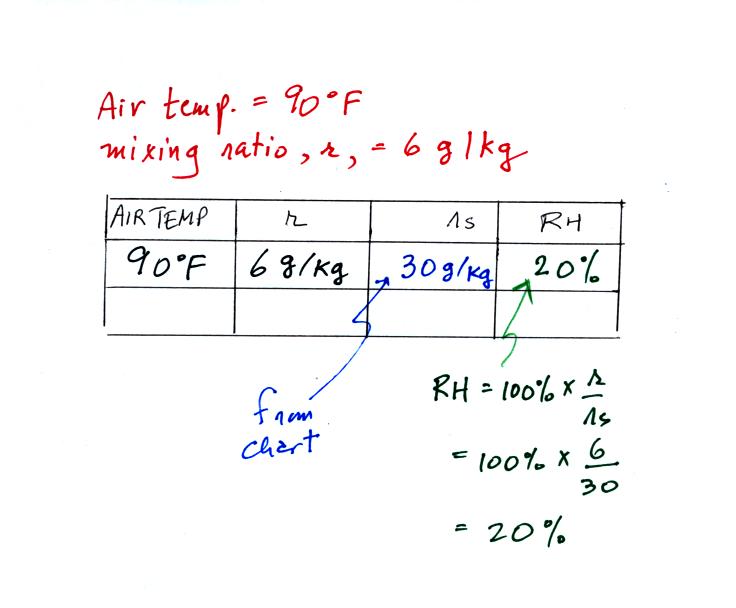
We were given some starting information: an air temperature
of 90 F and
a mixing ratio value of 6 g/kg. We are supposed to find the
relative humidity and the dew point temperature.
We start by entering the data we were given in the table. Once
you know the air's temperature you can look up the saturation mixing
ratio value; it is 30 g/kg for 90 F air. 90 F air could
potentially hold 30 grams of water vapor per kilogram of dry air (it
actually contains 6 grams per kilogram in this example).
Once you know mixing ratio and saturation mixing ratio you can
calculate the relative humidity.
The numbers we just figured out are shown on the top line
above.
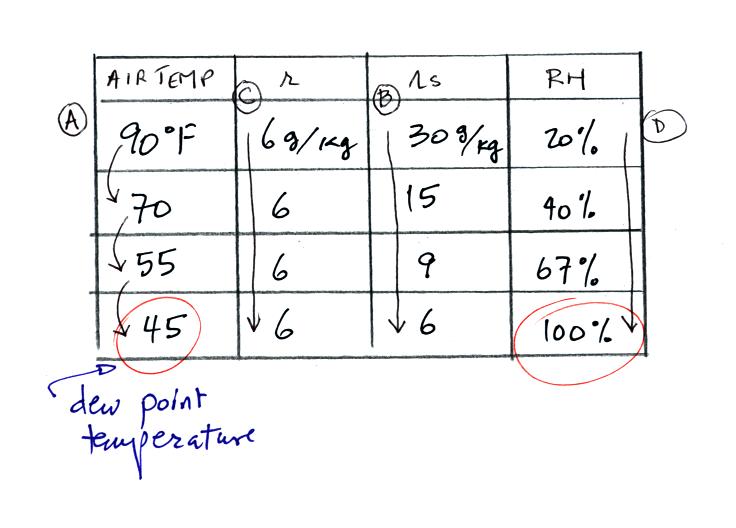
(A) We imagined cooling the air from 90F to 70F, then to 55F, and
finally to 45F.
(B) At each step we looked up the saturation mixing ratio and entered
it on the chart. Note that the saturation mixing ratio values
decrease as the air is cooling.
(C) The mixing ratio doesn't change as we cool the air. The only
thing that changes r is adding or removing water vapor and we are doing
neither.
(D) Note how the relative humidity is increasing as we cool the
air. The air still contains the same amount of water vapor it is
just that the air capacity is decreasing.
Finally at 45 F the RH becomes 100%. The dew point temperature in
this problem is 45 F.
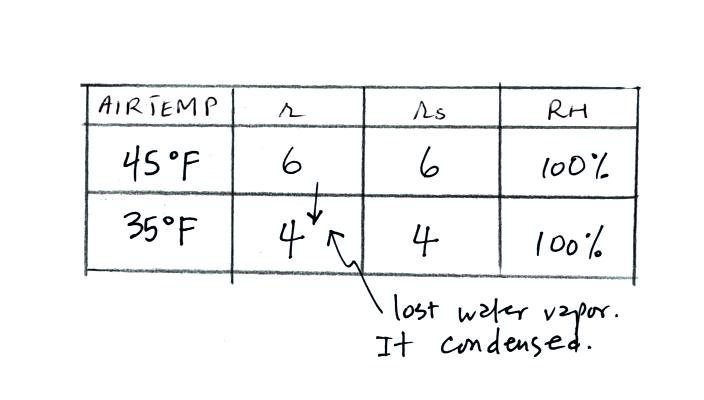
What would happen if you cooled the air below the dew point
temperature. 35 F air can't hold the 6 grams of water vapor
that 45 F air can. You can only "fit" 4 grams of water vapor into
the 35 F air. The remaining 2 grams would condense. If
this happened at ground level the ground would get wet with dew.
If it happens above the ground, the water vapor condenses onto small
particles in the air and forms fog or a cloud. Now because water
vapor is being taken out of the air (and turned into water), the mixing
ratio will decrease from 6 to 4.