Thursday Nov. 17, 2011
click here to
download today's notes in a more printer friendly format
The El Tour de Tucson bicycle race/ride is Saturday so some
bicycle racing instead of music before class this morning. We saw
the
last few kilometers up the infamous Mont Ventoux from the 2000 Tour de
France. Marco
Pantani just edged out Lance Armstrong at the finish line. Here are the
last couple of minutes of the race.
Several additional topics have been added to 1S1P Assignment
#3. There's also a new 1S1P
Bonus
Assignment. That will
probably be it for this semester.
Please also check to see if your name is on this
list of students that don't
yet have an experiment (or book or scientific paper) report
grade. If I've listed your name by mistake please let me know and
accept my apologies. If you're not currently working on something
you should
check with me right away.
In the time it took to get Thursday's notes online, the Quiz #4 Study Guide Pt. 2 has appeared
online.
Here's another picture of the day. Peppers from my vegetable
garden, just in time for Thanksgiving.
The Fall 2011 edition of the Toilet
Bowl
Flushing Experiment turned out just as it was supposed to. The
results are shown
below. The bottom row shows that clockwise and counterclockwise
spinning were equally likely. That's what you would expect when
the Coriolis force doesn't play any
role at all. If we had performed the experiment in the southern
hemisphere we would have obtained the same result.
|
clockwise
|
counterclockwise
|
MWF class
|
27
|
31
|
T Th class
|
36
|
33
|
Totals
from both
classes
|
63
|
64
|
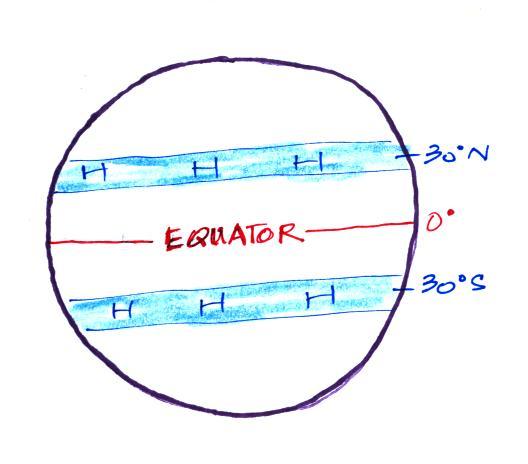
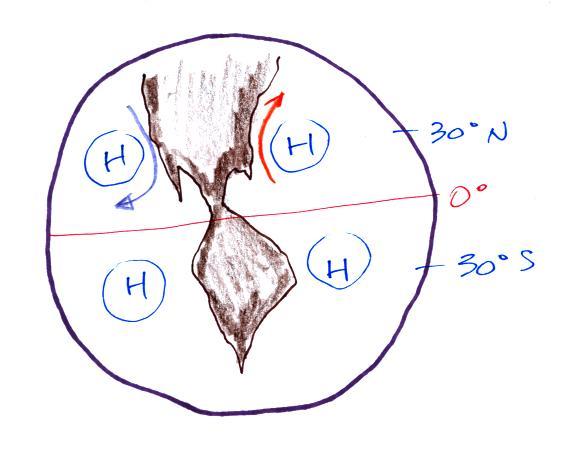
The 3-cell model
assumes that the earth is of uniform composition and not tilted toward
or away from the sun. It predicts belts of high pressure at 30 N
and 30 S latitude as shown above at left. Because the
real world
has oceans and continents we find centers of high pressure, not
belts, located
near 30 latitude. They move north and south of 30 degrees during
the year as the N. Pole tilts toward and away from the sun.
Here's a little more carefully
drawn picture (on one side of a class handout). Winds blowing
around these centers of high
pressure create some of the world's major ocean currents.
The California current is a cold southward
flowing current found off the west coast of the US. The Gulf
Stream is the warm northward flowing current along the east
coast.
The figure above shows the intertropical convergence zone (the dotted
dashed line) south of the Equator. This happens during the
northern hemisphere winter. A second similar figure was included
on the class handout. It showed the ITCZ north of the
Equator. That is the situation during the northern hemisphere
summer.
The subtropical high pressure centers also move north and
south of their nominal locations near 30 latitude. Movement of
these features is part of what causes our summer monsoon

Tucson gets
about 12 inches of rain
in a normal year. About half of this comes during
the "summer monsoon" season. The word monsoon refers to a
seasonal change in wind direction. During the summer, subtropical
high pressure (the Pacific high) moves north of 30 N
latitude. Winds on the southhern side of the subtropical high
have an easterly component. Moist air originating in Mexico
and from over warm water in the Gulf of Mexico blows into
Arizona. The sun heats the
ground during the day, warm moist air in contact with the ground rises
and
produces convective thunderstorms.
The close proximity of the Pacific high, with its sinking air motions,
is what gives California, Oregon, and Washington dry summers.
In the winter the subtropical high moves south of 30 N latitude.
Winds to the north of the high blow from the west. Air
originating over the Pacific Ocean is not as moist because the water is
colder than the Gulf of Mexico. In addition the air loses much of
its moisture as it
crosses mountains in California (remember the rain shadow
effect). The air is pretty dry by the time it reaches
Arizona. Significant winter rains occur in Arizona when storms
systems are able to draw moist subtropical air from the southwest
Pacific ocean into
Arizona.

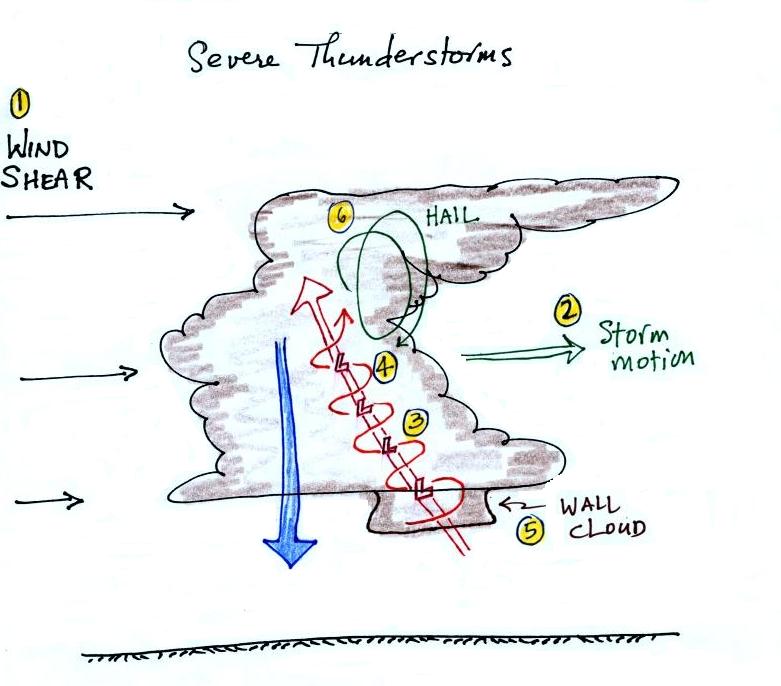
This figure is on p. 154a in the ClassNotes.
Severe
storms are more likely to form when there is vertical wind shear.
Wind
shear (pt 1) is changing wind direction and/or wind speed with
distance. In
this case, the wind speed is increasing with increasing altitude, this
is vertical wind shear.
A thunderstorm that forms in this kind of an environment
will move at an average of the speeds at the top and bottom of the
cloud (pt.
2).
The thunderstorm will move to the right more rapidly than the air at
the ground
which is where the updraft begins. Rising air that is situated at
the
front bottom edge of the thunderstorm will find itself at the back edge
of the
storm when it reaches the top of the cloud.
This produces a
tilted
updraft (pt. 3). The downdraft is situated at the back of the
ground. The updraft is continually moving to the right and
staying away
from the downdraft. The updraft and downdraft coexist and do not
"get in each others way." If you remember in air mass
thunderstorms, the downdraft gets in the way of the updraft and leads
to dissipation of the storm.
Sometimes
the
tilted
updraft
will
begin
to
rotate.
A
rotating
updraft is
called a mesocyclone
(pt. 4). Meso refers to medium size
(thunderstorm size)
and cyclone
means winds spinning around low pressure. Low pressure in the
core of the
mesocyclone creates an inward pointing
pressure
gradient force needed to keep the updraft winds spinning in circular
path (low
pressure also keeps winds spinning in a tornado).
The cloud that
extends
below the cloud base and surrounds the mesocyclone
is
called a wall cloud (pt.
5). The largest and strongest tornadoes
will
generally come from the wall cloud. You'll see some pretty
dramatic videos of wall clouds next week (hopefully with sound).
Note (pt. 6) that a tilted updraft provides a way of keeping growing
hailstones
inside the cloud. Hailstones get carried up toward the top of the
cloud
where they begin to fall. But they then fall
back into
the strong core of the updraft and get carried back up toward the top
of the
cloud.
The
United
States
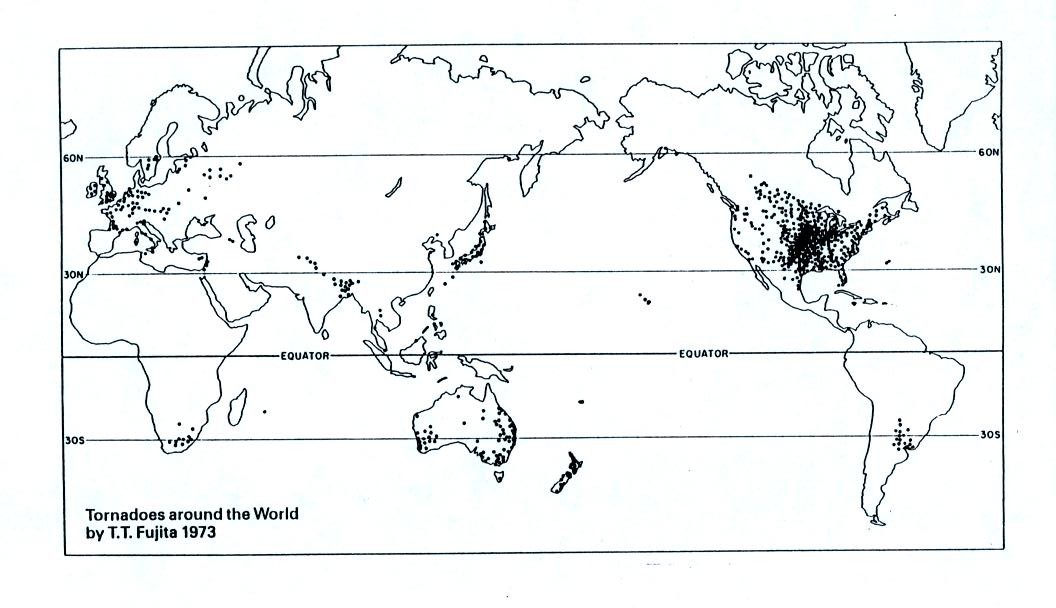
has more tornadoes in an
average year than
any
other country in the world (over 1000 per year). The
central
US
has
just
the
right
mix
of
meteorological
conditions.
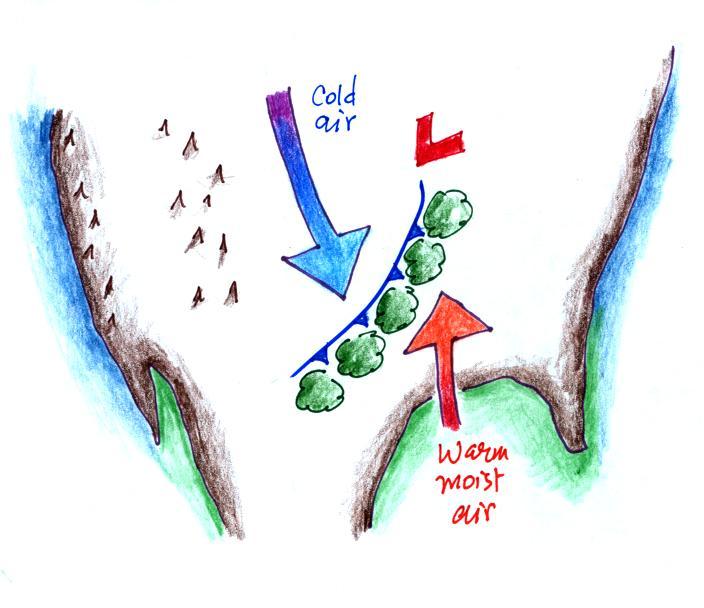
I got a little carried away with
the colored pencils on this picture. Without
any
mountains in the way, cold
dry
air can move in the spring all the way
from
Canada to the Gulf Coast. There is collides with warm moist air
from the Gulf of Mexico to form strong cold fronts and thunderstorms.
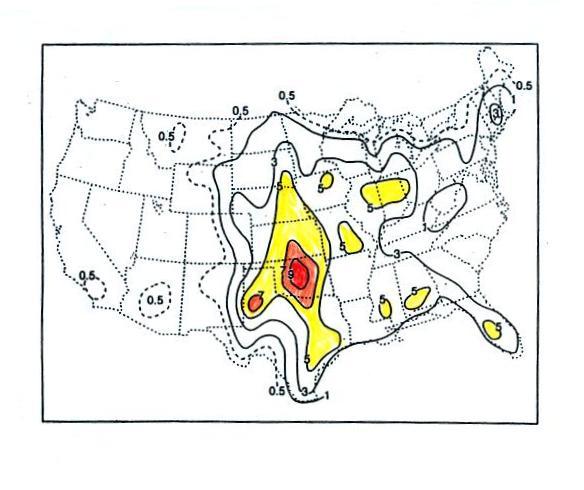
Tornadoes
have been
observed in
every state in the US, but tornadoes are most frequent in the central
plains, a region referred to as "Tornado Alley" (highlighted in red,
orange, and yellow above). You'll
find this map on p. 161 in the photocopied ClassNotes.
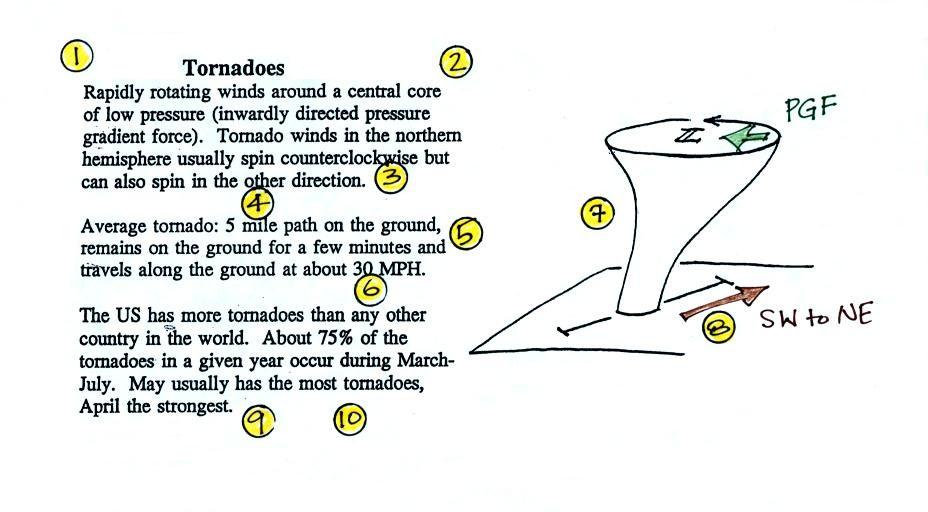
Here are some basic
tornado
characteristics (the figure above is also on p. 161)
1. About 2/3rds of tornadoes
are F0 or F1 tornadoes (we'll learn moare about the Fujita scale used
to rate
tornado intensity later today and next week) and have spinning
winds of
about 100 MPH or less. Microburst winds can also reach 100
MPH. Microbursts are much more common in Tucson in the summer
than tornadoes and can inflict
the same level of damage.
2. A very strong inwardly directed pressure
gradient force is needed to keep winds spinning in a circular
path. The pressure in the center core of a tornado can be 100 mb
less than
the pressure in the air outside the tornado. This is a very large
pressure difference in such a short distance. The
PGF
is
much
stronger
than the Coriolis Force (CF) and the CF can be
neglected.
3. Because the Coriolis force doesn't play a
role, tornadoes can spin clockwise or
counterclockwise, though
counterclockwise rotation is more common. This might be because
larger scale motions in the cloud (where the CF is important, might
determine the direction of spin in a tornado).
4, 5, 6. Tornadoes usually last only a few
minutes, leave a path
on the ground that is a few miles
long, and move at a few 10s of MPH. There are exceptions, we'll
look at one shortly.
7, 8. Most tornadoes
move from the SW toward the NE. This is because tornado-producing
thunderstorms are often found just ahead of a cold front. Winds
ahead of a cold front often blow from the SW. Most
tornadoes
have
diameters
of
tens
to
a
few
hundred
yards
but
tornadoes
with
diameters over a mile have been observed.
9, 10. Tornadoes
are
most
frequent
in
the
Spring.
The
strongest
tornadoes
also
occur
at
that
time of year. Tornadoes are most common in the late
afternoon when the atmosphere is most unstable.
The two tables above are on p. 161
in the photocopied
ClassNotes. At the present time about 75 people
are
killed
every year in the
United States. This is about a factor of ten less than a century
ago due to improved methods of detecting tornadoes and severe
thunderstorms. Modern day communications also make easier to warm
people of dangerous weather situations. Lightning and flash
floods (floods are the most
serious
severe weather hazard) kill slightly more people. Hurricanes kill
fewer people on average than tornadoes.

This figure traces
out
the path of the 1925 "Tri-State
Tornado" . The
tornado path (note the SW to NE orientation) was 219 miles long, the
tornado lasted about 3.5 hours and
killed 695 people. The tornado was traveling over 60 MPH over
much of its path. It is the deadliest single tornado ever in the United
States. The Joplin
Missouri tornado
this past spring (May 22) killed 162 people making it the deadliest
since 1947 and the 7th
deadliest tornado in US history.
Tornadoes often
occur
in
"outbreaks."
The paths of 148
tornadoes
during the April 3-4, 1974 "Jumbo Tornado
Outbreak" are shown above. Note the first tornadoes were
located
in the upper left corner of the map. The tornadoes were produced
by thunderstorms forming along a cold front (see the weather map
below). During this two day
period the front moved from the NW part toward the SE part of the
figure.
Note
that all the tornado paths have a
SE toward NE
orientation.
I tried to show a short video at this point. The video was
OK but there wasn't any sound. And you really need to hear the
sound on something like this. I did find video footage for
several of the tornadoes on YouTube. The table below is a little
more detailed description of the tornadoes shown on the video
tape.
If we were in a room with two screens I would have put this table on
one screen and shown the video on the other.
54a
|
F3
|
Grand Isle, NE
(no sound)
|
Mar.
13,
1990
|
tornado
cloud is pretty
thick and vertical
|
61f
|
F3
|
McConnell
AFB KS
|
Apr.
26,
1991
|
this
is about as close to a
tornado as you're ever likely to get. Try to judge the diameter
of the tornado cloud. What direction are the tornado winds
spinning?
|
52
|
F5
|
Hesston
KS
(no sound)
|
Mar.
13,
1990
|
Watch
closely,
you may see a tree or two uprooted by the tornado winds
|
51
|
F3
|
North
Platte NE
|
Jun.
25,
1989
|
Trees
uprooted
and buildings lifted by the tornado winds
|
65
|
F1
|
Brainard
MN
|
Jul.
5,
1991
|
It's
a good
thing this was only an F1 tornado
|
57
|
F2
|
Darlington
IN
|
Jun.
1,
1990
|
Tornado
cloud
without much dust
|
62b
|
F2
|
Kansas
Turnpike
|
Apr.
26,
1991
|
It's
sometimes
hard to run away from a tornado. Watch closely you'll see a van
blown off the road and rolled by the tornado. The driver of the
van was killed!
|
47
|
F2
|
Minneapolis
MN
|
Jul.
18,
1986
|
Tornado
cloud
appears and disappears. |
I would encourage you to look at the McConnell AFB
video and the Kansas
Turnpike
tornado. The YouTube videos contain more footage
than was on the video tape. The turnpike video also has a warning
that a highway underpass is actually a very dangerous place to take
shelter from a tornado. Here is some additional
information from the Norman OK office of the National Weather
Service. Slide 6 lists some of the reasons why underpasses are so
dangerous.
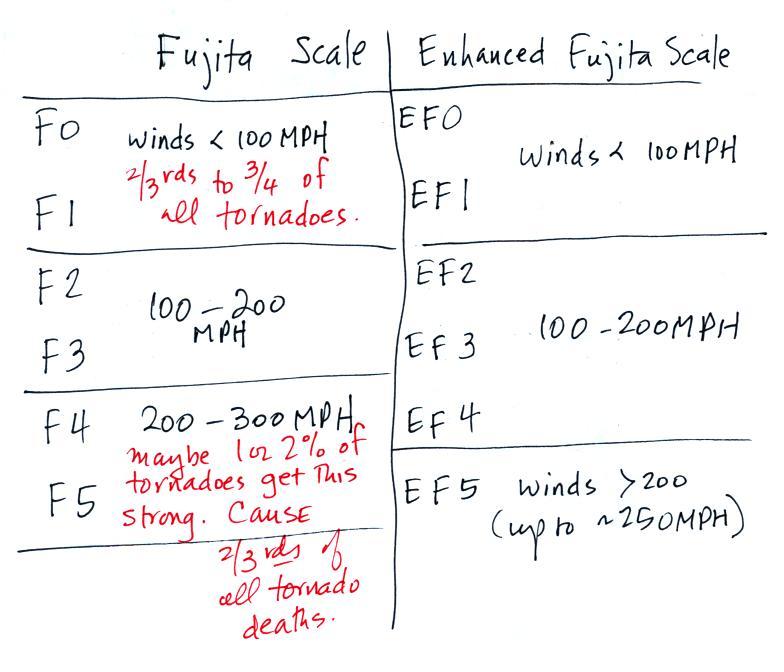
The second column in the table above has the Fujita
Scale rating of each tornado. An easy to
remember version of the Fujita Scale is
shown below.
It is very hard to actually measure the speed of the
rotating winds in a tornado (though this has been done using mobile
Doppler radar). Researchers usually survey the
damage caused by the tornado to come up with a Fujita Scale
rating. The Fujita Scale has recently been revised. The
newer scale is called the Enhanced
Fujita Scale to differentiate it from the original scale introduced
in 1971.
